Júri:
Presidente: Prof. Doutor Pedro Miguel Ribeiro Viana Baptista
Arguente: Prof. Doutora Maria Raquel Murias dos Santos Aires Bairros
Outubro 2017
Orientador: Doutora Ana Cecília Afonso Roque, FCT-UNL
Co-orientadores: Doutora Ana Margarida Nunes da Mata Pires de Azevedo, IST Dissertação para obtenção do Grau de Mestre em
Biotecnologia
Dissertação para obtenção do Grau de Mestre em
[Engenharia Informática] Licenciado em Bioquímica [Habilitações Académicas] [Habilitações Académicas] [Habilitações Académicas] [Habilitações Académicas] [Habilitações Académicas] [Habilitações Académicas] [Habilitações Académicas]
Gonçalo Abrantes e Figueiró
[Nome completo do autor]
[Nome completo do autor]
[Nome completo do autor]
[Nome completo do autor]
[Nome completo do autor]
[Nome completo do autor]
[Nome completo do autor]
Hybrid magnetic systems for the purification of
biopharmaceuticals
Júri:
Presidente: Prof. Doutor Pedro Miguel Ribeiro Viana Baptista
Arguente: Prof. Doutora Maria Raquel Murias dos Santos Aires Bairros Orientador: Doutora Ana Cecília Afonso Roque, FCT-UNL
Co-orientadores: Doutora Ana Margarida Nunes da Mata Pires de Azevedo, IST Dissertação para obtenção do Grau de Mestre em
Biotecnologia
Dissertação para obtenção do Grau de Mestre em
[Engenharia Informática] Licenciado em Bioquímica [Habilitações Académicas] [Habilitações Académicas] [Habilitações Académicas] [Habilitações Académicas] [Habilitações Académicas] [Habilitações Académicas] [Habilitações Académicas]
Gonçalo Abrantes e Figueiró
[Nome completo do autor]
[Nome completo do autor]
[Nome completo do autor]
[Nome completo do autor]
[Nome completo do autor]
[Nome completo do autor]
[Nome completo do autor]
Hybrid magnetic systems for the purification of
biopharmaceuticals
Page | i Hybrid magnetic systems for the purification of biopharmaceuticals
Copyright © Gonçalo Abrantes e Figueiró, Faculdade de Ciências e Tecnologia, Universidade Nova de Lisboa.
A Faculdade de Ciências e Tecnologia e a Universidade Nova de Lisboa têm o direito, perpétuo e sem limites geográficos, de arquivar e publicar esta dissertação através de exemplares impressos reproduzidos em papel ou de forma digital, ou por qualquer outro meio conhecido ou que venha a ser inventado, e de a divulgar através de repositórios científicos e de admitir a sua cópia e distribuição com objectivos educacionais ou de investigação, não comerciais, desde que seja dado crédito ao autor e editor.
Page | iii “If you can dream it, you can do it.” Walt Disney
Page | v
Agradecimentos
De forma geral, quero agradecer a todas as pessoas que me ajudaram na conclusão desta etapa da minha vida, a tese de mestrado.
Em primeiro lugar gostaria de agradecer à minha orientadora, professora Ana Cecília Roque, pela oportunidade única que me deu, mas acima de tudo pela forma que me ajudou e orientou nas fases mais difíceis. Obrigado pelas conversas encorajadoras que me permitiram estar sempre de cabeça erguida e nunca desistir.
Também gostaria de agradecer à minha co-orientadora, Doutora Ana Azevedo, por me ter recebido de forma tão acolhedora no IST de Lisboa, e pelas ajudas e explicações dadas às várias dúvidas que me iam surgindo.
Quero agradecer a todos os colegas do laboratório, pelo bom ambiente de trabalho e a espetacular entreajuda que existe dentro do grupo. Susana Palma, obrigado pela ajuda dada nas partículas magnéticas e pelos momentos divertidos passados na caracterização das partículas. Um especial obrigado à Ana Pina, pelos momentos de conversa e de apoio emocional nos momentos de mais stress. Quero, ainda, agradecer à Raquel pelo apoio, pelas conversas e pelas inúmeras perguntas que me ia fazendo, o que me fez estar bem preparado para a tese.
Aos companheiros de laboratório, Gonçalo Teixeira, Marta Banza e Beatriz Mariz quero agradecer vossa companhia e os bons momentos que passamos juntos, quer na centrífuga quer no compartimento do pessoal mais porreiro.
Às amizades que se fizeram, um especial obrigado às Joanas, Joana Valente e Joana Margarida, pela companhia e à grande paciência que tiveram comigo. Quero também agradecer ao Emanuel Capela,à Alexandra Wagner e à Paulinha Amorim por me ajudarem a integrar no grupo de laboratório no IST e pelo apoio dado. Ao José Jurado, Cássia Oliveira e Paula Kaori quero agradecer a vossa companhia e quero dizer que gostei muito de vos ter conhecido e espero que um dia nos voltemos a ver.
Aos meus amigos e colegas de curso, Rita Bernardino, Sara Mateus, Liane Meneses, Gonçalo Teixeira, Eliana Guarda e Juliana Almeida um grande obrigado pelos bons momentos passados todos juntos, pelos jantares e às viagens, que ajudaram animar nos momentos mais difíceis. Bernardo Carvalho, apesar de teres estado na Bélgica, fazes parte também deste pequeno grande grupo.
Um grande obrigado e abraço aos meus amigos Bioqs, Ricardo Santo, Bruna Santos e Adriana Mamede, que apesar de estarem longe terão sempre um lugar no coração e pensamento.
Por fim, quero agradecer de modo especial a toda a minha família por terem acredito em mim e terem investido no meu futuro. Quero agradecer aos meus dois irmãos, Eduardo Abrantes e Duarte Gregório, por fazerem os dias maus, dias mais alegres e animados.
Page | vii
Resumo
Os anticorpos monoclonais são utilizados como agentes terapêuticos em todo o mundo e têm uma grande procura no mercado. No entanto, o processamento de purificação deste biofármaco representa entre 50-80% do custo total de fabricação do produto e, portanto, novos métodos, que sejam menos caros, mas também eficientes, são necessários. O objetivo deste trabalho foi desenvolver um método não cromatográfico para a purificação de anticorpos a partir de sobrenadantes de culturas celulares, combinando dois métodos, nomeadamente a extração em duas fases aquosa (ATPS) e a separação magnética.
O comportamento de um novo ATPS composto por polietilenoglicol (PEG) e poliacrilato de sódio (NaPA) foi investigado variando a concentração de NaCl e o peso molecular do NaPA. Este estudo permitiu selecionar sistemas compostos por 10% de PEG 3.350, 10% de NaPA e 0 mM ou 150 mM de NaCl para estudos posteriores de partição de albumina de soro bovino (BSA), utilizado como contaminante modelo, e imunoglobulina G (IgG).
Simultaneamente, partículas magnéticas (MNPs) com dois revestimentos diferentes foram sintetizadas e avaliados quanto à ligação às proteínas. As MNPs revestidas com dextrano e modificadas com o ligando 22/8 (MNP-DX-22/8) foram selecionados devido à sua fácil síntese e por apresentarem uma grande afinidade e seletividade pela IgG humana (88,0 mg IgG / g suporte, que foi 3,5 vezes maior que a ligação à BSA).
O sistema PEG-NaPA composto por PEG 3,350, NaPA 15,000 e 150 mM de NaCl foi escolhido como o sistema de pesca magnética aquoso de duas fase (MATPFS) mais adequado para recuperar IgG na presença das partículas MNP-DX-22/8. Os estudos de controlo que consistiram na utilização separada de ATPS e pesca magnética para purificar IgG a partir de um sobrenadante de cultura celular apresentaram baixos rendimentos de purificação, 45% e 12%, e baixos graus de pureza, 84% e 76%, respetivamente. A combinação destes dois métodos permitiu uma recuperação de 78% de IgG do sobrenadante da cultura celular com 93% de pureza.
Palavras-chave: Sistema aquoso de duas fases, Partículas magnéticas, Anticorpos, Bioseparação, Processo de purificação
Page | ix
Abstract
Monoclonal antibodies are used as therapeutic agents worldwide and have a great market demand. However, the downstream processing of these biopharmaceuticals represents between 50-80% of the total manufacturing costs and therefore new methods which are less expensive but also efficient are needed. The aim of this work was to develop a non-chromatographic method for the purification of antibodies from cell culture supernatants by process integration of two methods, namely aqueous two-phase extraction (ATPE) and magnetic fishing.
The behavior of a new aqueous two-phase systems (ATPS) composed by polyethylene glycol (PEG) and sodium polyacrylate (NaPA) was investigated by varying the NaCl concentration and the molecular weight of NaPA. From this study, systems composed by 10% of PEG 3,350, 10% NaPA and 0 mM or 150 mM of NaCl were selected to study the partition of bovine serum albumin (BSA) used as a model contaminant and immunoglobulin G (IgG).
Simultaneously, magnetic particles (MNPs) with different coatings were synthesized and assessed for protein binding. Dextran coated MNPs modified with ligand 22/8 (MNP-DX-22/8) were selected due to the easier synthesis and the high affinity and selectivity towards human IgG (88.0 mg IgG/g of support, which was 3.5 higher than the binding to contaminant BSA).
When the MNP-DX-22/8 were applied in the PEG-NaPA systems, the PEG-NaPA 15,000 with 150 mM of NaCl was chosen as the most suitable magnetic aqueous two phase fishing system (MATPFS) to recover IgG. The control studies using separately the ATPE and magnetic fishing to purify IgG from a cell culture supernatant, showed low yields of purification, 45% and 12%, and low purity degree, 84% and 76%, respectively. The combination of these two methods allowed the recovery of 78% of IgG from the cell culture supernatant with 93% of purity.
Keywords: Aqueous two-phase system, Magnetic Particles, Antibodies, Bioseparation, Downstream processing
Page | xi
Contents
Agradecimentos ... v Resumo ... vii Abstract ... ix Index of Figures ... xvIndex of Tables ... xix
List of Abbreviations... xxi
1. Literature Review ... 1
1.1 Antibodies ... 3
1.1.1 Structure ... 3
1.1.2 Upstream Processing ... 5
1.1.3 Downstream Processing ... 6
1.2 Aqueous Two Phase Systems ... 7
1.2.1 Phase Diagram ... 7
1.2.2 Bioseperation in Aqueous Two Phase Systems ... 8
1.3 Magnetic Nanoparticles ... 9
1.3.1 Properties and applications ... 9
1.3.2 Magnetic nanoparticles in Bioseparation ... 11
2. Background and Aim of the work ... 13
3. Materials and Methods ... 17
3.1 Materials ... 19
3.1.1 Chemicals ... 19
3.1.2 Equipment ... 20
3.2 Methods ... 21
3.2.1 Aqueous two phase systems ... 21
3.2.1.1 Characterization – Determination of phase diagrams ... 21
3.2.1.2 BSA and IgG partitioning ... 22
3.2.2 Magnetic particles ... 22
3.2.2.1 Synthesis of MNPs ... 22
3.2.2.2 MNP with Dextran ... 23
Amination of MNPs ... 23
22/8 ligand synthesis ... 23
3.2.5.1 Quantification of amines by Kaiser Test ... 26
3.2.5.2 Characterization of MNPs ... 26
3.2.5.3 BCA Assay ... 27
3.2.5.4 SDS-PAGE of protein samples and staining ... 27
Blue-Coomassie staining ... 28
Silver Staining ... 28
4. PEG and NaPA Aqueous two phase system ... 29
4.1 Introduction ... 31
4.2 Binodal curves of PEG/NaPA ATPS ... 32
4.2.1 Effect of NaCl concentration ... 32
4.2.2 Effect of NaPA molecular weights ... 33
4.3 Partitioning of pure proteins in PEG/NaPA ATPSs ... 35
4.3.1 BSA ... 35
4.3.2 IgG ... 36
4.4 Conclusions ... 37
5. Magnetic Fishing ... 39
5.1 Introduction ... 41
5.2 Production of functionalized magnetic particles ... 42
5.3 Magnetic Particles Characterization ... 45
5.3.1 Fourier transform infrared spectroscopy ... 45
5.3.2 Hydrodynamic diameter ... 46
5.3.3 Zeta potential ... 48
5.3.4 Affinity Assays ... 49
5.3.4.1 Protein Binding to MNP-DX-22/8 ... 49
Page | xiii
6. Magnetic aqueous two phase fishing ... 54
6.1 Introduction ... 56
6.2 MNPs partitioning ... 57
6.3 Protein Recovery ... 58
6.3.1 BSA recovery from MATPFS ... 58
6.3.2 IgG recovery from MATPFS ... 60
6.4 Cell culture supernatant purification ... 62
6.4.1 Protein A Affinity Chromatography ... 62
6.4.2 Aqueous two phase system ... 64
6.4.3 Magnetic Fishing ... 65
6.4.4 Magnetic Aqueous Two Phase Fishing ... 67
6.5 Conclusions ... 70
7. Concluding Remarks ... 72
Page | xv
Index of Figures
Figure 1.1 – Structure of an IgG antibody and its degradation by proteases like papain and pepsin. An IgG antibody has two heavy chains (orange) and two light chains (green), each one with constant and variable domains. In the heavy chain, there are three constant domains (CH) and one variable (VH), while in the light chain there is only one constant domain (CL) and one variable (VL). The combination between variable chains of heavy and light chains determine the two antigen-binding sites of the antibody. Adapted from [5], [6]. ... 4 Figure 1.2 – Scheme of the mAbs upstream processing. Adapted from [14] ... 6 Figure 1.3 – Scheme of mAb purification (UF/DF: ultrafiltration/diafitration). Adapted from [19] ... 7 Figure 1.4 – Example of a binodal curve. In the figure, A, B and C are points of the binodal curve, C is the critical point, A and B represent respectively the equilibrium composition of the top phase and the bottom phase for all points on the tie-line represented. Adapted from [28]. ... 8 Figure 2.1 - Schematic representation of the research work followed in this work. ... 15 Figure 4.1 – PEG-NaPA system where is represented the polymer-rich phase and their receptively chemical structure. This ATPS was formed by PEG 3,350 (10% w/w) and NaPA 1,200 (10% w/w) without salt adding. ... 31 Figure 4.2 - Effect of NaCl concentration in the binodal curve of PEG/NaPA ATPS with different MWs of NaPA. A) Binodal curves of PEG/NaPA 1.200 ATPS; B) Binodal curves of PEG/NaPA 8.000 ATPS; C) Binodal curves of PEG/NaPA 15.000 ATPS. NaCl concentrations: — 0 mM; — 150 mM; — 300 mM; — 450 mM. ... 32 Figure 4.3 - Effect of NaPA MW in the binodal curves of PEG/NaPA ATPS with different NaCl concentrations. . A) Binodal curves of PEG/NaPA ATPSs with 0 mM of NaCl; B) Binodal curves of PEG/NaPA ATPSs with 150 mM of NaCl; C) Binodal curves of PEG/NaPA ATPSs with 300 mM of NaCl; D) Binodal curves of PEG/NaPA ATPSs with 450 mM of NaCl. NaPA MWs: — 1.200; — 8.000; — 15.000. ... 34 Figure 4.4 - Effect of NaPA MWs (1,200, 8,000 and 15,000) and NaCl concentrations (0 and 150 mM) on the partitioning of BSA in the PEG/NaPA system (n=2). ... 35 Figure 4.5 –Effect of NaPA MWs (1,200, 8,000 and 15,000) and NaCl concentrations (0 and 150 mM) on the partitioning of IgG in the PEG/NaPA system. A) Systems without salt addition; B) Systems with 150 mM of NaCl (n=2). ... 36 Figure 4.6 - Precipitation of IgG in the PEG-NaPA 1,200 ATPS without salt addition. ... 36 Figure 5.1 – Schematic representation of chemical modifications on iron oxide particles to produce MNP-DX-22/8. ... 42 Figure 5.2 - Schematic representation of chemical modifications on iron oxide particles to produce MNP-GA-BA. ... 42
(n=3). ... 47 Figure 5.7 – Hydrodynamic diameter for the magnetic particles using the Horiba SZ-100 (n=3). ... 48 Figure 5.8 – Variation of zeta potential with pH for the MNPs coated with polymer and with ligand (n=3). ... 49 Figure 5.9 – Affinity assays results for MNP-DX-22/8, where: A) is the affinity binding of BSA and IgG to MNP-DX and MNP-DX-22/8, this result is normalized per gram of particles used in each assay; B) and C) are the percentage results of binding, elution and recovery of BSA and IgG, respectively (n=2). ... 50 Figure 5.10 - Affinity assays results for MNP-GA-BA, where: A) is the affinity binding of BSA and IgG to MNP-GA and MNP-GA-BA, this result is normalized per gram of particles used in each assay; B) and C) are the percentage results of binding, elution and recovery of BSA and IgG, respectively (n=2). ... 51 Figure 6.1 – Schematic representation of the MATPFS. In A is represented a PEG-NaPA system with MNP-DX-22/8; in B is represented the response of MNPs upon application magnetic field. After the MNPs capturing these will be washed to remove non-specifically adsorbed proteins, and then elution conditions are applied to recover the protein bound to the MNPs, in order to obtain purified IgG. ... 56 Figure 6.2 - PEG-NaPA systems with MNP-DX (A and C) and MNP-DX-22/8 (B and D). In each figure, from left to right: PEG-NaPA 1,200, PEG-NaPA 8,000 and PEG-NaPA 15,000. ... 57 Figure 6.3 – Distribution of BSA in the PEG-NaPA systems in the presence of MNPs without (A), B), C)) or with (D), E), F)) salt addition. A) and D) represent the results to the PEG-NaPA 1,200 system; B) and E) represent the results to the NaPA 8,000 system; and C) and F) represent the results to the PEG-NaPA 15,000 system (n=2). ... 58 Figure 6.4 –Binding and recovery of BSA from the MATPFS: A) Binding chart - Percentage of BSA bound to the MNPs after washing with binding washes; B) Elution chart - percentage of BSA eluted from them after washing with elution buffer; C) Recovery chart - percentage of BSA that was able to recover from a BSA pure solution, after all washes (n=2). ... 59 Figure 6.5 - Distribution of IgG in the PEG-NaPA systems in the presence of MNPs without (A), B), C)) or with (D), E), F)) salt addition. A) and D) represent the results to the PEG-NaPA 1,200 system; B) and E) represent the results to the NaPA 8,000 system; and C) and F) represent the results to the PEG-NaPA 15,000 system (n=2). ... 60
Page | xvii Figure 6.6 - Binding and recovery of IgG from the MATPFS: A) Binding chart - Percentage of IgG bound to the MNPs after washing with binding washes; B) Elution chart - percentage of IgG eluted from them after washing with elution buffer; C) Recovery chart - percentage of IgG that was able to recover from a IgG pure solution, after all washes (n=2). ... 61 Figure 6.7 - SDS-PAGE analysis of the crude extract composition. MW - Molecular Weight Marker, L1- loading sample (sample of crude extract) diluted 1:4 with the loading buffer, L2 - loading sample diluted 1:3 with the loading buffer, L3 - loading sample diluted 1:2 with the loading buffer. ... 62 Figure 6.8 - SDS-PAGE analysis of crude extract purification using protein A affinity chromatography, the gel was stained by Coomassie (left) and by silver staining (right). MW - Molecular Weight Marker, L- loading sample diluted 1:100 with the loading buffer, FT – flow-through diluted 1:100 with the loading buffer, BW – binding washes pool diluted 10:1 with the loading buffer , E – elution washes pool diluted 10:1 with the loading buffer, L2 - loading sample diluted 1:50 with the loading buffer, FT2 - flow-through diluted 1:50 with the loading buffer. ... 63 Figure 6.9 - SDS-PAGE analysis of crude extract partitioning using the PEG-NaPA 15,000 ATPS with 150 mM of NaCl, the gel was stained by by Coomassie (left) and by silver staining (right). MW - Molecular Weight Marker; L- loading sample diluted 1:2 with the loading buffer; T1/2– Top phase of PEG-NaPA
15,000 diluted 1:2 with the loading buffer (sample 1 and 2); B1/2 – Bottom phase of PEG-NaPA 15,000
diluted 1:2 with the loading buffer (sample 1 and 2) ;L2- loading sample diluted 1:3 with the loading buffer.
... 64 Figure 6.10 – Results of IgG purification using PEG-NaPA 15,000 with 150 mM of NaCl (n=2). ... 65 Figure 6.11 - - SDS-PAGE electrophoretic analysis of precipitate recovered in the PEG-NaPA 15,000 ATPS with 150 mM of NaCl, the gel was stained by silver staining (image to the right). MW - Molecular Weight Marker, L- loading sample diluted 1:2 with the loading buffer; P1/2 – Precipitate formed in the ATPS
1 and 2. ... 65 Figure 6.12 - SDS-PAGE electrophoretic analysis of crude extract purification using the MNP-DX and MNP-DX-22/8, the gel was stained by Coomassie staning (left) and silver staining (right). MW - Molecular Weight Marker; L- loading sample diluted 1:2 with the loading buffer; FT – Flow-through diluted 1:2 with the loading buffer; B – First binding wash diluted 1:2 with the loading buffer; E- First elution wash diluted 1:2 with the loading buffer. ... 66 Figure 6.13 – Affinity binding of MNP towards all the proteins and IgG (n=2). ... 66 Figure 6.14 - Results of IgG purification using MNP-DX and MNP-DX-22/8 (n=2). ... 67 Figure 6.15 - SDS-PAGE electrophoretic analysis of top and bottom phases collected from the PEG-NaPA 15,000 ATPS with 150 mM of NaCl using MNP-DX and MNP.22/8, the gel was stained by Coomassie staning (left) and silver staining (right). MW - Molecular Weight Marker; L- loading sample diluted 1:2 with the loading buffer; T– Top phase of MATPFS diluted 1:2 with the loading buffer; B – Bottom phase of MATPFS diluted 1:2 with the loading buffer (Subscript DX – system where was used MNP-DX; subscript 22/8 – system where was used MNP-DX-22/8). ... 67
Figure 6.18 - Results of IgG purification using MNP-DX and MNP-DX-22/8 in the PEG-NaPA 15,000 with 150 mM NaCl and assuming the first binding wash as final product (n=2). ... 69
Page | xix
Index of Tables
Table 1.1 – Examples of biopharmaceuticals recovered using an ATPS. ... 9 Table 1.2 - Comparison between some synthesis methods used to obtain MNPs. (Adapted from [42])10 Table 1.3 - Summary of some examples of biomolecules purified from crude extracts with magnetic particles. (Adapted from [47]) . ... 12 Table 3.1 – Different polymer stock solutions prepared for the determination of each phase diagram, with different concentration of salt. ... 21 Table 3.2 - Volumes needed to prepare the polyacrylamide gel for SDS-PAGE. ... 28 Table 6.1 – Results of IgG purification using protein A chromatography ... 63 Table 6.2 – Comparison of the MATFS used in this work with the control methods, Magnetic Fishing and ATPS. ... 69
Page | xxi
List of Abbreviations
Abs – Antibodies
APBA - Aminophenylboronic acid hydrochloride APS - Ammonium persulfate
APTES - (3-aminopropyl)trithoxysilane ATPE - Aqueous two-phase extraction ATPS - Aqueous two phase systems BCA - Bichinchoninic acid
CHO - Chinese hamster ovary CV – Column volume
DLS – Dynamic light scattering DMF - N,N-Dimethylformamide DX – Dextran
Fab - Fragment antigen binding Fc - Fragment crystallizable
FTIR – Fourier-transform infrared spectroscopy GA – Gum arabic
GLYMO - (3-Glycidyloxypropyl)trimethoxysilane Ig – Immunoglobulin
IgG – Immunoglobulin G mAbs – Monoclonal antibodies
MATPFS - Magnetic aqueous two phase fishing MNPs – Magnetic nanoparticles
MNP-DX – MNPs coated with dextran
MNP-DX-22/8 - MNPs coated with dextran and functionalized with ligand 22/8 MNP-GA - MNPs coated with gum arabic
MNP-GA-BA - MNPs coated with gum arabic and functionalized with boronic acid MRI - Magnetic resonance imaging
MW(s) – Molecular weight(s) NaPA - Sodium polyacrylate PEG - Polyethylene glycol
scFv - single chain variable fragment SDS - Sodium dodecyl sulfate
1. Literature Review
Page | 3
1.1 Antibodies
An immune response is a defense mechanism of the body when fighting a pathogenic organism, for example a bacteria. This defense mechanism involves two systems that complement each other, the humoral and the cellular immune system. The humoral immune system is related to the response at foreign macromolecules found in the body fluids, such as foreign proteins and extracellular viruses. While the cellular immune system is responsible for the destruction of infected cells and also some parasites and foreign tissues.
The humoral immune system is responsible for the antibodies (Abs) or immunoglobulins (Ig) production. Ig or Abs are glycoproteins produced by B cells of immune system in the presence of an antigen molecule, with the aim to neutralize it. When the antibody binds to a specific antigen, macrophages take care of recognizing this complex formed to remove it from the host system. In addition to the ability to identify these foreign molecules, the immune system also has T cells that can be cytotoxic, if they lyse foreign or infected cells, or it can be helper, if they regulate the response of B cells and cytotoxic T cells. The cytotoxic T cells and antibodies can only recognize the antigenic determinant or epitope, which is a specific molecular structure within the antigen.
When different B cell lineages synthesize Abs in response to one antigen, these are designated polyclonal. This production occurs because the B cells population can bind different epitopes within the antigen, and therefore the antigen can be highly recognized by different Abs in different and specific regions. When Abs are produced by a B cell lineage and they are homogeneous and recognize just one epitope, they are designated monoclonal antibodies (mAbs) [1].
1.1.1
Structure
The human Abs can be divided in five classes according to their biological properties and tissue location: IgG, IgM, IgA, IgE, and IgD. These are formed by one or more of a characteristic unit, which has a Y form and two antigen-binding sites. Each unit is formed by four polypeptides, two light chains (L) and two heavy chains (H), that are connected with each other through disulfide bridges and noncovalent bonds. The total molecular weight (MW) of this molecule is 150 kDa, wherein a light chain has around of 25 kDa and a heavy chain around 50 kDa. At the end of these chains, there are variable domains, which contain certain regions that contribute to the selectivity and affinity of the antibodies for antigens. However, what determines the class of antibody is the type of H chain that the antibody has [2]. In the presence of a proteinase, the antibody can be divided structurally into two major fragments, Fab (fragment antigen binding) and Fc (fragment crystallizable). For example, the presence of papain, the immunoglobulin is degraded into two Fab fragments and one Fc fragment, whereas the pepsin can produce one fragment with two Fab fragments (Fab2), and Fc fragments (pFc’) (shown in Figure 1.1)
Figure 1.1 – Structure of an IgG antibody and its degradation by proteases like papain and pepsin. An IgG antibody
has two heavy chains (orange) and two light chains (green), each one with constant and variable domains. In the heavy chain, there are three constant domains (CH) and one variable (VH), while in the light chain there is only one constant domain (CL) and one variable (VL). The combination between variable chains of heavy and light chains determine the two antigen-binding sites of the antibody. Adapted from [5], [6].
Due to their biological functions and small sizes, these fragments can be used in certain immunochemical techniques and experimental applications with a smaller price when compared with the intact antibody. The Fc fragment is made of the heavy chain constant region of an antibody, acts as a mediator of cellular effector functions. Although this molecule does not have the capability to bind an antigen, because it does not contain binding sites, it can be injected in a host of another specie to produce Anti-Fc Abs. These Abs are very useful since it can help recognize a molecule of antibody, for example in a Western blotting experiment. Another useful use for these fragments is in control of the Fc-binding to Protein A in experiments such as immunoprecipitation [7].
In contrast, the Fab or the Fab2 fragments have antigen-binding sites. Fab2 fragments have two
antigen-binding Fab portions held together by the hinge region, in which there are disulfide bonds. These fragments have many advantages over an intact antibody, for example allow cheaper antigen-antibody binding studies and because it is easy to them to penetrate tissues sections, they can improve staining in immunohistochemistry (IHC) having lower immunogenicity than an antibody [7].
Others formats derived from antibodies have also been studied, such as the single chain variable fragment (scFv), which consists of the variable domains of the heavy (VH) and light chain (VL) connected by a peptide linker, and camel VH domain (VHH), which is an antigen-binding site formed by variable domains of Camelidae only-heavy-chain antibodies. These formats have routinely been used for antibody phage display, where the expression of a peptide with just an antigen-binding domain is convenient. Moreover, they have had a great impact on the pharmaceutical industry, namely in the development of therapeutic proteins [8].
1. Literature Review
Page | 5
1.1.2
Upstream Processing
The large-scale mAbs production in mammalian cells cultures was caused by their clinical and commercial success alike. The antibody demand led companies to expand the manufacture capacity, to increase the scale of bioreactors and to increase the process efficiency with the concomitant manufacturing cost reduction [9], [10].
The antibodies can be produced by several host systems such as bacteria, plants and even yeast, but the best choice are mammalian cells, since they have the capability to fold, to assembly and to modify the mAbs after translation in the proper way [11].
The Hybridoma technology was the first process introduced for a large-scale antibody production and consists of the fusion ofa myeloma cell line with B cells to form hybridoma cells. These cells have characteristics of both fusion cells, can produce antibodies like a B-cell and have longevity and reproductivity of a myeloma cell. Initially, murine cells were used for this purpose, but in a large-scale antibody production, those cells show high sensitivity to environmental changes, to toxic compounds formed during cell growth and to shear and bubble stress in a bioreactor. In order to fulfil these purposes, genetically engineered cell lines were developed, namely Chinese hamster ovary (CHO) cells, NS0 and Sp2/0-Ag 14 [11], [12]. For a large-scale antibody production, a suitable cell line needs to be scalable; to have a high expression of product during long periods of time; to be genetic stable and maintain high viable cell density; to have the proper post-translational modifications; and to be characterize as safe for human applications. Besides these features, the product application has also an important role to the choice of a suitable cell line [13].
In the large-scale cell culture processes, after choosing a suitable cell line and vial thaw, is essential to make the cell line grow through an inoculum flask increase in size and/or volume. After this inoculum expansion, the cell mass is transferred to a series of seed bioreactors until it reaches a proper mass for production of mAbs. Prior to the purification steps in the downstream process, centrifugation and filtration steps are needed to remove cells and cell debris (Figure 1.2) [14].
Another important factor for the antibody production is the cell culture medium, that provides essential nutrients for example amino acids, fatty acids, sugars, vitamins, cofactors, and carbohydrates in order to maintain the proper chemical environment for the cells [15]. In early days, one of the most important components of mammalian cells culture medium was the fetal bovine serum, which contained attachment factors, micronutrients, growth factors, and protective elements (antitoxins, antioxidants, antiproteases), and others components essential for cell growth [15], [16]. The use of serum at large-scale antibody production had many disadvantages such as the high protein content, which can hinder product purification; high cost, representing 85% of all cost of the medium; lot-to-lot variability and specially increased risk of contamination (e.g viruses and mycoplasma) [16]. Therefore, many industrial companies have now adopted the use of serum-free medium culture, which could have derived-serum components to fulfil the benefic functions of serum but currently are based on chemically defined media with aim to avoid pathogen contaminations that could be resulted by the presence of animal-derived components [17].
Figure 1.2 – Scheme of the mAbs upstream processing. Adapted from [14]
1.1.3
Downstream Processing
To have a final antibody product without the presence of DNA, virus, pyrogens and/or leachates is very important to design an efficient downstream process to obtain a highest purity product with highest yield. Since the downstream step represents between 50-80% of the total product manufacture cost it is also important to purify at minimum costs possible depending on the final application and percentage of purity required [18].
Since all therapeutic biomolecules and production medium thereof are different, there is not a general purification scheme but common phases instead. A normal antibodies purification process is represented in the Figure 1.3 and there are three main steps: 1) Capture or recovery; 2) Intermediate purification; and 3) Polishing [19], [20]. The first step consists of a fast separation between the interest protein and the cells of the bioreactor with the aim to isolate the protein from proteolytic enzymes and others elements such as growth medium factors. It is possible to reach 95% of purity in this step depending on the specificity of the tools that are used, the most common used on antibody purification is Protein A affinity chromatography [20], [21]. After this, the intermediate purification and the polishing stages are responsible to eliminate host cell proteins, DNA, leached protein A, aggregates and viruses from the product. The difference between these two steps is the fact that the goal of intermediate purification is the elimination of bulk contaminants, including host cell proteins and adventitious viruses, and Protein A affinity chromatography leachates whereas the polishing involves the removal of more specific compounds, such as inactive or unwanted isoforms of the product [20]. Although the purity given by the chromatographic steps, FDA requires the use of two steps for viral removal to assure safety of products produced by mammalian cell culture. These two steps are usually a viral inactivation and a viral filtration, after the Protein A chromatography and after the purification and polishing steps, respectively. The viral inactivation consists of a low pH incubation while, in the viral filtration there is elimination of viruses by inactivation and size [22]. To finish the mAbs downstream processing, normally an ultrafiltration/diafiltration (UF/DF) is performed with the aim of reducing storage volumes and producing the drug substance by putting the product into a desire buffer (Figure 1.3) [14].
1. Literature Review
Page | 7
Figure 1.3 – Scheme of mAb purification (UF/DF: ultrafiltration/diafitration). Adapted from [19]
The antibodies upstream processing have been developing new ways to get more product efficiently by developing recombinant technologies, media and strategies to control the process. In 2004, it was normal to obtain antibody concentrations between 3-5 g/L using CHO cells, but, nowadays, companies usually achieve higher concentrations, more than 12 g/L. Moreover, the highest reported IgG production titer was 27 g/L using human embryonic retinal cells [23]. Despite these increased upstream productivity the downstream processing equipment can only work with smaller amounts of antibodies and therefore this manufacturing step can lead to high processing times, to large consumption of material and consequently to high costs [24]. For this main reason there is a great interest on developing alternatives purification technologies that are effective, economical viable and scalable [25]. One of these alternatives is through non-chromatographic approaches such as membrane-based procedures, aqueous two-phase systems (ATPS), precipitation, crystallization or affinity alternatives, for example magnetic particles [26].
1.2 Aqueous Two Phase Systems
1.2.1
Phase Diagram
The aqueous two phase systems (ATPS) is a well established purification process which results through the mixture of two aqueous solutions of hydrophilic polymers, for example polyethylene glycol (PEG) and dextran. This system can also be formed upon mixing one solution of polymer and another of salt such as a potassium phosphate solution [27]. In order to obtain two separated phases in this process the solutions concentration needs to be above a critical concentration, which can be represented by a phase diagram (Figure 1.4).
In the phase diagram, the binodal curve separates one region above the curve, where it is possible to form two immiscible aqueous phases, from another region below the curve, where it is only possible to form homogenous solutions [28]. The line that connects two points in the binodal curve is called tie-line
Figure 1.4 – Example of a binodal curve. In the figure, A, B and C are points of the binodal curve, C is the critical
point, A and B represent respectively the equilibrium composition of the top phase and the bottom phase for all points on the tie-line represented. Adapted from [28].
Many factors influence this binodal curve such as the polymer molecular weight, temperature and concentration of salt in the system. Due to the formation of a hydration shell, an increase of the polymer molecular weight makes it easier to form two phases. As a result, in the phase diagram is possible to observe an increase on the tie-line slope, indicating a higher difference between the polymer concentrations in the two phases [29]. In contrast, the temperature usually has an opposite effect and therefore an increase of this parameter increase the polymers concentration required to obtain two phases [29].
Regarding the effect of salt type and its concentration, it will depend on the ATPS that is being used. When two non-charged polymers form an ATPS, this factor will not have a great effect on the position of the binodal curve as in a two-polymer system where one or both of the polymers are charged [30]. This last type of system is difficult to form without salt addition, since the phase separation only occur at very high polymer concentration (e.g., 10 wt% of each polymer), and with salt addition the phase separation occurs at lower polymer concentrations (e.g., 3–5 wt% of each polymer) [30].
1.2.2
Bioseperation in Aqueous Two Phase Systems
Due to its advantages, ATPS have been studied as a process to recovery and purify many biological products such as proteins, genetic material, cells and organelles. These advantages include its scale-up potential, its use on a continuous operation, the low toxicity of phase forming chemicals when compared with an organic-aqueous system and its biocompatibility [31].
1. Literature Review
Page | 9 from one another. This is achieved by altering several intrinsic factors of the system, for example the average molecular weight of the polymers and its concentration, the type of ions in the system, or by adding an additional salt such as NaCl. [31].
The production and purification of proteins with pharmaceutical applications have always an ever-increasing interest in the industry. Some of these therapeutic products have already been successfully recovered by using an ATPS, in Table 1.1 there are some recent examples of these products.
Table 1.1 – Examples of biopharmaceuticals recovered using an ATPS.
With the aim of increasing the degree of purification, affinity ligands can also been added to the system as free ligand or attached to a polymer or a support, like magnetic particles [27]. As good example of this effect, there is the partition of Human IgG in the PEG/Dextran systems, which partition suffers a shift to the top phase in the presence of diglutaric acid functionalized PEG. Moreover, it was possible to obtain extraction yields over 90% [36].
Although the ATPS can be used as a downstream processing technique, it also gained a great interest as an analytical tool over the last years [37].
1.3 Magnetic Nanoparticles
Nowadays there is a great interest in finding new and innovative solutions either in the biomedical field or in the biotechnological field. The magnetic nanoparticles (MNPs) have been shown excellent platforms in these fields since they have an inherent superparamagnetic/paramagnetic nature and can be modified with biomolecules or ligands [38].
1.3.1
Properties and applications
In general, MNPs are iron oxide particles, which consist of an inorganic core with a protective shell of polymer. This inorganic core is mainly made up of magnetite (Fe3O4) or maghemite (γ – Fe2O3), that
have paramagnetic/superparamagnetic properties. Both of these minerals have a similar structure where the oxygen atoms and the iron atoms are coordinating by an octahedral or tetrahedral structure.
Biopharmaceutical ATPS Recovery Additional information Ref.
Human B19 parvoVLP PEG 400/Phosphate 63.9% Combined with
precipitation [32] Human IgG PEG 3350/Phosphate 76% Optimization using
experimental design
[33]
Pancreatic trypsin PEG 3350/NaCitrate 99.7% [34]
obtain iron oxide particles with different characteristics. Co-precipitation, thermal decomposition, microemulsion and hydrothermal synthesis, which are summarized in Table 1.2 are some of the most common methods used to synthesize MNPs. Moreover, these particles can also be synthesized biologically by a microorganism or bacteria, mainly using Magnetotactic bacteria and iron reducing bacteria [40], [41].
The most commonly synthesis method used is the co-precipitation, which consists of a proper mix of iron salts, namely ferric and ferrous ions in a molar ratio of 1:2 (Equation 1.1), under basic conditions and an inert atmosphere at room temperature or at elevated temperature [41].
Fe2+ + 2Fe3+ + 8OH- Fe3O4 + 4H2O (Eq. 1.1)
Table 1.2 - Comparison between some synthesis methods used to obtain MNPs. (Adapted from [42])
The main challenge of the co-precipitation method is the control of the particle size and the narrow particle size distribution, which can be controlled by adjusting several parameters such as the type of salt used the reaction temperature, the pH value and ionic strength of the media. Even though this difficult control of size, this method can produce great amount of particles [41], [42].
After the synthesis, it is important that MNPs maintain their stability without agglomeration or precipitation. In order to achieve this, a layer can be added, which will act like a protecting shell isolating the core against the environmental threats, such as the oxidation by oxygen, or erosion by acid or base [42]. The MNPs coating can be made by two different types of material: inorganic or organic. One of most inorganic materials used is silica, which can prevent the aggregation of nanoparticles, enhance the nanoparticles chemical stability, and even can provide better protection against toxicity [41]. As
1. Literature Review
Page | 11 This protective shell not only protects the particles against degradation and aggregation, but also helps further functionalization of MNPs with groups such as –NH2 and –COOH which are the via to put specific
compounds on the MNPs surface like enzymes, drugs and chemical ligands [42], [43].
Due to their superparamagnetic properties and depending on the surface components, the MNPs can be applied in different areas. One of those areas is the biomedical area where MNPs are mainly used as magnetic resonance imaging (MRI) contrast agents, as vectors for gene and drug delivery, or as agents for cancer treatment using hyperthermia therapy. Another area is the biotechnological area where the MNPs application goes from bioseparation processes to biocatalysis and bioremediation [44].
1.3.2
Magnetic nanoparticles in Bioseparation
Since the downstream processing is responsible for the majority of the manufacturing costs, an increase of demand for high quality therapeutic proteins at low cost led to the discovery of new and different types of separation techniques.
Nowadays one of the most purification method used is the affinity chromatography, which is a type of liquid chromatography that is based on the selective and reversible binding between a molecule and a ligand and is present in many biological systems, for example the binding of an antibody with an antigen [45]. However, this method has some limitations that must be overcome, such as the limitations by pore diffusion and the column clogging that can be provoked by feed streams containing cells and other colloidal debris [46].
MNP-based separations have appeared as one of the most interesting separation technologies studied since these particles can be used in crude samples with suspended solid material [47]. Moreover, this type of technology present many others advantages such as low-cost, speed, scalability, and can be easily functionalized with affinity ligands towards a specific target [48].
In the literature, there are already many purified biomolecules using magnetic particles, and some of those have biopharmaceutical interest such as influenza virus particles and antibodies. Some of these biomolecules are summarized in the Table 1.3.
particles Cellulose from MDCK cells His-tagged β- glucosidase poly (N, N’- methylenebisacrylamide-co-glycidyl methacrylate) Iminodiacetic
acid and Ni2+ Crude E.coli lysate [51]
Human IgG Dextran 22/8 CHO cell culture
supernatant [52]
Magnetic particles can also be applied as the affinity support in other purification techniques such as aqueous two-phase system, which due to their magnetic and affinity properties allow an easier recovery of a certain protein from the crude extract [47].
2. Background and Aim work
Page | 15 There is a great interest on developing alternative separation technologies for the purification of human antibodies, and non-chromatographic approaches are appearing as sustainable and profitable solutions. Among these, aqueous two-phase extraction (ATPE) and magnetic fishing are interesting alternatives to conventional chromatographic techniques [26].
The Biomolecular Engineering Group at UCIBIO, REQUIMTE (FCT/UNL) in collaboration with the Institute for Biotechnology and Bioengineering at Instituto Superior Técnico of Lisbon, developed a hybrid process, which combines aqueous two-phase extraction and magnetic fishing for antibody purification. In this developed process, magnetic particles coated with gum arabic and boronic acid were added to a PEG/Dextran ATPSs, obtaining as result a high recovery of IgG with high purity from a crude extract [53]. Despite the success of the method, some issues needed further improvements, such as the use of economically viable alternative solutions for the ATPS polymers, and a better control of the MNPs partitioning in the ATPS to facilitate recovery and increase yield.
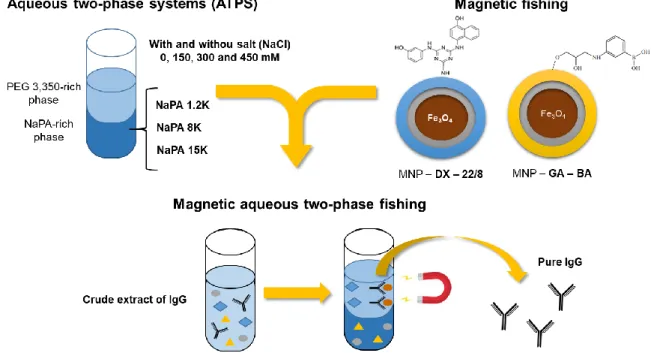
In this work, a new magnetic aqueous two-phase fishing technique to purify IgG was developed, by studying a new set of polymers in the presence of different NaCl concentrations in the system, namely 0, 150, 300 and 450 mM. Instead of using the highly expensive dextran, sodium polyacrylate (NaPA) 1,200, 8,000 and 15,000 Da was investigated as a cheaper alternative. Furthermore, magnetic particles previously used by Dr. Vijaykumar Dhadge, namely MNPs coated with dextran and 22/8 ligand, and MNPs coated with gum arabic and boronic acid were also studied to be applied in these new systems. The research strategy is represented in Figure 2.1. The main goal of this work was to develop a sustainable and profitable solution to protein A chromatography, which is responsible for the majority of the purification costs during IgG manufacturing. Furthermore, at large scale application, the PEG/Dextran ATPS is too expensive mainly due to the high cost of dextran, and NaPA appears as economic solution to this problem.
3. Materials and Methods
Page | 19
3.1 Materials
3.1.1
Chemicals
The ATPS were made using poly(ethylene glycol) average MW 3,350 (202444), poly(acrylic acid sodium salt) average MW 1,200, 45 wt % (416010), poly(acrylic acid sodium salt) average MW 8,000, 45 wt % (416029) and poly(acrylic acid sodium salt) average MW 15,000, 35 wt % (416037) from Sigma-Aldrich. For the MNP synthesis was used iron (II) chloride tetrahydrate (44939) and iron (III) chloride hexahydrate (31232) from Sigma-Aldrich and ammonium hydroxide solution 25% (986030501) from Fluka. The MNP surface was modified using Sodium metasilicate pentahydrate (71746), Tetraethyl orthosilicate (TEOS) (131903) from Sigma-Aldrich, ethanol absolute (1210851212) from Panreac, dextran from Leuconostoc spp (40000g/mol; 68084) and Gum arabic from acacia tree (G9752) from Sigma-Aldrich. Then for the 22/8 ligand and boronic acid addition was used (3-aminopropyl)trithoxysilane (APTES) (44014-0), 3-aminophenol (100242), 4-amino-1-naphtol hydrochloride (133485), (3-Glycidyloxypropyl)trimethoxysilane (GLYMO) (440167), 3-aminophenylboronic acid hydrochloride (APBA) (410705) from Sigma-Aldrich, acid acetic (XXXXX), N,N-Dimethylformamide (DMF) (23470.293) from VWR and sodium hydroxide from Panreac AppliChem.
The protein recovery studies were performed with using polyclonal human immunoglobulin G (IgG) from Octapharma, which it is known as Gammanorm at a concentration of 165 g/L, and bovine serum albumin (A7906) from Sigma-Aldrich. For protein quantification, it was used either the Bichinchoninic Acid (BCA) kit from Sigma or the protein absorbance at 280 nm.
The IgG crude extract was provided by StabVida and it was produced by myeloma cells, namely Sp2/0 cells. Then, the total protein content was quantified with the Bichinchoninic Acid (BCA) kit from Sigma. The SDS-PAGE gels were made with 30% acrylamide/Bis Solution 37.5:1 (161-0158) and 10% sodium dodecyl sulfate (SDS) solution (161-0416) from Bio-Rad, and ammonium persulfate (APS) (9592.2) and N,N,N,N – tetramethylethylenediamine (TEMED) (2367.3) from Roth. Moreover, for the loading buffer in the samples preparation, glycerol (G9012) and β-Mercaptoethanol (M6250) from Sigma-Aldrich, bromphenol blue sodium salt (A5212.1) from Roth were used. Either in the gels preparation or samples preparation was used Tris base solutions, which were made with Tris base ultra-pure for molecular biology (MB01601) from NZYTech.
Silver staining of polyacrylamide gels was performed with a Silver Stain Plus Kit (161-0449) from Bio-Rad was used, which includes fixative enhancer concentrate 0461), silver complex solution (161-0462), reduction moderator solution (161-0463), image development reagent (161-0464) and development accelerator reagent (161-0448). Furthermore, Methanol ≥ 99 % (8388.5) from Roth and acetic acid glacial (CAS 64-19-7) from Pronalab were also used.
The hydrodynamic diameters of MNPs samples with dextran and 22/8 ligand were measured in a Dynamic Light Scattering Zetasizer Nano ZS from Malvern (iBB-IST). For the MNPs samples with gum arabic and boronic acid, the hydrodynamic diameters and zeta potential values were measured with SZ-100 Nanoparticle Analyzer from Horiba (FCT-UNL), and the zeta potential results were acquired also in this equipment.
The Fourier transform infrared (FTIR) spectra for the MNPs samples were acquired on Spectrum Two IR Spectrometer from PerkinElmer.
The incubations for the binding assays and the extract purification were performed in a Bibby Scientific Stuart Rotator Disk.
The BCA reactions were performed in the hybridization oven Boekel Big Shot IIITM from Bockel Scientific. Moreover, all the spectrophotometric measurements, 280 nm and BCA assays, were obtained by using the Microplate Reader – Tecan Infinite F200 from Tecan.
The IgG content in the crude extract was obtained by using a 1 mL HiTrap MabSelect SuRe column in an ÄKTA pure system from GE Healthcare Life Sciences, and the protein was quantified by microBCA. The Mini-Protean Tetra System from Bio-Rad was used for the electrophoresis SDS-PAGE gels. In addition, the gels photographs were taken with a Gel Doc XR+ System from Bio-Rad.
3. Materials and Methods
Page | 21
3.2 Methods
3.2.1 Aqueous two phase systems
3.2.1.1 Characterization – Determination of phase diagrams
The aqueous two phase systems studied were composed by PEG 3,350 and NaPA with different molecular weights (1,200, 8,000 and 15,000) in the presence and absence of NaCl (0, 150, 300 and 450 mM). The binodal curves of these systems were determined by using the turbidometric titration method at 25 ºC (± 1 ºC) and atmospheric pressure [54]. This titration is divided in two methods, direct and indirect, that only differentiate in order at which the polymers are added.
A variety of polymer stock solutions were prepared with different polymers and concentration of salt, as represented in the Table 3.1. In the direct method, 1 g of the stock of PEG was weighted in a glass beaker and a stock solution of NaPA was added dropwise with shaking until a turbid mixture appeared and the final weight was measured. MilliQ water was added dropwise with shaking until the mixture became clear and the final weight was also determined. For the systems with salt, the water added had the same concentration of salt as the polymers in study. This procedure was repeated until the mixture would not become turbid anymore and the polymer concentrations at the binodal curve were calculated using all the weights measured. Since this method can only obtain one part of the binodal curve, an indirect method was applied. This method is the opposite of the direct method and therefore a stock solution of PEG was added dropwise to a stock solution of NaPA, which was weighted previously.
Table 3.1 – Different polymer stock solutions prepared for the determination of each phase diagram, with different
concentration of salt.
Solution Polymers Concentration % w/w [NaCl] (mM)
1 PEG 3,350 40%
0, 150, 300 and 450
2 NaPA 1,200 45%
3 NaPA 8,000 45%
4 NaPA 15,000 35%
The binodal curve was adjusted to the Merchuk equation, represented in equation 3.1, using the add-in Solver of the Excel program:
[PEG] = Ae
[(B[NaPA]0,5)−(C[NaPA]3)](3.1)
[PEG] and [NaPA] represent the mass percentage of polymers, and A, B and C are constants obtained by fitting the binodal curve.of 10% w/w), 300 µL of protein solution at 1 mg/mL (final concentration of 0.02% w/w), MilliQ water and salt if it was necessary. Then the systems were well mixed in a vortex mixer for 15 minutes and the phase separation occurred at room temperature. After forming two phases, the phase volumes were measured and the bottom and top phase were analyzed for protein quantification by using the absorbance at 280 nm.
The calibration samples for this section were prepared by mixing an equal portion of calibration sample of protein and one of the phases, which was collected by making a 20 g system without protein. The calibration samples of protein had a concentration range of 0-0.4 mg/mL.
The partition coefficients (K) of these proteins were calculated based on equation 3.2:
K =
[Protein]PEG[Protein]NaPA
(3.2)
Where [Protein]PEG and [Protein]NaPA represent the total concentration of a protein in the PEG rich and
NaPA rich phase, respectively.
3.2.2 Magnetic particles
3.2.2.1 Synthesis of MNPs
The bare MNP were synthesized by the chemical co-precipitation method, which is based on the mixture of two different solutions of iron salts. In this protocol, 24.33g of FeCl3.H2Oare dissolved in 400 mL of
water and 10.8 g of FeCl2.4H2O are dissolved in 45 mL. After mixing these solutions in a reactor, a
mechanical stirrer was used for a short period of time to homogenize the mixture. Then a solution of 75 mL of 25% NH4OH was added quickly to the reactor and was left reacting for 5 minutes after which the
mechanical stirring was stopped. Finally, the particles synthesized were transferred to a proper flask and washed with water by magnetic decantation. The volume of water used in each wash was approximately twice the volume of particles in the flask and these washes were stopped until the supernatant had a neutral pH.
To synthesize silica coated-magnetic particles, a solution of sodium metasilicate pentahydrate was initially prepared, which needs to dissolve overnight, under magnetic stirring and heat was prepared. For 2 g of particles, 2.4 g of silicate were diluted in 84.2 mL 50% (v/v) ethanol/H2O. Then the particles
were resuspended in a certain volume of water to obtain a concentration of 10 mg/mL and were sonicated during 15 minutes. After this, the coating solution was added dropwise to the particles solution
3. Materials and Methods
Page | 23 with sonication and was allowed to react during 2 hours in a water bath at 40ºC under mechanical stirring. The MNPs were then washed with 50 % (v/v) ethanol/ H2O (3x) and distilled water (3x).
For the second silica coating with TEOS, the MNPs were resuspended in 80 mL of 80% (v) ethanol/H2O
to obtain a concentration of 25 mg/mL. This solution was sonicated for 10 minutes and afterwards 3.16 mL of 5 M NH4OH solution was added. After that, 1.58 mL of TEOS was added dropwise to the solution
under sonicating and after was placed in a water bath at 40°C for 2h under mechanical stirring. Finally, the particles were washed by magnetic decantation with 80% ethanol/water (3x) and afterwards with distilled water (3x).
For the last coating with polymer, 2 g of particles were initially resuspended in 175 mL of distilled water and were sonicated for 10 min. A solution of polymer was prepared (2 g of Dextran/Gum arabic in 25 mL of water) and was added dropwise to the particle solution. After this, the solution was placed in a water bath at 60°C for 2h under mechanical stirring, and the particles were washed with distilled water (5x).
3.2.2.2 MNP with Dextran Amination of MNPs
To aminate the MNPs with Dextran (MNP-DX), 2 g of particles were resuspended in 179 mL 50% ethanol/ H2O. After sonicating during 5 minutes, 1 mL of acetic acid and 20 mL of APTES (15% V/V)
was added to the solution, obtaining a MNPs concentration of 10 mg/mL. The mixture was incubated at 70°C during 1 hour with orbital shaking and subsequently the particles was washed with water.
22/8 ligand synthesis
For the first substitution, the aminated particles were first washed with cold water (2x), then washed with cold 50% acetone/water (2x), and after resuspended in 50% acetone/water, to a final concentration of 5 mg/mL. To this magnetic slurry, a solution of cyanuric chloride (0.116 g/mL) was added, which was dissolved in cold acetone and had 5 excess molar of cyanuric chloride in relation to the amines content. The mixture was incubated at 0°C with orbital shaking (200 rpm) for an hour and a half, and subsequently the particle slurry was washed with acetone (2x), 50% acetone/water (3x) and water (5x).
For the second substitution, the supernatant was removed and a solution of 3-hydroxyalinine in 50% DMF/water was added, in order to obtain a final particle concentration of 5 mg/mL. Afterwards the solution was placed in an orbital shaker at 30°C and 200 rpm during 24 hours. The particles were then washed with water (5x).
To finish the ligand synthesis, the supernatant was again removed and was added a solution of 4-amino-1-naphtol hydrochloride in 50% DMF/water. Since this amine is protected with hydrochloride was necessary to add sodium hydroxide in the correct amount. After the reaction for 48 hours at 80°C and 200 rpm, the particles were washed with 50% DMF/water (3x) and with water (5x).
(5x).
3.2.2.4 Affinity Assays towards BSA and IgG
The MNPs were washed with regeneration buffer (0.1M NaOH in 30% (v/v) isopropanol) and then with deionized water to neutralize the pH. After this procedure was repeated two times, the MNPs were equilibrated in binding buffer (50 mM phosphate, pH 8 for MNPs-DX and 22/8 ligand; and 20 mM HEPES, pH 8.5 for the MNP-GA and boronic acid) to a final concentration of 10 mg/mL. Samples with 5 mg of MNPs were prepared and the supernatants were removed. Afterward, 500 µL of IgG or BSA solution in binding buffer (1 mg/mL) were added and the samples were incubated for 30 minutes at room temperature in rotator disk under constant stirring. After incubation the particles were washed five times with binding buffer and elution buffer (50 mM Glycine – NaOH, pH 11 for MNP-DX and 22/8 ligand; and 1 M Tris-HCl Buffer, pH=8,5 for MNP-GA and boronic acid). Each wash was collected and quantified by the BCA assay in the case of MNP-DX-22/8 and by 280 nm in the case of MNP-GA-BA. In this section, the particles with just biopolymer (MNP-DX and MNP-GA) served as a control.
The protein binding (mg of protein/ g of support) of these MNPs was calculated with equation 3.3:
Protein binding =
m(protein bound)m(MNPs)
(3.3)
Where m(protein bound) is the mass of protein that remained bound to the particles after washes and m(MNPs) represents mass of MNPs used in the assay, in this case was 5 mg of particles.
The percentage values of binding, elution and recovery from these assays were calculated using equation 3.4, 3.5 and 3.6, respectively:
Binding (%) =
m(protein bound)m(protein)
× 100% (3.4)
Elution (%) =
m(protein eluted)m(protein bound)
× 100% (3.5)
Recovery (%) =
m(protein eluted)3. Materials and Methods
Page | 25
3.2.3
Protein A affinity chromatography
Before operation, the ÄKTA system was completely cleaned with degassed MilliQ water and the buffers were put in the correct lines according to the method (A1: binding buffer; B1: elution buffer). The binding buffer used was 20 mM sodium phosphate, 150 mM NaCl, pH 7.2 and the elution buffer was 100 mM sodium citrate, pH 3.0-3.6. After this, the system was purged with all the solutions and conditioned with binding buffer. The 1 mL HiTrap MabSelect SuRe column was placed and conditioned with binding buffer. At this point, the sample of crude extract of IgG was loaded in the sample loop (5 mL). Subsequently, the method was run, which consisted of an equilibration with 5 columns volumes (CVs) of binding buffer, sample load of 10 mL, binding washes with 5 CVs of binding buffer, elution with 5 CVs of elution buffer and, finally, 10 CVs washes of binding buffer. After the chromatographic run, the column was cleaned with a cleaning in place (CIP) solution (250 mM NaOH) with 5 CVs and then was cleaned with MilliQ water until pH 7 was reached. Either the column or the ÄKTA system were left in 20% of ethanol. The column was stored at 4ºC. The samples with the higher values of UV absorbance were collected and analyzed by BCA and by SDS polyacrylamide gel electrophoresis.
3.2.4
Magnetic Aqueous Two Phase Fishing
3.2.4.1 BSA and IgG recovery
These studies were performed with systems similar to the ones in the section 3.2.1.2, but with the addition of an appropriate volume of MNPs. The MNPs concentration used in this studies was 0.02% w/w, (300 µg of MNPs in a final system weight of 1.5 g) and the protein concentration was also 0.02% w/w (300 µL of 1 mg/mL IgG/BSA solution in a final system weight of 1.5 g).. After system mixing and phase separation, the microtubes were put against a magnet and the MNPs were collected along with the top phase. Then the MNPs were washed with binding buffer (x5) and elution buffer (x4) . The binding and elution buffers were the same used in the MNPs affinity assays. The bottom phase of each system was collected from the bottom of the microtubes with the help of a syringe. All the samples collected were analyzed for protein quantification by using the absorbance at 280 nm.
3.2.4.2 Cell culture supernatant purification
The best system to recover IgG determined in the previous sub-section was used was to purify IgG from a crude extract. The procedure was similar to the one described previously but instead of using a pure protein solution, a crude extract solution was used. The final concentration of total protein and MNPs in the system was the same as the previous systems (0.02% w/w). Samples collected were analyzed for protein concentration using the BCA method. To avoid interference from the polymers, an ultrafiltration was performed using Amicon ultra filters with a MWCO of 30 kDa. Moreover, control studies using separately each unit operation, ATPS or magnetic fishing, were also done by replacing the MNPs for water and the polymers for binding buffer, respectively. The yield and purity of the samples were calculated with equations 3.7 and 3.8 using the BCA method and a SDS-PAGE analysis:
into the system; the m(protein)R is the mass of a specific protein recovered from the crude extract and
the m(total proteins) represents the total protein content in a purified sample. The m(protein) and the m(protein)R extrapolated from the protein bands of SDS-PAGE by densitometry analysis using ImageJ.
3.2.5
Analytical Methods
3.2.5.1 Quantification of amines by Kaiser Test
The Kaiser test is a colorimetric test based on the reaction of ninhydrin with primary amines. In the beginning of each test realized, a 0.01 M glycine stock solution was prepared, to obtain calibration curves in range of 0-5 μmol NH2/mL. 1mL solutions of aminated particles with different MNPs
concentrations were prepared (10 mg/mL, 5mg/mL and 1 mg/mL). For each sample tube 50 μL phenol 80% (v/v) in ethanol, 50 μL 2% 0,001 M KCN in pyridine and 50 μL 5% (v/v) ninhydrin in ethanol were added. Samples were then incubated at 100°C for 5 minutes, and the MNPs samples were centrifuged to recover the supernatant. The amination content was obtained by measuring the absorbance at 560 nm and in this work, this content ranged from 83 μmol NH2/g support to 103 μmol NH2/g support
depending on the MNP concentration used.
3.2.5.2 Characterization of MNPs Concentration determination
The concentration of each magnetic particles solution was calculated using dry-weight measurement. This method consist in pippeting 200 μL of solution to a microtube, which was previously weighted, and let it dry overnight. On the next day, the MNP dried mass was weighted and the concentration was calculated by mass difference.
Fourier transform infrared spectroscopy (FTIR)
Fourier transform infrared (FTIR) spectra were acquired using Spectrum Two IR Spectrometer from PerkinElmer. The samples measured were prepared by mixing dry particles and KBr in a concentration of 1% (weight of particles/total weight).
Hydrodynamic Diameter

![Figure 1.2 – Scheme of the mAbs upstream processing. Adapted from [14]](https://thumb-eu.123doks.com/thumbv2/123dok_br/15133755.1011124/32.892.107.782.104.277/figure-scheme-mabs-upstream-processing-adapted.webp)

![Table 1.2 - Comparison between some synthesis methods used to obtain MNPs. (Adapted from [42])](https://thumb-eu.123doks.com/thumbv2/123dok_br/15133755.1011124/36.892.104.793.588.799/table-comparison-synthesis-methods-used-obtain-mnps-adapted.webp)