, c-.
Drs. Roland0 Armiio,’ Aida Pizzi,2 and Her&n Lobos ’
Now many typhoid fever patients who have been treated with chloramphenicol during the acute phase of their illness remain carriers of Salmonella typhi after their release? A study in Chile identified 7.4 per cent of such cases and made it possible to suggest factors of possible etiological significance.
4
Introduction
William Budd (1)) anticipating the dis- covery of the typhoid bacillus by 24 years, probably intuited the existence of carriers when he said that “the first case may be foreign or may be due to the local poison that arises, like a fire from its ashes, as a sleeping legacy from a similar previous out- break.” At the end of the nineteenth cen- tury, Koch demonstrated clearly the role of the human being as a reservoir. Petruscky and Cushing (1898) were the first to com- municate the finding of typhoid bacilli in the excreta of cured cases up to five years after the acute episode. Anton and Ftitterer
(1888) and Chiari, Dupre, and Chantemasse (1891) made classic studies describing the carrier.
Ever since Drigalsky and Conradi (1904, 1907) (2)) many bacteriological and epi- demiological researchers have suggested that carriers, by causing localized outbreaks, must play a very important role in keeping the disease endemic.
The proportion of clinically cured patients who remain carriers has varied according to place, treatment method used, length of observation, criteria used for definition, and other factors. The findings prior to the ad-
‘Published in Spanish in Boletirr de la Ojicina Sani- turia Panamericana, Vol. LXII, No. 4 (April 1967), pp. 295302.
z Professor of Epidemiology, School of Public Health, University of Chile, Santiago, Chile.
a Laboratory Department, Bacteriological Institute of Chile, Santiago, Chile.
vent of chloramphenicol are summarized in Table 1.
Little is known about what has happened to the carrier rate since the introduction of chloramphenicol. KraljeviE, Perroni, and their collaborators indicate that 5.9 per cent of patients are still excreting bacilli at the time of their release (3).
In Chile typhoid fever is one of the major public health problems. About 5,000 cases are reported annually. What is more, mor- bidity rates have tended to remain practically constant in recent decades despite a marked decline in case fatality (Figure 1) and con- sequently in the death rate, a decline that suggests the clinical impact of chlorampheni- col. As a result of the high morbidity rate, KraljeviE presents probably the largest num- ber of cases treated with chloramphenicol in the world-more than 15,000.
Vildosola (4) observed the regularity with which cases occurred in limited geographic areas that he called “historical foci,” which in his view suggested the existence of chronic carriers there. Romero (.5), Moroder and Lopez (6), and GarcCs and Prado (7) ac- cumulated observations that back up this notion. Borgofio and Latorre (8) estimated the number of carriers in Santiago around
1953 at 70,000.
These facts led the authors to ask them- selves some fundamental questions: What is the part played by carriers in spreading typhoid fever in an endemic area? What
c
3
Armijo et al. . TYPHOID CARRIERS AFTER CHLORAMPHENICOL TREATMENT 61
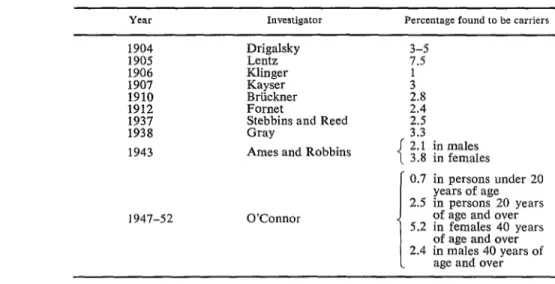
TABLE l-Frequency of Typhoid Carriers Found among Clinically Cured Cases, before the Advent of Chloromphenicol, 1904-1952.
Investigator Percentage found to be carriers
1904 1905 1906 1907 1910 1912 1937 1938 1943
Drigalsky Lentz Klinger Kayser Briickner Fornet
Stebbins and Reed Gray
Ames and Robbins
3-j 7.5 1
;* 214 2.5 3.3
!
2.1 in males 3.8 in females
0.7 in persons under 20 years of age 2.5 in persons 20 years 1947-52 O’Connor of age and eve;
5.2 in females 40 vears of age and eve; 2.4 in males 40 years of
age and over
is the rate of carriers remaining after treat- ment with chloramphenicol? The present paper reports on the results of their work. Their objectives were as follows:
1. To determine the proportion of ty- phoid cases treated with cldoramphenicol that become chronic carriers.
2. To study possible associations between the condition of carrier and certain variables
FIGURE l-Trends in Typhoid Fever Rates in Chile (Morbidity, Case Fotalify, Mortality), 1945-1964 (Rote per 100,000).
100
50
1 -
MOR9lOlTY
lIr',,""',',,,",,,,l
1945 1950 1955 1960 1965
YEAR
in the acute phase, such as age, period be- tween first symptoms and the beginning of treatment, relapses, and biliary disorders.
3. To measure the impact of the carrier on the family group.
Material and Methods
To carry out these objectives, it was de- cided to study women only, for the follow- ing reasons:
1. According to classic studies-Ames and Robbins, Tynes and Utz, O’Connor- a larger proportion of carriers is to be ex- pected among females.
2. Women are more important epidemio- logically in Chile, because they are all po- tential food handlers.
3. The country’s cultural patterns made it more likely that women would be in when a home visit was paid.
4. Generally speaking, previous experi- ence had shown women to be more coopera- tive.
Only those who were still excreting Sal-
monella typhi in the feces at least a year after an acute episode were considered chronic carriers.
July 1960 and 30 June 1964 were examined. During that period about 2,400 women were hospitalized. To ensure that the sample was accurate diagnostically, the choice of cases was based on certain bacteriological criteria. It was decided, in agreement with the profes- sors of bacteriology and infectious diseases, Drs. Eduardo Dussert and Roque KraljeviE, respectively, that an unequivocal case of ty- phoid fever would be one that was confirmed bacteriologically through blood culture, fecal culture, or both, besides having a clinical picture compatible with that diagnosis.
There were 763 patients who met these conditions. In the field work stage, 460 of
these were located through home visits. Their diagnosis was confirmed as follows: blood culture, 283; fecal culture, 103; both, 74.
A significant number of cases were ex- cluded because the patients’ homes were outside the urban area of Santiago. Others could not be found because the addresses on their clinical records were incorrect or be- cause the buildings had been demolished and it was impossible to learn where their inhabi- tants had gone. Also excluded were another 50 cases that for one reason or another had not received chloramphenicol. Some had gone to other provinces or had left the coun-
try; a few had died of other causes. The 460 cases studied were considered represen- tative of the original 2,400, since exclusion was governed by chance. They came from socioeconomic strata and geographic areas representative of the total hospital clientele. They were also similar in age distribution.
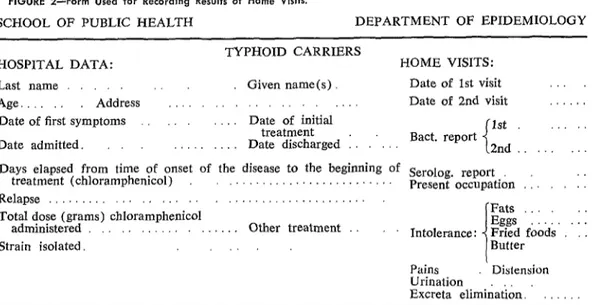
A simple form (Figure 2) was drawn up for ag in all the data of concern in the study.
Each case was visited at home by a physi- cian, who informed her about typhoid fever and obtained her cooperation in furnishing two samples for fecal culture after the admin- istration of a cholagogue (in this case Dauro- pal), which was given in two doses of two capsules each. Those under 12 years of age were given two doses of one capsule each. The samples were furnished a week apart, in some cases oftener, or even as far apart as two weeks, depending on the individual circumstances. Over a period of two years more than 3,000 home visits were made, to locate cases, question index cases, and collect samples. From samples taken from the in- dex cases and contacts, about 2,000 fecal cultures were made by the Laboratory De- partment of the Bacteriological Institute.
In the case of the family contacts of the
FIGURE 2-Form Used for Recording Results of Home Visits.
SCHOOL OF PUBLIC HEALTH DEPARTMENT OF EPIDEMIOLOGY
TYPHOID CARRIERS
HOSPITAL DATA: HOME VISITS:
Last name Given name(s). Date of 1st visit
Age. Address , Date of 2nd visit .
Date of first symptoms Date of initial
treatment 1st
Date admitted. . Date discharged : Bact. report 2nd
Days elapsed from time of onset of the disease to the beginning of Serolog. report
treatment (chloramphenicol) . . Present occupation .: 1: Relapse .,... . _. . . . _...
Total dose (grams) chloramphenicol
.-I Fats
administered . . Other treatment Intolerance. Eggs Fried foods : : .
Strain isolated. ,_.. Butter
Pains
Urination Distension Excreta elimidat&.
t
4
*-r
4
A
+ i
Armijo et al. . TYPHOID CARRIERS AFTER CHLORAMPHENICOL TREATMENT 63
TABLE Z-Age Distribution of S. typhi Carriers, Santiago, Chile, 1960-1964.
Age (years)
Carriers CXlierS
among
Number Per cent contacts
Under 15 173 4 6
15 to 24 188
362 :;
2
25 to 34 17:9 1
35 and over 8 25.0 1
Total 460 34 7.4 8
index cases two fecal cultures were studied in order to compare typhoid incidence in the group exposed to a proved carrier with that among a control group in which carriers were not identified.
The strains of Salmonella typhi thus iso- lated were studied bacteriologically for typ- ing, determination of sensitivity to anti- biotics, and so on.
Results
Prevalence. In the 460 cases investigated, 34 carriers (7.4 per cent) were discovered. According to British studies, it is possible with two fecal cultures to discover up to 72 per cent of the carriers in a given study group; it might therefore be assumed that the proportion found in the present study is considerably lower than the real one that serial fecal cultures might have discovered. In any case, the number found exceeds the classic figures of 3 to 5 per cent.
Age. Table 2 shows the distribution of the carriers by age. It suggests the existence of factors that cause the proportion of carriers to increase with age, particularly after 25. It should be noted that, besides the 34 carriers discovered among the 460 index cases, 8 more were found in families, so that the total number identified comes to 42.
Duration of carrier state. As Table 3 shows, at the time of this report the minimum period recorded for the carrier state was two years; the average period was 3.7 years.
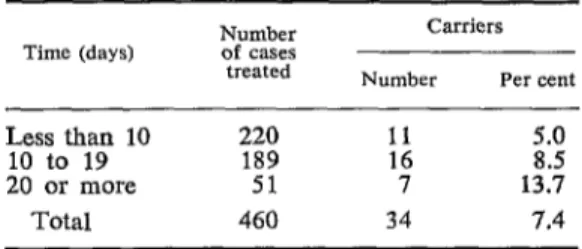
Relationship to time elapsed before treat- ment. The longer the period between the first symptoms and the start of chloramphenicol
TABLE 3-Duration of Carrier State, Santiago, Chile,
1960-I 964.
Time
(years)
Carriers Number of
index cases
Number Per cent
1 - - -
ii zi
5
110
128 1: ::2
113
107 1: 1%
6 2 2 100.0
Total 460 34 7.4
treatment, the larger the proportion of carriers (Table 4).
Relationship to seriousness of case. In an attempt to study the possible relationship between the seriousness of the clinical pic- ture and the condition of carrier, the length of stay in the hospital was taken as an index of seriousness. Where there had been a relapse, only the first hospitalization was counted. As may be seen in Table 5, the proportion of carriers was higher among those who had been hospitalized 20 days or more than among those who had been hospitalized for a shorter period.
TABLE 4-Proportion of Carriers, according to Time Elapsed between Appearance of First Symptoms and Treatment with Chloramphenicol, Santiago, Chile, 1960-
1964.
Time (days)
Carriers Number Per cent
Less than 10 220 11 5.0 10 to 19 189 16 8.5 20 or more 51 7 13.7
TABLE +-Proportion of Carriers, according to length of Stay in Hospital, Santiago, Chile, 1960-1964.
Pe+op o$
hosp($a;;sTtion index cases Number of
Carriers Number Per cent
Less than 20 400 27 6.8 20 or more 60 7 11.7
Total 460 34 7.4
Relationship to relapse. Of the 460 cases studied, relapses had occurred in 85. It is notable that there were four times as many carriers among these cases as in the 375 in which no relapse occurred (Table 6).
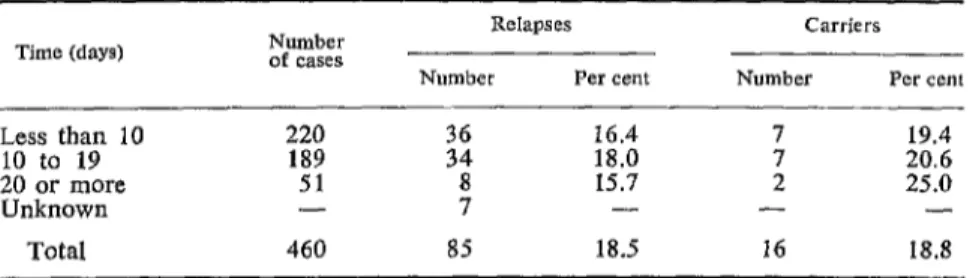
Relapse and time elapsed before treat- ment. Altogether, a relapse rate of 18.5 per cent was observed (Table 7), but no clear relationship could be discerned between the relapse state and the period of time between first symptoms and treatment. With respect to the proportion of carriers among relapsed cases, the figure again increased as the time between the first symptoms and the beginning of treatment increased.
Relationship to biliary disorders. In view of the difficulty in assessing liver symptoms in the absence of exhaustive examinations, a
TABLE 6-Relationship between Relapse and the Carrier State, Santiago, Chile, 1960-1964.
Relapse
Carriers Number Per cent
Occurred 3;: 16 18.8
Did not occur 18 4.8
Total 460 34 7.4
simple history was taken to establish a very elementary scale of symptoms:
Slight or doubtful disorders: intolerance for certain greasy foods.
Moderate disorders: accentuated or char- acteristic biliary dyspepsia.
Serious disorders: presence of hepatic colic; definite diagnosis, including a history of cholecystectomy (four cases).
It is striking that, when this scale was used on the 460 cases, the proportion of car- riers among cases with such disorders was twice as high (8 per cent) as in the 158 cases without them (Table 8) ; it is also note- worthy that there is no significant difference between an absence of such disorders and slight ones, but that as the intensity increases the number of carriers increases accordingly. In the 184 cases with serious disorders the proportion of carriers was three times as high as among healthy women.
This finding leads to conjecture about the possible etiologic association between ty- phoid fever and cholecystitis. It might well be asked whether typhoid antecedents should not be investigated and fecal cultures made in all cases of cholecystitis. It may also be wondered whether the association of cho- lecystitis and typhoid antecedents should not be considered a surgical indication for cholecystectomy.
Impact on the family group. To measure the impact of the carrier on the family group, the typhoid history subsequent to the episode of the index case in the family was investi- gated in 4,164 contacts, of whom 228 had been exposed to a proven carrier. The re-
TABLE 7-Relapse and Time Elapsed between Appearance of First Symptoms and Treatment, as Related to the Number of Carriers, Santiago, Chile, 1960-1964.
Relapses Number Per cent
Carriers Number Per cent
Less than 10 220 :2 16.4 7 19.4
10 to 19 189 18.0 20.6
20 or more 51 15.7 I 25.0
Unknown - ; - - -
Armijo et al. - TYPHOID CARRIERS AFTER CHLORAMPHENICOL TREATMENT 65
Y
111
L A
TABLE 8-Relationship between Vesicular Disorders and Carrier State, Santiago, Chile, 1960-l 964.
Vesicular disorders
Number of cases investigated
Carriers
Number Per cent
Absent Slight Moderate Intense
Total
158
f? 2.;
:: 9:3
184 2; 12.0
460 34 7.4
maining 3,936 contacts served as a control
group. As is immediately apparent from Table 9, the prevalence of typhoid fever was almost five times as high in those exposed to a carrier as in those in which no carrier was
identified.
TABLE 9-Typhoid in Family Groups Subsequent to the Occurrence of the Index Case, Santiago, Chile, 1960-1964.
Family group
Typhoid cases Number of
contacts
Number Per cent
With proven carriers Without proven
carriers Total
228 30 13.1
3,936 113 2.9 4,164 143 3.4
Summary
A study of 460 female patients who had been diagnosed as typhoid fever cases and dismissed from the Hospital for Infectious Diseases in Santiago, Chile, during the period 1960-1964 was made for the purpose of determining the rate of Salmonella typhi carriers among them. All of the patients had been treated with chloramphenicol during the acute stage of the disease.
Over a two-year period more than 3,000 home visits and nearly 2,000 fecal cultures were made to detect carriers among both the index cases and their suspect contacts. Thirty-four carriers (7.4 per cent) of a minimum duration of two years and an average of 3.7 years’ dura- tion were detected, and another eight carriers were found among the contacts.
Attention is drawn to the following associa- tions: the proportion of carriers increases with age and depending on the length of time elapsed between the first symptoms and treatment; the proportion is significantly higher when there has been a relapse; there is observable association between being a carrier and the presence of biliary disorders.
The proportion of typhoid fever among con- tacts exposed to a proven carrier was almost five times higher than among the families in which no carrier was detected. 0
BIBLIOGRAPHY
(I) Budd, William. Typhoid Fever, Its Nature, de la fiebre tifoidea.” Rev Chile Hig Med Mode of Spread and Prevention. New York, Prev 13:65-77, 1951.
George Grady Press, 1931. (6) Moroder, J., and F. Lbpez. “El problema de (2) Conradi, S. Klin Jb 17:273, 1907. 10s portadores de tifoidea.” Bol Med Sot
(3) Kraljevif, R., et al. “Cloromicetina y tifoidea; 10:167-171, 1943.
experiencia sobre 500 cases.” Rev Med (7) Garck, C., and E. Prado G. “Bases y pro-
Chile 80:9, 1952. grama para el control de la fiebre tifoidea, (4) Vild6sola Moreno, J. “DistribucZn geogrb con especial referencia a la ciudad de
fica de 10s cases de fiebre tifoidea y parati- Santiago.” Rev Chile Pediat 17( 12):809- foidea denunciados en las comunas de Santi- 837, 1946.
ago, Providencia, Nuiioa, San Miguel y (8) Borgoiio, J. M., and M. Latorre. “Estado Quinta Normal.” Rev Chile Hig Med Prev actual de la epidemiologia de la fiebre 8:261-266, 1946. tifoidea en la Provincia de Santiago.” Rev
(5) Romero, H., et al. “Aporte a la epidemiologia Chile Hig Med Prev 1.5(3-4):53-64, 1953.
OTHER REFERENCES
Anderson, G. W., et al. “Typhoid Carriers: A Santiago, Ediciones de la Universidad de Chile, Study of Their Disease-Producing Potentialities 1964.
over a Series of Years as Indicated by a Study DrigaIsky, W. Zbl Bakt 35:776, 1904.
of Cases.” Amer J Public Health 26:396-405, Folley, A. R. “A Chronic Typhoid Carrier.” Canad
1936. J Public Health 35: 196, 1944.