CONSUMER PERCEPTION ON THE HEALTHINESS OF SNACKS IN NIGERIA
THESIS
submitted in partial fulfilment of the requirements for the degree
EUROPEAN M.Sc. in
Food Science, Technology and Nutrition
by
Damisola Blessing Adeeko
ACKNOWLEDGEMENTS
I would like to thank my supervisors, Prof. Hans-Peter Voss, Patricia Silva and Manuela Pintado for their assistance and guidance while writing my thesis. Your knowledge and experience was invaluable. Thank you for your help and advice over the last eight months. I would also like to acknowledge Deji Ajayi and my uncle, Omotayo Damola for their help with the questionnaire distribution in Nigeria.
I would like to thanks my friends, Isaac, Lola, Towsyn, Annabel, Olamide, Florence, Praise and Tunde for their constant words of encouragement, support and friendship. It means the world to me. Also for helping me out with the construction of my questionnaire.
A big thank you to my parents who has been there for me tremendously during the two years of my masters and constantly push to me to be better.
Most of all I’d like to thank my sister Victoria for encouraging me to undertake this Masters. I have her love and support in everything I do. She has been a constant source of support and motivation not only throughout my studies but for most of my life. To my sister I dedicate thesis.
Completing my Masters would not have been possible without the support of all of these individuals.
i
Table of Content
LIST OF ABBREVIATIONS ... iii
RESUMO ... v
ABSTRACT ... vi
1. INTRODUCTION ... 1
1.1 Overweight and obesity ... 3
1.2 Tracking the issue of overweight /obesity from childhood to adulthood ... 4
1.3 Health problems related with obesity and overweight ... 5
1.4 Changes in the society that contributed to overweight and obesity ... 5
1.4.1 Globalization ... 5
1.4.2 Urbanization ... 7
1.4.3 Occupation ... 7
1.5 Healthy snack consumption ... 8
1.6 Unhealthy snack consumption ... 9
1.7 Food related lifestyle framework ... 10
1.8 Summary ... 12
2. AIMS AND HYPOTHESIS ... 12
3. MATERIALS AND METHODS ... 13
3.1 Selection of snacks ... 13
3.2 The questionnaire ... 14
3.3 Data analysis ... 17
4. RESULTS ... 17
4.1 Demographic characteristics of the respondents ... 17
4.2 Respondent’s frequency of consuming snacks ... 19
4.3 Time of day respondents consume snack categories ... 20
4.4 Where respondents consume snack categories ... 21
4.5 The basis on which respondents consume snacks ... 22
4.6 Respondent’s perception on the healthiness of snack categories ... 23
4.7 Respondent’s level of enjoyment for snack categories ... 26
4.8 Types of food respondents consume snacks with ... 28
4.9 Respondent’s views on the importance of different criteria in snacks they consumed ... 29
ii
4.11 Respondent’s reasons for purchasing snack categories ... 31
4.12 Respondent’s intentions to purchase snack categories within next seven days ... 33
4.13 Possible reasons that might persuade respondents to purchase snack categories ... 34
4.14 Places where respondents purchase snack categories ... 35
4.15 Respondents views on the affordability of snack categories ... 35
4.16 Summary of key findings ... 36
5. DISCUSSION ... 37
5.1 Limitations of the study ... 40
5.2 Future research ... 41
6. CONCLUSION ... 41
7. REFERENCES ... 42
iii
LIST OF ABBREVIATIONS
EDSP Energy Dense Snack Products SSA Sub-Saharan Africa
FRLM Food Related Lifestyle Model WHO World Health Organization
v
RESUMO
As mudanças no comportamento de snacking nos países em desenvolvimento são uma preocupação crescente. Isto porque os alimentos consumidos como snacks tendem a ser altamente energéticos e pobres em nutrientes.
Estudos anteriores demonstraram que as alegações de saúde podem influenciar a perceção do consumidor sobre os snacks, porém pouco se sabe especificamente sobre quão saudável as diferentes categorias de snacks são percebidas pelos consumidores. Determinar como os Nigerianos percecionam os snacks que consomem pode permitir melhorar a comunicação para promover um aumento no consumo dos snacks mais saudáveis ou motivá-los a optar por alternativas mais saudáveis de snacks altamente energéticos que já consomem. Este conhecimento é importante para o planeamento de intervenções bem-sucedidas e para a conceção de snacks saudáveis, que também podem ser apelativos para grupos com riscos alimentares mais elevados.
O objetivo foi investigar como os Nigerianos percebem quão saudáveis são as diferentes categorias de snacks disponíveis para consumo na Nigéria. Um questionário foi desenvolvido com base no Grunert’s Food Related Lifestyle Model (FRLM) considerando vários fatores que influenciam as perceções, intenções e relatos de compra das categorias de snacks. Os dados foram analisados no Excel usando análise de clusters, análise de variância e testes
t-student. O estudo teve uma taxa de resposta de 42%, com 43 participantes que completaram o
questionário. Os resultados mostraram em que ocasiões as diferentes categorias de snacks são consumidas, a disponibilidade e acessibilidade das mesmas. Adicionalmente, foram também investigadas as diferenças na perceção de saudável e na preferência das categorias de snacks. As diferentes categorias apresentam diferenças significativas na perceção de serem ou não saudáveis [F (6, 294) = 23,44, (p = 0.000)] e também na sua preferência de consumo pelos consumidores [F (6, 294) = 3,31, (p = 0.000)].
vi
ABSTRACT
Changes in snacking behavior in developing countries are a growing concern. Since food commonly consumed as snacks tend to be both energy dense and nutrient poor. Previous research has shown that health claims can influence consumer’s perception of snack products, however little is known about consumer’s perceptions on the healthiness of specific snack categories. Determining how the Nigerian demographic perceive the snacks they consume can allow for better communication to promote an increase in the consumption of healthier snacks or motivate them to opt for healthier alternatives of the energy dense snacks they already consume. This knowledge is important for planning successful interventions and designing healthy snacks that can also appeal to population groups with higher dietary risks.
The aim was to investigate how Nigerians perceive the healthiness of common snack categories available for consumption in Nigeria. A questionnaire was developed based on Grunert’s Food Related Lifestyle Model (FRLM) as a framework for considering various factors which influence perceptions, purchase intentions and reported purchasing of snack categories.
The quantitative data was analyzed on Excel using cluster analysis, ANOVA, and paired t-test. The study has a 42% response rate with 43 respondents completing the questionnaire. The results showed the consumption of selected snack categories in relation to the time of day they’re consumed, the availability and affordability of the snacks. In addition to that,
respondents perceived healthiness level and liking of each snack categories were also investigated. There were significant differences at the p<0.05 level between perceived healthiness (F (6, 294) = 23.44, p=0) and liking (F (6, 294) =3.31, p=0) of snack categories.
1
1. INTRODUCTION
Snacks are described to be a portion of food, smaller than a regular meal, generally consumed between meals (Falola, 2001). Snacks come in different forms including packaged snack foods, processed snacks, and items made from fresh ingredients at home supermarkets or local street vendors (Bucher et al., 2016). Traditionally, snacks were prepared from household ingredients such as fruits, nuts, grains, leftovers and the like (Falola, 2001). With the spread of convenience stores, packaged snacks became a significant business across the world. Snack food are designed to be convenient, quick, and satisfying (Gershoff, 2009). Process snack foods, as a form of convenience foods, are designed to be less perishable, more durable, and more portable than prepared foods. However, they often contain substantial amount of preservatives, sweeteners, and ingredients that makes them energy dense and nutrition poor. (Nelson, 2014).
With close to $400 billion in annual worldwide sales, the snack industry has become an increasingly profitable market globally with a 2% year-over-year increase (Nielson, 2014). Europe and North America make up the majority of the worldwide snack sales with $167 billion and $124 billion respectively. Although annual snack sales in Asia, South America, and the Middle East/Africa are significantly lower than the other two regions, with $46 billion, $30 billion, and $7 billion respectively, annual growth in these developing regions increased greater over the past years- 9% in South America, 4% in Asia, and 5% in the Middle East/ Africa (Table 1).
Table 1. Global retail annual sales of snacks ending March 2014 (Nielson, 2014)
Continental Region Annual sales in
Dollars(ending March 2014)
Annual Growing rate
Europe 167 billion Flat
North America 124 billion 2%
South America 30 billion 9%
Asia 46 billion 4%
2
Increasing levels of globalization, urbanisation, work force population, and sedentary lifestyle has aided in the growth of this industry in developing regions (Ogunbode et al., 2011),
causing more people to result to snacking in order to fulfil their daily fix of nutritional intake. According to Table 1, Africa has one of the most rapidly growing snack industries in the world. With that also comes increased level of overweight and obesity. Ziraba (2009) conducted a study to analyse overweight and obesity in urban Africa and concluded that overweight and obesity are on the rise in Africa, with an increase of 35% within a ten year span. There are very little surveys from African countries that provides information on obesity in general, as most public health nutrition programs have been focused on under-nutrition and food safety problems (Lobstein, 2015), and no study has associated the linkages between the increased snack consumption and an increase in overweight and obesity.
This study focuses mainly on Nigeria, the most populous country in Africa. About two-thirds of urban, professional, high socio-economic status Nigerians are either overweight or obese. The prevalence of overweight and obesity among this population is equivalent to that of the United Kingdom’s (Akarolo-Anthony et al., 2014). Like the majority of the world’s
population, Nigerians also have a habitual nature regarding snacking. However, there is a lack of correct measurement of dietary intake due to inadequate consumption and food database instruments in Nigeria (Ene-Obong et al., 2013).
Popular snacks consumed by Nigerians were listed by Toyin Falola (2001), however, little studies exist that has elucidated linkages between snacks and consumer’s perceptions on the healthiness of the snacks. This study aims to highlight the ongoing issues regarding health problems caused by unhealthy consumption and uncover the mind-sets of Nigerians towards healthier snack products.
To date, no universal definition of the ‘healthiness’ of a food exists. This is most likely due to the numerous factors that needs to be considered, including nutrient content, cooking method, and portion size (Lobstein and Davis, 2009). In their study, Lobstein and Davies (2009) attempted to develop a way to define the healthiness of food using a nutrient profile method. They include nutrients that has negative impact on perceived healthiness (i.e. energy,
3
fibre, nut and protein content). This method allowed the direct comparison of the healthiness of different foods across categories. However, this method does not include the perception of consumers towards certain snack foods.
Therefore, this study aims to uncover the mind-set of Nigerians towards snack products and highlight the ongoing issues regarding health problems caused by unhealthy food
consumption.
1.1 Overweight and obesity
According to the World Health Organisation (WHO) (2014), overweight and obesity are directly responsible for at least 2.8 million deaths worldwide each year, while the health care costs coming from poor dietary patterns accounts for more than 3.6% of the gross national income in developed countries (Popkin et al., 2006). The increase in portion sizes (Young and Nestle, 2007) and changes in eating patterns, including more frequent snacking, have been identified as contributing to the obesity epidemic (Hill and Peters, 1998; Young and Nestle, 2002).
The increasing prevalence of overweight and obesity once thought to be a problem of the developed nation is recently becoming a public health issue for developing countries (Chukwuonye et al., 2013; WHO, 2000; Rivera et al., 2002; Filozof et al., 2001). Nigeria, a developing country, is the most populated country in Africa, with increasing lifestyle changes accompanied with increased risks of non-communicable diseases. Although data on obesity in Nigeria is scarce, there is a clear secular trend of profoundly increased weight. This growing rate brings forth a concern which requires urgent attention if it’s potential morbidity,
mortality, and economic tolls are to be avoided (Ogundipe and Obinna, 2010). According to Chukwuonye et al. (2013), the prevalence of overweight and obese individuals in Nigeria are of epidemic proportions, ranging from 20.3%–35.1% and 8.1%–22.2% respectively. The main cause of the moderate increase in overweight and obesity in the developing world is the dietary and lifestyle changes that accompany the development of the economy that includes less physically demanding manual labor, urbanization, rising purchasing power and
modernized food marketing. In other words, the westernization of societies (Witkowski, 2007). Other causes of overweight and obesity includes the lack of physical activity, sedentary lifestyle and the eating habits of the family (Ogunbode et al., 2011).
4
The increasing availability of Energy-Dense Snack Products (EDSP), reduced time for cooking, larger serving sizes and the increase in the consumption of meals outside of the home has contributed to diets becoming increasingly high in fat. Ben-Bassey et al., (2007) believes that there is a clear relationship between obesity and overweight and some
sociocultural variables in Nigeria. These variables being, level of activity both at school and at home, number of household members, frequency of eating in restaurants, level of education of parents, socioeconomic status, and age. Due to the ongoing transition towards western lifestyle associated with affluence that is being witnessed particularly in Lagos, a majorly industrialized megacity in Nigeria, the adolescents are more exposed to television, fast foods, restaurants, advertisements of food products, motorized means of transportation and the Internet, in addition to the introduction of baby formula early in life with or without breast milk, a combination which in later life could predispose an individual to overweight and/or obesity (Laditan, 1981).
Studies have shown that overweight/obesity in childhood and adolescence often leads to obesity in adulthood (Caballero, 2001; Cole, 2000; Guo et al., 2002; Kapil et al., 2002; Mokhtar et al., 2001). An overweight individual is at greater risk for the morbidity and mortality associated with obesity (Ben-Bassey, 2007). Therefore it is advisable to tackle the problem from a younger age.
1.2 Tracking the issue of overweight /obesity from childhood to adulthood
The probability of being obese as an adult is three times higher for children with one parent who is obese compared to a child with no obese parents (Birch & Fisher, 2000). Obesity rates among adults have increased significantly since 1996 for both male and females. According to the World Health Organization (WHO), more than one-third of African women and a quarter of African men are estimated to be overweight and it was predicted that by 2016, the number of overweight African men and women will be 30% and 41% respectively (Ogundipe and Obinna, 2010).
5
1.3 Health problems related with obesity and overweight
Overweight and obese individuals are at risk of other physiological and physical health problems and increased risk of mortality (Lobstein et al., 2004). It has been documented that obesity can be linked to chronic diseases such as cardiovascular disease, hypertension and some cancers (Chukwuonye et al., 2013; Bray, 1985). Obesity is a known risk factor for cancer of the pancreas, kidney, oesophagus, colorectal and breast (Lobstein et al., 2004). Cardiovascular disease and cancers are in the top 5 non-communicable causes of deaths among the Nigerian population (WHO, 2014).
Overweight and obesity is also closely linked to type two diabetes. This condition is more commonly observed in adults, however it is now also being diagnosed in children. (Lobstein et al., 2004; Goran et al., 2003). The prevalence of diabetes in Nigeria is an increasing concern, having doubled in less than a decade (WHO, 2005; WHO, 2014).
Other health problems include; respiratory disorders (Wang & Dietz, 2002), liver problems (Atshaves et al., 2006; Wang & Dietz, 2002), and sleep apnoea (Wang & Dietz, 2002; Lobstein et al., 2004). Additionally, low self-esteem, social isolation, depression, heat intolerance, breathlessness on exertion and tiredness are also risk factors of overweight and obese individuals (Lobstein et al., 2004).
1.4 Changes in the society that contributed to overweight and obesity
Various changes in the latter half of the 20th century have impacted people’s food and lifestyle choices, namely globalization, urbanization, and occupation. These changes resulted in people consuming more EDSP and becoming less active, ensuing in the increase in overweight and obesity (Perez-Cueto et al. 2010; Lobstein et al., 2004). An increased amount of food are prepared away from home, pre-packaged foods have become more popular and the portion size of food has become larger (Cummins & McIntyre, 2006; Rolls et al., 2002). Families are eating out more and fast food and snacks are an increasing proportion of household food expenditure (Cummins & McIntyre, 2006; Lobstein at al., 2004).
1.4.1 Globalization
Globalization, as described by Chapman (2009) is ‘a process characterized by the growing independence of the world’s people, involving the integration of economies, culture,
6
technologies, and governance’ (Chapman, 2009). Globalization may bring about positive changes to a developing country, such as increase in socioeconomic status and education, and reduced mortality due to communicable diseases (Bhagwati, 2004; Misra and Khurana, 2008; Aikins et al., 2010). It’s also been known to benefit developing countries through increases in employment, productivity, and quality of life (Sachs, 2005). In spite of that, globalization may also create serious problems for developing countries, some of which impacts nutrition
(Chopra and Darnton-Hill, 2006; Unwin and Alberti, 2006). For one, control of food supplies has become increasingly concentrated in the hands of a number of transnational corporations (Unwin & Alberti, 2006). For example, Cargill controls 80% of the world’s grain distribution (Murphy et al., 2012). These aspects of free trade have resulted in developing countries moving away from internal production and consumption of staple foods towards imports of both staples and fat inducing processed food (Abdulai, 2010). Africa has seen the largest increase in food imports of any region since 2000, with agriculture in SSA shifting toward the commercial farming of ‘highly valuable’ products such as exotic fruits or cut flowers for export (Chopra & Darnton-Hill, 2006). This globalization of food markets has brought about the introduction of unhealthy low-cost and processed foods to urban centres of sub-Saharan Africa (Abdulai, 2010). Foods imported through global trade are often marketed aggressively, with the goal of increasing consumption; brands such as McDonald's and Coca-Cola are now promoted globally (Labonte and Schreker, 2007).
These forces of globalization have played a role in the beginnings of a ‘nutrition transition’ in some areas of sub-Saharan Africa (SSA), where traditional staple diets rich in whole grain, fruits and vegetables are replaced by ‘Westernized’ diets rich in fat, sugar and nutritionally poor calories (Drewnowski and Popkin, 1997; Popkin, 1998a, b). This nutrition transition, which has already occurred in most developed and in some developing countries, brings with it increases in obesity and related illnesses and social costs (Drewnowski and Popkin, 1997; Popkin, 1998a, b).
These new food distribution and production patterns, when combined with increases in sedentary occupations and rapid urbanization that often come with globalization, create a milieu in which overweight and obesity risk can soar (Kadiri, 2005; Maher et al., 2010). As a distant factor, globalization is a driver for many of the intermediate and proximate factors discussed earlier and a critical component of any topic about the origin of SSA’s increases in overweight and obesity.
7
1.4.2 Urbanization
Due to the rise of globalization, urbanization is rapidly occurring in many of the developing countries. It is predicted that by 2020, half of all Africans will reside in cities. (Steyn et al., 2005; Misra and Khurana, 2008). Nigeria, is expected to see 14% increase in urbanization over the next decade with rural residents relocating to the cities to take advantage of the perceived employment opportunities and better life quality. Urbanization may offer social and economic advantages to some, but many migrants fail to flourish in urban cities, resulting in rising income inequalities in some African countries (Chopra and Darnton-Hill, 2006). Urbanization has also been linked to increased risk of obesity and chronic diseases in SSA (Aspray et al., 2000; WHO, 2015). Urban relocation often results in drastic changes in diet and activity levels (Popkin, 1998a, WHO, 2015) partly as a result of globalization, as mentioned earlier. Residents of the urban community often consume diets which are
significantly different from those in the rural community (Popkin, 2001). In rural cities, many people grow and consume traditional staple foods that are low in fat and calories.
As a result of globalization, urban cities have increased access to imported calorific, fatty, ‘western’ foods options that are marketed through television and other media outlets (Puoane et al., 2008). These foods are usually subsidized and affordable, making it highly
cost-effective and convenient to substitute the traditional staples (Misra and Khurana, 2008; Stiglitz and Charlton, 2005). There is also an increase in the consumption of foods outside of homes, especially in middle-class areas. In addition, more urban women work outside of their homes, giving them less time to prepare homemade meals, which in turn results to an
increasing family reliance on ready-made or packaged foods (Stiglitz and Charlton,2005; Nugent, 2008). Over time, there is a big possibility these foods may partly or completely replace traditional foods (Renzaho, 2004).
Evidence exists proving that in SSA, the longer a person from a rural community is a part of a more urbanized region, the increased likelihood of the risk of obesity. (Abubakari et al., 2008; Renzaho, 2004)
1.4.3 Occupation
Shifts in occupation, which are partly the result of urbanization and globalization has also implicated the rates of overweight and obesity among the population of SSA as a whole. Urban jobs are often more sedentary than the rural jobs workers did before, leading to a
8
decline in physical activity at work and also the increase of people grabbing snacks and eating away from home (Misra & Khurana, 2008; WHO, 2015).
As new technologies penetrate rural SSA, occupations there will begin to become less physically demanding as well (Misra & Khurana, 2008). This is not to say that movement of sub-Saharan African workers into jobs with higher wages and better working conditions always represents a negative trend, however, there needs to be more awareness that these developments creates vulnerability for the increase of overweight and obesity and the myriad of related health problems.
1.5 Healthy snack consumption
Healthy snacks are those that include key nutrients that have a positive impact on perceived healthiness (i.e. fruits nut, fibre and protein content). More recently, consumers are looking for snacks with a perceived health benefit. Nutrition is the number one reason why people snack globally (Nielson, 2014). It is therefore reasonable to assume that given a snack option that fills a need for nourishment, a high percentage of consumers will pick the option that is most convenient and nutritious.
A large untapped market exists to gain market shares in nutritious, portable and easy-to-eat meal alternatives that snack manufacturers could possibly fill (Nielson, 2014). This move towards healthy snacking is driven by the youngest generations- Generation Z (ages 0-23), Millennials (ages 24-37), and Generation X (ages 38-48), which together amount to the bulk of the global population (McLynn, 2015). Snacks with all natural ingredients are rated very important by 45% of global respondents (Nielson, 2014).
Consumers are leaning towards a ‘less is more’ approach when choosing a snack. They find it important for snacks to be low in sugar, salt, fat and calories (Nielson, 2014). Snacking essentially does not have a negative impact on dietary quality. Rather, it has the potential to offer an opportunity for making healthy, lower energy dense food choices, which results in a wider variety of food being included in the diet (Whybrow and Kirk, 1997).
Snacking today is a prevalent behaviour and there is a very large opportunity in every snack category for manufacturers to call out the specific health benefits and there is also a
generational aspect to consider for each category when positioning and marketing snack foods.
9
1.6 Unhealthy snack consumption
Unhealthy snacks, although highly palatable, are usually high in saturated fats, sugars and sodium, which contributes to an overweight and obese population. Therefore, there is an urgent need for effective interventions that supports people in reducing their intake of unhealthy snacks. However, in order to do so, more knowledge on the reason why people snack unhealthily is required, as reasons for this behaviour are not straightforward. To illustrate, in contrast to unhealthy snacking, meals typically have well-defined moments induced by clear cues such as knowing it is mealtime of if they are feeling hungry (Cleobury and Tapper, 2014). Such direct motives seems to be less pronounced for unhealthy snacking and physiological motives supposedly play a large role in this behaviour (Cleobury and Tapper, 2014). The obvious reason most people snack is for pure enjoyment. They snack because the experience is pleasurable and it tastes good (Nielsen, 2014).
A study conducted by Verhoeven et al. (2015) stated that the main reason for consuming unhealthy snacks was to enjoy a special occasion. Other reasons includes, opportunity induced snacking, to celebrate a special occasion, to cope with negative emotions, as a reward, social pressure, and for energy (Verhoeven et al., 2015). They went on to say that the differences in reasons for unhealthy snacking based on participant characteristics were most reflective with age. With the exception of enjoying a special occasion, younger people indicated a higher score for each category. Additionally, they concluded that women had a higher score than men for half of the reasons, including to cope with negative emotions, to enjoy a special occasion, and to gain energy (Verhoeven et al., 2015).
According to the Nielsen report (2014), 76% of global respondents consume snacks often or sometimes to satisfy their hunger between meals or to satisfy a craving. 45% consume snacks as a meal alternative (Nielsen, 2014). There is a perception that snacks are intended mainly for in-between meals than for actual meal replacements. However, busy lifestyles often require a need to quick meals, and many opt for fast food options that can be highly calorific and low in health benefits. Investigating the reasons for why people snack unhealthily is important on a personal level (Verhoeven et al., 2015). Many health interventions require people to adjust the intervention technique to their personal circumstances. It is also important on a more general level, in order to determine the relative importance of different reasons for unhealthy snacking behaviour to establish priorities for health interventions (Cleobury and Tapper, 2014). So far, limited literature has been devoted to provide an integrative overview
10
of reasons for unhealthy snacking in a representative community sample like the Nigerian Demographic in order to determine the motives that are relatively important. The implications for health intervention however, might differ depending on the reason that is targeted.
1.7 Food related lifestyle framework
Grunert et al. (1998) constructed the Food Related Lifestyle Model (FRLM) that provides a framework for considering different factors which can influence the purchase and
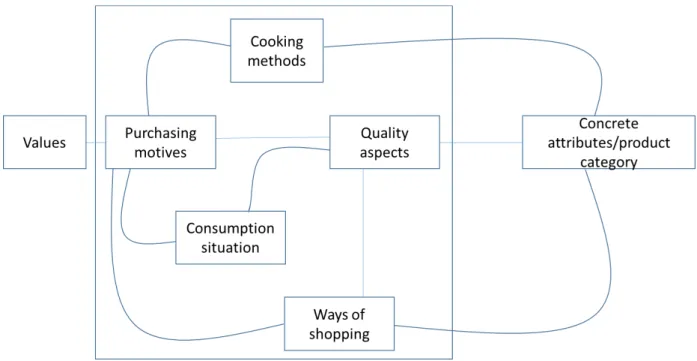
consumption of snacks by various groups in a population including the effects of consumer’s socio-demographic characteristics which may influence their perceptions, attitude and ultimately food choice. During the decision making process, individuals depend on various attributes or cues before deciding whether or not to make a purchase (Regaert et al., 2004). Food-related lifestyle is a set of mental constructs or cognitive categories, scripts and their link that relates a set of food products to a set of values (Brunso & Grunert 1998; Perez-Cueto et al., 2010). The FRLM considers lifestyle as a mental construct that explains behaviour. The main components of the FRLM were outlined by Brunso and Grunert (1998) as illustrated in figure 1. The boxes indicate groups of cognitive categories and the lines illustrates
associations between them. The FRLM incorporates:
Cooking methods. This section embodies the concept of cooking and how the products are
transformed into meals, looking for alternative ways to cook, convenience, preparation time, family involvement and spontaneity.
Quality aspects. This section focuses on what consumers demand/ require from food
consumption; Health, price-quality relationship, organic products, novelty, tastiness and freshness.
Purchasing motives. This section refers to the expectation consumers have from a meal;
security, social relationships and hedonism (Scholderer et al. 2003; Brunso & Grunert 1998).
Ways of shopping. This section highlights consumer food shopping behaviours; impulse or
deliberate purchasing, importance of product information such as labelling, love of shopping, attitude towards advertising, type of shops, price ranges or the product, use of shopping list, consideration of advice from friends, family, experts and sales assistants.
11
Consumption situations. This section examines the situations in which snacks or meals are
consumed; social events like birthday celebrations or family evening meals.
Figure 1: Cognitive structure model for food-related lifestyle model (Brunso & Grunert, 1998).
The FRLM has been used for numerous studies to examine consumer attitudes towards food and food related factors, such as likings or disliking, cooking and shopping (Brunso &
Grunert 1998; Perez-Cueto et al., 2010; Fang & Lee, 2009). The instrument links the role that food plays in the lives of individuals with food related attitudes to achieve a desired
consequence (Brunso & Grunert 1998; Perez-Cueto et al., 2010; Fang & Lee, 2009). The FRLM have been extensively tested in European markets with empirically proven validity and reliability (Brunso et al., 2004; O’Sullivana et al., 2005). The FRLM instrument is also wildly applied to empirical market analysis. For example, Kesić and Piri-Rajh (2003) used the FRLM instrument to segment Croatian consumers into five groups: A “relaxed group” of consumers who are not interested in buying and preparing foods and reluctant to change eating habits; “traditionalists” who pay more attention to foods and costs and
generally are good cooks; a “modern group” of consumers who dislike spending time buying, preparing and cooking foods and wish to shorten shopping and cooking times; a “concerned group” of consumers prefer organic foods and avoid food products with additives; and
“hedonists” who emphasizes food freshness and enjoy eating, buying and cooking foods with friends and family. A modification of the FRLM was applied by Bruwer et al. (2002) to
12
segment the Australian wine market into five different categories, each of which were characterized by different drinking habits. De Boer et al. (2004) examined Irish consumers’ purchasing behaviours for convenience food-related products to discover that fast and instant food consumers care about social activities most, like to try new tastes, new recipes and prepare various kinds of foods. They also hold positive attitudes toward advertising. Ryan et al. (2004) employed the FRLM to segment Irish consumers into six groups to discover that the derived food-related lifestyle segments are similar across several nations. For example, conservative and uninvolved consumer segments are included in all related studies, while adventurous and astute consumer segments also exist in many nations. Since the FRLM has only been tested mainly in Europe Asia and Australia, it is assumed that the dimensions and some items should be modified to fit the Nigerian/African culture.
1.8 Summary
The study of snacks has not been previously explored in Nigeria and to date, there is no literature available pertaining consumer’s perception on the healthiness of snacks.
Determining how the Nigerian demographic perceive the snacks they consume can allow for better communication to promote an increase in the consumption of healthier snacks or motivate them to opt for healthier alternatives of the or energy dense snacks they already consume. The present study gathers information on purchase intentions, reported purchasing, perceptions and beliefs of consumers in the Nigerian demographic regarding common snacks consumed in Nigeria using a modified version of Grunert’s Food Related Lifestyle model as a framework.
2. AIMS AND HYPOTHESIS
The current study examines the health perception, purchase intentions and reported purchasing of individuals in Nigeria regarding their snack consumptions. Harker’s (2003) study found that an individual’s choice of food or snack is often founded on their perception, beliefs and attitude towards the food. The intake of food can directly be associated with an individual’s lifestyle and preferences (Perez-Cueto et al., 2010). Based on these findings, it is hypothesized that individuals who show more interest in their own health will perceive the health properties of snacks to be important and prefect to consume snacks with perceived healthier benefits.
13
As individuals become increasingly time pressured, they may seek to satisfy their emotional needs by rewarding themselves with ‘treat’ foods, which are high in energy, fat and sugar (Bell & Swinburn, 2004; Blaylock et al., 1999). Based on these findings, it is hypothesized in this study that individuals who perceive convenience as ‘highly important’ will be more likely to purchase energy dense snack products and less likely to purchase highly nutritious snacks.
3. MATERIALS AND METHODS 3.1 Selection of snacks
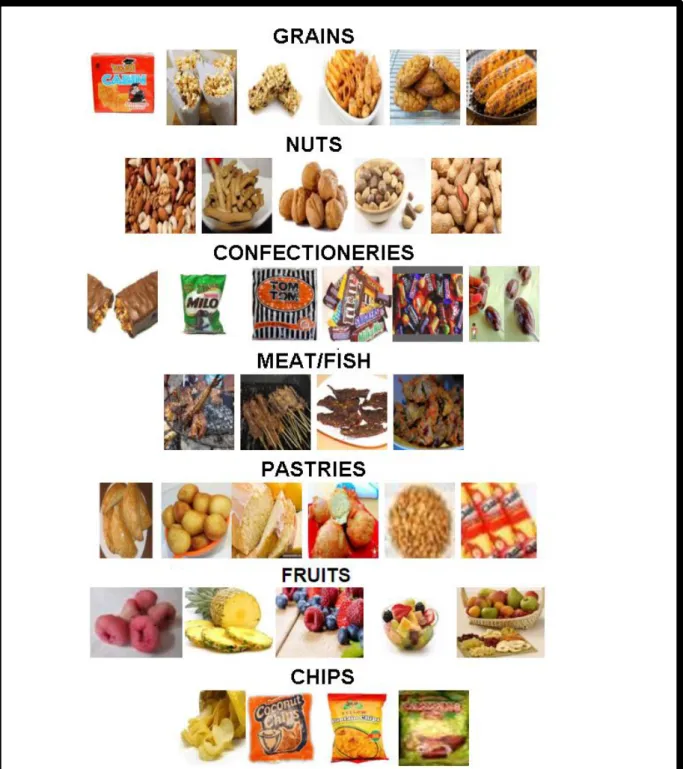
There is limited literature regarding the types of snacks commonly consumed by Nigerians. Nielson’s report (2014) highlighted the average top ten most consumed snacks globally, which were chocolate (64%), fresh fruits (62%), vegetables (52%), cookies/biscuits (51%), bread/sandwich (50%), yoghurt (50%), cheese (46%), chips/crisps (44%), nuts/seed (41%), and gum/ice cream (33%). This list was taken into consideration when constructing the list of snacks used for this study. Falola (2001) highlighted some commonly consumed snacks in Nigeria. These included Puff-puff, Chin-chin, Kuli-kuli, Nuts, Plantain chips, Gizzards, fried Fish, milo cubes, Kilishi, local fruits, grilled corn and the likes. The list of snacks for this study was generated by combining the data from Nielson’ (2014) report and the snacks from Falola’s (2001) Due to the extensive nature of the list from Falola’s (2001) , the snacks were sectioned into 7 categories- Grains, Nuts, Confectioneries, Meat/Fish, Pastries, Fruits and Chips (Table 2). Figure 2 shows the image stimuli used in the questionnaire. Images of snack examples were attached to their respective categories.
14 Table 2 Snack categories studied
Snack categories Snack examples
Grains Biscuits, Popcorn, Muesli bars, Grilled corn
Nuts Cashews, Peanuts, Walnuts, Kuli-Kuli
Confectionaries Hard candies, Chocolate bars, Milo cubes
Meat &Fish Suya, Fried fish, Kilishi
Pastries Meat pies, Cakes, Sausage rolls, Buns, Chin-chin, Puff-puff
Fruits Mangoes, Pineapples, Berries, African apples
Chips Potato chips, Plantain chips, Cassava chips
3.2 The questionnaire
A questionnaire was formulated on Qualtrics based on Grunert’s (1998) Food Related
Lifestyle Model (FRLM) as a guide for considering various factors that influence the purchase and consumption of snacks. A URL link was generated on Qualtrics and forwarded to
participants. Printed version of the questionnaire was not distributed, so it is important to note that only consumers with access to internet were able to complete the questionnaire. The questionnaire was divided into 2 sections. The first section consisted of 20 questions on the respondent’s perception, purchase intentions, consumption habits, patterns and occasion for the various snacks they consume. This included questions addressing factors which could impact the purchasing and consumption of snacks. Respondents were asked when, how often and where they consume the snacks listed. They were also asked about the availability of the listed snacks using a six point Likert scale ranging from: very readily available (1) to very readily unavailable (6). Participants were also questioned on their perception of what the snacks they consume should have, for example, a low glycaemic index, high nutritional value,
15
high antioxidants, high flavour contents, sweetness and satiety. They were required to rate each construct on a level of importance using a five point scale ranging from: important (1) to unimportant (5).
At the end of the first section of the questionnaire, an open ended question invited the
participants to express any opinions or comments relating to the snack that they would like to add.
The last section on the questionnaire elicited the respondent’s socio-demographic
characteristics and some questions on how they would personally view their health level. The variables to measure socio-demographic characteristics were age, gender, level of education, annual household income and living status. The full questionnaire is located in Appendix I.
16
17
3.3 Data analysis
All data were collected on Qualtrics and extracted through Excel, where descriptive statistics, including demographic information and frequency tables, were generated. Frequencies were calculated for each of the variables which were then created into tables and clustered column charts to compare values across different categories. A single factor ANOVA was performed to measure the level of significance between respondent’s perception on the healthiness of different snack categories, and the comparison of liking the respondents had for different snack categories at p<0.05. A paired t-test was conducted to further analyse the significant differences between each categories using Bonferroni correction for multiple comparisons.
4. RESULTS
4.1 Demographic characteristics of the respondents
Forty-three respondents out of one hundred and three people who participated in the
questionnaire completed it, resulting in a 42% completion rate. Demographic characteristics of the respondents are presented in table 3.1.
Out of the respondents that completed the questionnaire, forty-nine percent were male and fifty one percent were female. The respondent’s ages ranged from 18 to over 61 years old. The majority of the respondents were between the ages of 26 and 45. The majority of the male respondents live with their spouse and/or (48%) and the female respondents with their parents (55%) respondents either live with parents (35%) or with spouse and/or children (35%). Most of the respondents, both male (33%) and female (32%) earned a household income of below N200,000. The average household income per month for a middle class Nigerian is N75,000-100,000 (($480- 645) (Robertson et al 2011). 71 % of the male and 63% of the female respondents had a postgraduate qualification. In general, more male (67%) respondents viewed their health to be ‘excellent/ very good’ than the female respondents (54%). The male respondents (38%) thought more frequently about eating a low-fat diet that the female
respondents (18%). 43% of the male respondents said they actively thought about exercising daily ‘most of the time’, while 18% of the female respondents thought about it ‘most of the time’. However, the females that participated in this study care more about their looks before leaving the house (55%) and controlling their weights (43%) more than the male participants do (Figure 3.1).
18
Table 3.1 Demographics and personal health ratings of male and female (n=43). Male (21) (49%) Female (22) (51%) Age group Below 18 and 18-25 3 (15%) 7 (32%) 26-45 14 (67%) 15 (68%) 46-60 4 (19%) 0 (0%) Living status alone 6 (29%) 4 (18%) with parents 3 (14%) 12 (55%) with friends 2 (10%) 1 (5%)
with spouse and/or
children 10 (48%) 5 (23%)
Household income (per month)
Below N200,000 7 (33%) 7 (32%)
N200.000 to N400,000 2(10%) 1 (5%)
N400,000 to N600,000 2 (10%) 0 (0%)
Above N600,000 3 (14%) 2 (9%)
Rather not say 1 (5%) 5 (23%)
Education
Primary school 2 (10%) 0(0%)
Undergraduate 3 (14%) 7 (32%)
Postgraduate 15 (71%) 15 (68%)
Other 1 (5%) 0 (0%)
How would you rate your health
excellent 5(24%) 4(18%)
very good 9 (43%) 8 (36%)
fair 7(33%) 8(36%)
19
Figure 3.1 Participant’s views on their personal health
4.2 Respondent’s frequency of consuming snacks
The respondents were asked how often they consume the listed snacks. The snack category that was consumed the most often was Meat/Fish. 70% of the respondents consumed it
daily/multiple time a day, followed by Fruits, which was consumed daily/multiple times a day by 47% of the respondents. The snack category consumed the least frequent was Chips with a daily/multiple times a day consumption percentage of 7% (Figure 3.2).
20 Figure 3.2 Consumption frequency of snack categories
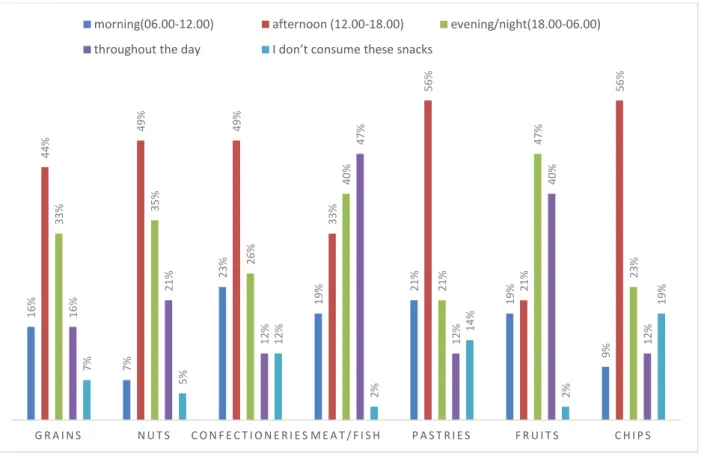
4.3 Time of day respondents consume snack categories
Figure 3.3 illustrates that the most popular times to consume snacks is afternoon (between 12.00 and 18.00). During this time the most consumed snack category are Pastries (56%) and Chips (56%). 19% 30% 23% 70% 19% 47% 7% 40% 37% 40% 23% 37% 47% 28% 19% 26% 19% 2% 28% 2% 30% 23% 7% 19% 5% 16% 5% 35%
daily/multiple times a day weekly/ multiple times a week
21 Figure 3.3 Time of day snack categories are consumed
4.4 Where respondents consume snack categories
When asked where they consumed the different snack categories, 91% of the respondents said they consumed Fruits at home, followed by Meat/Fish (86%) and Nuts (63%). Chips (53%) and Pastries (30%) were mostly consumed on the go (Figure 3.4).
16% 7% 23% 19% 21% 19% 9% 44% 49% 49% 33% 56% 21% 56% 33% 35% 26% 40% 21% 47% 23% 16% 21% 12% 47% 12% 40% 12% 7% 5% 12% 2% 14% 2% 19% G R A I N S N U T S C O N F E C T I O N E R I E S M E A T / F I S H P A S T R I E S F R U I T S C H I P S
morning(06.00-12.00) afternoon (12.00-18.00) evening/night(18.00-06.00)
22
Figure 3.4 Places where respondents consume snack categories
4.5 The basis on which respondents consume snacks
The respondents were asked on what basis they consume the listed snacks. The snack category with the highest ‘Thought out/ with a goal in mind’ percentage was Fruits (58%), followed by Meat/Fish (40%). However, Meat/Fish is mostly consumed habitually (47%). Grains (49%) and Nuts (44%) are the most impulsively consumed snack category (Figure 3.5). 53% 63% 49% 86% 26% 91% 26% 37% 33% 42% 14% 47% 30% 53% 12% 12% 14% 37% 30% 19% 21% 40% 44% 42% 40% 42% 49% 42% 9% 7% 7% 2% 12% 2% 12% G R A I N S N U T S C O N F E C T I O N E R I E S M E A T / F I S H P A S T R I E S F R U I T S C H I P S
23
Figure 3.5 Basis on which respondents consume snack categories
4.6 Respondent’s perception on the healthiness of snack categories
When asked to rate each of the snacks on their healthiness from healthy (1) to unhealthy (5), the respondents answered as follows (Figure 3.6):
Grains
Grains were perceived as healthy/ slightly healthy 79% of the respondent. 12% of the respondents perceived Grains to be slightly unhealthy/unhealthy.
Nuts
Nut were perceived as healthy/slightly healthy by 91% of the respondent and 5% of the respondents perceived Nuts to be slightly unhealthy/unhealthy.
Confectioneries
Confectioneries were mainly perceived to be slightly unhealthy/unhealthy (47%); 33% perceived Confectioneries to be healthy/slightly healthy.
Meat/Fish 49% 44% 30% 35% 33% 30% 28% 28% 26% 40% 16% 58% 35% 21% 47% 37% 23% 21% 26% 21% 28% 16% 28%
impulsive thought out/with a goal in mind habit
24
The majority of the respondents perceived Meat/Fish to be healthy/slightly healthy (81%); 14% of the respondents perceive Meat/Fish snacks to be slightly unhealthy/unhealthy.
Pastries
Pastries was perceived as slightly unhealthy/unhealthy by 49% of the respondents; 30% of the respondents perceived Pastries as healthy/slightly healthy.
Fruits
A total of 93% of the respondents perceive Fruits to be healthy/slightly healthy (Figure 3.6).
Chips
Chips were perceived by 44% of the respondents to be healthy/slightly healthy; 40% of the respondents perceive Chips to be slightly unhealthy/unhealthy (Figure 3.6).
Figure 3.6 Respondent’s perception of the healthiness of snack categories
79% 91% 33% 81% 30% 93% 44% 9% 5% 21% 5% 21% 2% 16% 12% 5% 47% 14% 49% 5% 40% G R A I N S N U T S C O N F E C T I O N E R I E S M E A T / F I S H P A S T R I E S F R U I T S C H I P S
healthy/ slightly healthy neither healthy nor unhealthy
25
Table 3.2 Average and standard deviations for perceived healthiness of snack categories (1= healthy, 5= unhealthy) SUMMARY (n=43) Categories Average SD GRAINS 1.93 1.12 NUTS 1.42 0.88 CONFECTIONERIES 3.21 1.41 MEAT/FISH 1.72 1.26 PASTRIES 3.21 1.3 FRUITS 1.23 0.81 CHIPS 3.02 1.34
ANOVA shows significant differences of perceived healthiness on snack categories (p<0.05) (F (6, 294) = 23.44, p=0.000). A t-test was conducted to further analyse the significant differences between each snack categories using Bonferroni correction (p = 0.05/7 = 0.007) (Table 3.3).
26
Table 3.3 Comparative paired t.-test for perceived healthiness of the snacks categories using Bonferroni correction. (p<0.007).
Grains Nuts Confectioneries Meat/Fish Pastries Fruits Chips
Grains 0.00 0.00 0.28 0.00 0.00 0.00 Nuts 0.00 0.00 0.13 0.00 0.17 0.00 Confectioneries 0.00 0.00 0.00 1.00 0.00 0.38 Meat/Fish 0.28 0.13 0.00 0.00 0.01 0.00 Pastries 0.00 0.00 1.00 0.00 0.00 0.35 Fruits 0.00 0.17 0.00 0.01 0.00 0.00 Chips 0.00 0.00 0.38 0.00 0.35 0.00
Legend: Values in pink cells refers to the categories which did not differ significantly with perceived healthiness.
Fruits was perceived to be the healthiest snack categories on average (Table 3.2) and it was shown to be significantly different from all the other categories, except from Nuts (p=0.17). Pastries were viewed as the most unhealthy snack category (Table 3.2) and it did not have a significant difference between Chips (p=0.35) and Confectioneries (p=1.00) (Table 3.3). Meat/Fish showed no significant difference between Grains (p=0.28) and Nuts (0.13).
4.7 Respondent’s level of enjoyment for snack categories
When questioned how much they enjoy consuming the listed snack -like extremely (1) to dislike extremely (9) - 74% of the respondents reported to like consuming fruits
extremely/very much. 72% reported to like extremely/very much the consumption of Meat/Fish followed by Nuts (58%) (Figure 3.7)
27
Figure 3.7 Respondent’s level of enjoyment for snack categories
Table 3.4 Average and standard deviations of participant’s liking of snack categories (1= like extremely, 9= dislike extremely)
ANOVA shows significant differences in liking on snack categories (p<0.05) (F (6, 294) = 3.31, p=0.000). A t-test was conducted to further analyse the significant differences between each snack categories using Bonferroni correction (p=0.05/7=0.007) (Table 3.5).
30% 58% 42% 72% 16% 74% 26% 53% 35% 40% 23% 65% 21% 51% 16% 7% 9% 5% 12% 5% 14% 0% 0% 9% 0% 7% 0% 9%
like extremely/ very much like moderately/ slightly neutral dislike slightly-extremely
SUMMARY (n=43) Categories Average SD GRAINS 3.09 1.23 NUTS 2.47 1.12 CONFECTIONERIES 3.12 1.72 MEAT/FISH 2.16 1.02 PASTRIES 3.44 1.40 FRUITS 1.91 1.21 CHIPS 3.60 1.64
28
Table 3.5 Comparative paired t-test for liking of the snacks categories using Bonferroni correction. (p<0.05/7=significant).
Grains Nuts Confectioneries Meat/Fish Pastries Fruits Chips
Grains 0.00 0.94 0.00 0.17 0.00 0.08 Nuts 0.00 0.05 0.10 0.00 0.01 0.00 Confectioneries 0.94 0.05 0.00 0.22 0.00 0.06 Meat/Fish 0.00 0.10 0.00 0.00 0.12 0.00 Pastries 0.17 0.00 0.22 0.00 0.00 0.48 Fruits 0.00 0.01 0.00 0.12 0.00 0.00 Chips 0.08 0.00 0.06 0.00 0.48 0.00
Legend: Values in pink cells refers to the categories which did not differ significantly with liking
On average, the most liked snack category is Fruits (Table 3.4) and it differed significantly with other categories albeit Meat/Fish (p=0.12). Grains were the liked the least (Table 3.4) and it had no significant difference with Confectioneries (p=0.94), Pastries (p=0.17), and Chips (p=0.08) (Table 3.5). The liking of Nuts showed no significance with Confectioneries (p=0.05) and Meat/Fish (p=0.10).
4.8 Types of food respondents consume snacks with
The respondents were asked what they consumed the listed snacks with. Grains were mostly consumed with carbonated soft drinks (29%). Nuts were mostly consumed with something high in carbs (19%) and non-carbonated drinks (19%). The majority of respondents chose ‘N/A’ for both Fruits (47%) and Confectionaries (39%), which leads to the assumption that consumers prefer to consume both these snack categories on their own (Figure 3.).
29
Figure 3.8 Types of food respondents consume snack categories with
4.9 Respondent’s views on the importance of different criteria in snacks they consumed
The respondents were given twenty-eight statements pertaining to what requirements they feel the snacks they consumed should have, and were asked to rate them on their level of
importance (1=unimportant, 5=important). The statements that were deemed most important by the respondents included, ‘refreshing’ (98%), ‘full of vitamins’ (93%), ‘low in salt’ (88%), ‘fresh’ (88%), and ‘appetising’ (88%) Figure 3.9).
30
Figure 3.9 Level of importance of different criteria in the snacks respondents consume
79% 88% 88% 74% 86% 81% 93% 84% 72% 49% 84% 63% 72% 67% 98% 84% 77% 84% 65% 74% 67% 77% 49% 84% 88% 81% 74% 84% 14% 9% 5% 14% 5% 12% 7% 9% 16% 33% 7% 21% 16% 23% 0% 9% 16% 12% 16% 7% 21% 12% 33% 9% 7% 9% 12% 9% 7% 2% 7% 12% 9% 7% 0% 7% 12% 19% 9% 16% 12% 9% 2% 7% 7% 5% 19% 19% 12% 12% 19% 7% 5% 9% 14% 7% 0% 20% 40% 60% 80% 100% 120% Low in fat Fresh Low in salt Low in added sugar High nutritional value Contain no additives Full of vitamins High in fibre Full of flavor Contain folate Hight in antioxidants Sweet Contain no atificial flavoring
Low glycemic index Refresshing
Filling Easy to eat at home Easy to eat on the go Have a long shelf life Ready to eat/require no preparation Easily shared among people Inexpensive High-class Easily accessible Appetizing Good value for money A suitable meal replacement Good to eat in-between meals
31
4.10 Respondent’s perception on the availability of snack categories
All the snack categories listed in this study were mainly ‘very readily available’ according to the respondents; Meat/Fish being the most available to the respondents (58%) (Figure 3.10).
Figure3.10 Respondents perception on the availability of snack categories
4.11 Respondent’s reasons for purchasing snack categories
Grains
The main reason of the respondent’s purchase of Grains was the fact that ‘they are readily available’ (42%), followed by ‘they are tasty’ (37%) and ‘they are inexpensive’ (28%). 5% of the respondents said that they didn’t purchase grain snacks. (Figure 3.11)
Nuts
The majority (44%) of the respondents reported to purchase Nuts because ‘they are readily available’. The second main reason Nuts were purchased was because ‘they are healthy’
47% 44% 51% 58% 30% 51% 35% 23% 26% 37% 23% 42% 33% 26% 14% 19% 5% 16% 12% 7% 26% 9% 9% 4% 2% 14% 7% 10%
Very readily available Readily available
32
(30%), followed by ‘they are tasty’ (26%). 5% of the respondents don’t purchase Nuts. (Figure 3.11)
Confectioneries
The main reasons that the respondents purchase Confectioneries are because ‘they are tasty’ (40%), ‘they are readily available’ (33%), and ‘they are inexpensive’. 7% of the respondents stated that they didn’t purchase Confectioneries. (Figure 3.11)
Meat/Fish
40% of the respondents all said that they purchase Meat/Fish snacks because ‘they are readily available’, ‘they are tasty’ and ‘they are healthy’. (Figure 3.11)
Pastries
The main reason the respondents had for purchasing Pastries was that ‘they are readily available’ (42%), followed by ‘they are tasty’ (35%) and habit (21%). 9% of the respondents said they didn’t purchase Pastries. (Figure 3.11)
Fruits
70% of the respondents said that the reason they purchase Fruit snacks was because ‘they are healthy’. 44% said they purchase it because ‘they are readily available, and 21% purchase it because ‘they are tasty’. (Figure 3.11)
Chips
The main reasons respondents had for purchasing Chips were because ‘they are tasty’ (42%), ‘they are readily available’ (28%), and Habit (19%). 9% of the respondents said they didn’t purchase Chips (Figure 3.11).
An option was added at the end of the question for the respondents that had ‘other’ reasons for consuming each snack category and they gave the following reasons; to compliment a
33
Figure 3.11 Respondent’s reasons for purchasing snack categories
4.12 Respondent’s intentions to purchase snack categories within next seven days
Respondents were asked what their intentions were to purchase snacks from the listed categories. Meat/Fish (77%) and Fruits (74%) were most ‘certainly’ to be purchased in the space of a week by the respondents (Figure3.11).
Figure 3.11 Respondent’s intentions of purchasing snack categories in the next seven days
42% 44% 33% 40% 42% 44% 28% 28% 16% 23% 7% 9% 16% 16% 37% 26% 40% 40% 35% 21% 42% 21% 30% 7% 40% 7% 70% 2% 16% 23% 19% 16% 21% 19% 19% 5% 2% 5% 9% 2% 0% 7%
they are readily available they are inexpensive they are tasty they are healthy habit other
37% 44% 33% 77% 21% 74% 14% 19% 28% 19% 9% 28% 16% 16% 23% 19% 28% 7% 30% 7% 37% 16% 5% 14% 7% 16% 2% 16% 5% 5% 7% 0% 5% 0% 16%
34
4.13 Possible reasons that might persuade respondents to purchase snack categories
Subsequently, the respondents were asked what might persuade them to purchase the snacks category if they didn’t already purchase them. Respondents said they would purchase Pastries (35%), Chips (33%) and Confectioneries (28%) ‘If they were healthier’. 23% of the
respondents all said they would purchase Grains, Nuts, Confectioneries and Chips more if ‘they were less expensive’ (Figure 3.12).
Figure 3.12 Possible reasons that might persuade respondents to purchase snack categories
21% 21% 14% 16% 5% 9% 19% 23% 23% 23% 16% 7% 12% 23% 26% 19% 28% 14% 35% 16% 33% G R A I N S N U T S C O N F E C T I O N E R I E S M E A T / F I S H P A S T R I E S F R U I T S C H I P S
If they were readily available If they were less expensive If they were tastier
35
4.14 Places where respondents purchase snack categories
Grains (58%), Nut (58%), Pastries (56%) and Confectioneries (67%) were mainly purchased in ‘supermarkets’. The majority of the respondents purchased Meat/Fish (58%) and Fruits (72%) in their ‘local market’. 47% of the respondents noted that they purchase
Confectioneries at the ‘corner shop’ (Figure 3.13)
Figure 3.13 Places where respondents purchase snack categories
4.15 Respondents views on the affordability of snack categories
Figure 3.13 shows that most of the respondents reported all the snack categories were affordable/slightly affordable (>79%). 9% and 7% of the respondents reported that Nuts and Fruits were slightly unaffordable/unaffordable respectively.
58% 58% 67% 40% 56% 51% 53% 35% 42% 35% 58% 26% 72% 21% 23% 33% 47% 21% 26% 35% 28% 35% 42% 23% 30% 21% 33% 37% 9% 7% 5% 2% 5% 14%
36
Figure 3.13 Respondent’s views on the affordability of snack categories
4.16 Summary of key findings
Meat/Fish appeared to be the most consumed snack daily, followed by Fruits and Nuts. The most common time of the day the respondents consumed most of the snack categories was in the afternoon (12.00-18.00). Meat/Fish and Fruits however were mainly consumed throughout the day. Respondents who consume Chips and Pastries mainly consume them on the go. Grains, Nuts and Pastries were mainly consumed impulsively. The consumption of Fruits, on the other hand was mainly thought out, with a goal in mind. Fruits, Meat/Fish, Nuts, and Grains were perceived by the respondents to be mainly healthy. The majority of the
respondents perceived all the snack categories of snacks to be affordable and consume most snacks at home, bar Chips and Pastries which were consumed mainly on the go. Respondents perceived Fruits (93%), Nuts (91%), and Meat/Fish (81%) to be the healthiest snack
categories. These categories were also the ones respondents noted to extremely/very much like consuming (Fruits (74%), Meat/Fish (72%), Nuts (58%)). There were significant
differences (p<0.05) between perceived healthiness (F (6, 294) = 23.44, p=0.000) and likings (F (6, 294) =3.31, p=0.000) of snack categories. Snack categories with perceived health benefits like Fruits and Nuts did not show a significant difference (p=0.17) or Meat/Fish and Nuts (p=0.13). Chip, however, showed significant difference between Grains (p=0.00), Nuts
91% 86% 79% 84% 88% 91% 91% 5% 2% 14% 14% 9% 2% 5% 2% 9% 2% 2% 2% 7% 0% G R A I N S N U T S C O N F E C T I O N E R I E S M E A T / F I S H P A S T R I E S F R U I T S C H I P S
37
(p=0.00), Meat/Fish (p=0.00) and Fruits (p=0.00). Likewise with Confectioneries and Pastries. When comparing the liking of the snack categories significant differences occurred between Grains and Nuts (p=0.00), Grains and Meat/Fish (p=0.00), Fruits and
Confectioneries (p=0.00), Fruits and Chips (p=0.00), and Pastries and Meat and Fish (p=0.00). Confectioneries and Grains did not differ significantly when comparing liking (p=0.94).
Four key perceptual factors were identified:
I. Convenience; snacks should be easily accessible, inexpensive, ready to eat, require no preparation before consumption, easy to eat both at home and on the go, and easily shared among people
II. Satisfaction; snacks should be appetizing, be good to eat in-between meals, fresh, filling and refreshing
III. Eating ‘good food’; snacks should have high nutritional properties such as; low in fat and salt, high in vitamins, antioxidants and fibre
IV. No additives; snacks should contain no additives, added sugar or artificial flavourings Grains, Nuts and Pastries were purchased mainly because they are readily available and respondents reported that they would purchase Chips and Confectioneries more if they were healthier.
5. DISCUSSION
The present study compares the perception, reported purchasing and purchase intentions of forty three Nigerian respondents who were at least eighteen years of age regarding the most consumed snack categories.
There was limited capacity for comparison of the present results with those of other investigators due to limited research on the topic. The findings from the current study are novel and have not been previously reported.
To the best of the candidate’s knowledge, this is the first study to explore consumer
38
there might be some bias in the findings as it seems that the majority of the respondents are health conscious. Reported consumption of Meat/Fish, Fruits and Nuts were high in the present study. These three categories are said to have a positive impact on perceived healthiness by Lobstein and Davies (2009), which echoed in the results of this study as the majority of the respondents ranked those three snack categories to be healthy. A plausible explanation for these high levels ‘healthy’ snack consumption is that the respondents in the study were older (above 46 years old) and more highly educated. Research has shown that mature individuals with higher levels of education are more likely to consciously eat healthier compared with lower levels of education (Dittus et al. 1995; Giskes et at. 2002).
The respondents reported that they consumed Fruits mainly at home. Previous research has shown that fruit intake is strongly correlated with the availability of fruit in the home (Neumark-Sztainer et al. 2003). Fruits appeared to be consumed throughout the day, with evening (18.00-00.00) being the most common time of the day. Other snack categories,
including Pastries, Confectioneries and Chips, on the other hand were mainly consumed in the afternoon. These findings suggests that fruits could be promoted to consumers as a good snack for the afternoon instead of the more energy dense snack categories like
Confectioneries and Pastries. The correlation between different snack products and the time of day they’re consumed need to be further explored
The respondents reported that all the snacks were mostly readily available to them. They did not perceive any of the snack categories to be unaffordable but in general preferred if the snacks they consume were inexpensive.
Time is required to gather information on nutrition and purchase and prepare nutritious food. However, current lifestyles have caused an increase in people’s time constraints (Perez-Cueto et al. 2010; Lobstein et al., 2004). Convenience foods are able to allow consumers to save time and effort in the preparation of meals and shopping (Buckley et al. 2007). In this study, convenience is a key factor to the respondents when choosing a snack. This suggests that perhaps consumers may be more likely to purchase healthier snacks if they were inexpensive, ready to eat (appropriately packaged) and highly accessible in supermarkets or local markets. A respondent noted in the comment section that some of the locally produce snacks have bad packaging material and have no expiry dates on them. Packaging of snacks is a potential area to explore further for the promotion of healthier snack products.
39
Respondents who perceived their own personal health level to be excellent and very good were more likely to extremely like consuming fruit snacks. This is consistent with Harker’s (2003) findings that showed a consumer’s choice between an apple or a chocolate bar as a reward for taking part in a consumer study could be predicted on their general health interest and cravings for sweet foods. Consumers with a high interest and positive perception on their health were more likely to choose and apple and consumer with low interest and negative perception on their health tended to choose a chocolate bar (Harker 2003).
Meat/Fish was the most frequently consumed snack category by the respondents (70% consuming daily). Although an image stimuli was given in the questionnaire under the each category, it is important to note that the respondents could have considered Meat/Fish as part of a meal as well as a snack which might have influenced the resulted high level of daily consumption in the study.
Overall the majority of the respondents in this study are aware of their health and tend to consume healthier snacks (those with a positive impact) than they do unhealthy snacks (those with a negative impact). They appropriately ranked the level of healthiness of each snack categories, with Fruits being perceived as the most healthy which had no significant difference with Nuts (p=0.17). Fruit was also the most liked snack category among the respondents, which had no significant difference with Meat/Fish (p=0.12).
It should be noted that the respondents may have over reported their consumption of healthier snack categories (fruits, meat/fish, nuts) and under reported their consumption of unhealthier snack categories (Confectioneries, Pastries, Chips). Self-reporting of dietary intake can be affected by social bias which might have influenced the respondent’s answers (Worsley et al. 1984; Hebert et al.1994). Individuals opt for social desirable responses in an attempt to present themselves in a positive light. In this context, it would be to appear to be behaving in a nutritionally positive way (Worsley et al. 1984; Hebert et al. 1994; Hebert et al. 2001). The present findings contributes to the limited knowledge about the perception Nigerians have towards different snack categories. Knowledge in the ways in which Nigerian consumers perceive the healthiness of snacks and their relationship with purchasing can help the delivery of better tailored health messages that promotes increased healthier snack consumption and influence purchasing behaviours. Communication of the negative and positive aspects of respective snacks and changes to improve convenience may promote the purchasing of
40
healthier snack products. These initiative may aid in the reduction of overweight and obesity prevalence among the population (Lobstein et al. 2004).
5.1 Limitations of the study
A number of difficulties were encountered throughout the duration of this study. To start off, it was conducted in a foreign country without direct access to a consumer base, limiting the gathering of some important statistics.
This research did not have the required amount of participants for a quantitative study. A sample size of one thousand was the initial goal and the questionnaire was distributed accordingly. However, only a hundred and three individuals opened and started the
questionnaire, and out of that amount, only forty three went on to complete it. A number of factors could have played a role in such a low sample size. The questionnaire was only distributed online, via a URL link. It might not have reached a number of people due to poor internet connection. At the end of the questionnaire when the option was given to comment on the questionnaire, an individual noted that the questionnaire was ‘hard to read on a smart phone’; this could be a reason why over half of the participants who started the questionnaire did not complete it.
It was intended to collaborate with the Federal University of Agriculture, Abeokuta, Nigeria in order to achieve the desired distribution amount, but due to busy schedule and
communication issues, that wasn’t successful, which resulted in a delay in retrieving the results of the survey and imapcted the sample size of the study.
The candidate didn’t have full access to the qualtrics account so constructing, editing, and data gathering of the questionaire demanded a high level of dependancy. In addition, the candidate had to begin an internship before the full survey data was retrieved. This proved inconvenient and also delayed the completion of the results.
It should be noted that the completed sample size for this study was very small and was not at all statistically representative of the overall Nigerian Population. Also, the findings relate to the specific list of seven snack categories which was by no means exhaustive, though it did represent commonly consumed snacks in Nigeria. It is possible that respondents may prefer other types of snacks that are not included in the present study.