Article ID: bijl.1998.0285, available online at http://www.idealibrary.com on
E
ffect of island geological age on the arthropod
species richness of Azorean pastures
PAULO A. V. BORGES∗Department of Biology and NERC Centre for Population Biology, Imperial College, Silwood Park, Ascot, Berks SL5 7PY
VALERIE K. BROWN
CABI Bioscience: Environment, Silwood Park, Buckhurst Road, Ascot, Berks Sl5 7TA
Received 30 May 1998, accepted for publication 8 September 1998
Species richness of six pasture arthropod assemblages (total arthropod species, total herbivore species, sucking and chewing herbivores, total predatory species and spiders) were regressed against several geographical variables (area, distance from the nearest mainland, maximum elevation and geological age of the islands) of three Azorean islands (S. Maria, Terceira and Pico). The species were sampled by the fixed-quadrat size sampling method and the results obtained are consistent with the geological age hypothesis, i.e. the species richness of the six indigenous arthropod assemblages increases with the geological age of the islands, both at local and regional scales. Higher values of indigenous and endemic species richness were consistently found on the older island (S. Maria), and the lowest values on the most recent island (Pico). Moreover, when considering the age of Faial (an older island probably once connected with Pico) as a estimate of the age of Pico, correlations between species richness and island age were improved, thereby strengthening the relationship. The older island (S. Maria) has more specialized herbivores and a greater proportion of herbivores in relation to predatory arthropods. Ecological and biogeographical studies in the Azores should take into account the effects of the time each island has been available for colonization and evolution.
1999 The Linnean Society of London
ADDITIONAL KEY WORDS:—island biogeography – island age – pasture arthropods – standard area sampling – species richness – time hypothesis.
CONTENTS
Introduction . . . 374
Volcanic islands and geological age . . . 375
Aims . . . 376
Material and methods . . . 377
∗ Corresponding author. Present address: Universidade dos Ac¸ores, Dep. de Cieˆncias Agra´rias, Terra-Cha˜, 9701-851 Angra do Heroı´smo, Terceira, Ac¸ores, Portugal. E-mail: pborges@angra.uac.pt
373
The study area . . . 377
Experimental design . . . 380
General sampling program . . . 380
Species sorting and identification . . . 382
Data analysis . . . 383
Results . . . 384
Species composition . . . 384
Herbivore and plant species richness patterns . . . 385
Island or habitat effect? . . . 387
The role of geographical variables: area, distance from mainland, altitude and geological age . . . 388
Endemic species . . . 393
Predator/herbivore species ratio . . . 394
Discussion . . . 396 Conclusions . . . 401 Acknowledgements . . . 402 References . . . 403 Appendix 1 . . . 407 Appendix 2 . . . 409 INTRODUCTION
The development of the ‘Theory of Island Biogeography’ (MacArthur & Wilson, 1963, 1967) has led to the creation of several methods for studying island biotas, with an extensive literature (see summaries in Connor & McCoy, 1979 and Rosenzweig, 1995; some critical analyses are available in Gilbert, 1980). It is now more or less accepted that the area of the islands per se does not explain all the variation in species number. Thus elevation, number of soil types, substrate types, plant species richness, number of habitats, habitat diversity, structure and hetero-geneity have frequently been used to explain the species area curve (see Hamilton et al., 1963; Weissman & Rentz, 1976; Williamson, 1981; Buckley, 1985; Deshaye & Morisset, 1988; Rydin & Borgegard, 1988; Kelly, Wilson & Mark, 1989; Hart & Horwitz, 1991; Becker, 1992). In fact, many factors which could affect either immigration and extinction were not included in the original equilibrium model of MacArthur & Wilson (1963, 1967).
The role of time as a variable in explaining species richness patterns in islands is still poorly explored in ecological work, although time is an important factor when measuring the accumulation of species in any environment (Williamson, 1981; MacArthur, 1984; Huston, 1994; Putman, 1994; Rosenzweig, 1995). In the now classic book, Age and Area, Willis (1922) proposed that species accumulate over time and that the diversity of a region is therefore directly related to its age as well as area. The time hypothesis also assumes that communities diversify over time (Margalef, 1963), though the scales at which the changes are measured vary from seasonal and successional (ecological time) to long-term geological time (evolutionary time). Examples of how species diversity varies through time in seasonal, successional and long-term evolutionary time (fossil record) are reviewed in Signor (1990), Huston (1994), Rosenzweig (1995) and Begon, Harper & Townsend (1996).
Geological time was also used in what Opler (1974) called the ‘geological time theory’, which proposes that numbers of associated herbivore species depend on the length of time during which their host plant has been present in a region. Some criticism of this theory has been made by Strong, McCoy & Rey (1977), Connor &
McCoy (1979) and Gilbert (1980), while Kennedy & Southwood (1984) found new evidence supporting the contribution of geological time (quaternary fossil records) to the accumulation of insect herbivore species on British trees, in accordance with the ‘age-accumulation model’ (Hart & Horwitz, 1991). However, the ‘geological time theory’, as an explanation for the accumulation of herbivores by plants over time, requires further testing (Birks, 1980).
Other studies have also reported age effects. Gue´gan & Kennedy (1993) found that, instead of an area-effect, the helminth parasite species richness in British freshwater fish is better explained by the colonization time hypothesis, i.e. that helminth species richness is related to the time since the fish host arrived in Britain. Geological age has also been recently used for explanations of local plant species richness by reference to the global regional pool of species. The ‘species-pool hypothesis’ (Taylor, Aarssen & Loehle, 1990; see also Zobel, 1992 and Eriksson, 1993) predicts that ‘‘all else being equal, the larger the local and/or global area of a habitat type and the older its geological age, the greater the past opportunity for speciation and hence, the greater the number of available species that are adapted to that particular type of habitat’’.
Volcanic islands and geological age
For remote oceanic islands like Hawaii, the Gala´pagos or the Azores, where the islands are of volcanic origin and have different ages, geological age should have some ecological and evolutionary importance (Williamson, 1981). In fact, early in the foundation of evolutionary theory, Wallace (quoted in Quammen, 1996) wrote: ‘‘. . . if God indeed performed special creation, producing custom-designed species to occupy each zone of landscape, then God had shown a strong bias toward geologically old islands. That is, old islands had received far more endemic species than young islands’’.
Carlquist (1974) in his book Island Biology emphasized the role of island geological age in the distribution patterns of plant species richness in the Hawaiian and Canarian archipelagoes. The author pointed out that using area per se, more species of plants are expected on the larger Big Island (Hawaii). Therefore, the relative youth of Big Island (Hawaii) and La Palma (Canary Islands) would explain some species impoverishment in the fauna and flora. The importance of island geological age in the species richness of island faunas has been discussed for drepanidid birds on the Hawaiian archipelago ( Juvik & Austring, 1979), for Scaptomyza flies from the Tristan da Cunha archipelago in the South Atlantic (Williamson, 1983), for endemic mammals of the Philippine islands (Heaney, 1986), for reptiles of the Islas Re-villagigedo (Mexico) (Brattstrom, 1990), for beetles in the Azores (Borges, 1992), for Rhyncogonus (Curculionidae) beetles in the Hawaiian Islands (Paulay, 1994) and for Caribbean anoline lizards (Losos, 1996). The high percentage of endemic spiders (Baert & Jocque´, 1993) and Drosophilidae (Begon et al., 1996; Hollocher, 1996) in Hawaii was reported to be a consequence of its old age and thus the long period of isolation of the archipelago. Cameron, Cook & Hallows (1996), studying the land-snails of Porto Santo island (Madeiran archipelago), claim that Porto Santo island, in spite of being 18 times smaller and lower than Madeira, is the most species-rich of the archipelago, a consequence of its older geological age. However, an absence of island age effect on species richness was recently reported by Peck (1996) for the
all species endemic species
Distance from the nearest mainland C S Geological age D Area A Altitude range B
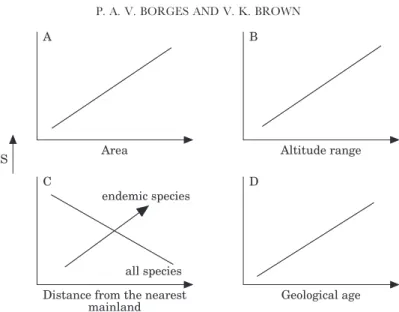
Figure 1. Four possible hypotheses for the way in which species richness (S) is related to geographical variables in oceanic volcanic islands.
(A) Species–area hypothesis (Preston, 1962a, b; MacArthur & Wilson, 1963, 1967). This hypothesis predicts that assemblages will be more species rich on larger islands; (B) Altitude range hypothesis. Island elevation may influence habitat diversity (greater elevation generates more habitats) (see for instance Johnson & Raven, 1973; Baez, 1987; Sjo¨gren, 1990 and Baert & Jocque´, 1993). Thus, a positive relationship between maximum elevation and species richness is predicted; (C) Isolation hypothesis. This hypothesis is part of the ‘Theory of Island Biogeography’ (MacArthur & Wilson, 1963, 1967), and predicts that, for a given taxonomic group, an island located near the source mainland should have more species than a remote oceanic island. On the other hand, a remote island may have more endemic species than a less isolated island (Williamson, 1981; Baert & Jocque´, 1993; Adsersen, 1995; Rosenzweig, 1995; Begon et al., 1996). (Arrowed line); (D) Time hypothesis. Advanced by Willis (1922), this hypothesis proposes that species accumulate over time and that the diversity of a region is therefore directly related to its age. Recent remote island archipelagoes may not be saturated with species due to the fact that there has been insufficient time for colonization and speciation (Harris, 1984; Begon et al., 1996). Therefore, in such conditions, it is predicted that the number of species on each island within a recent volcanic oceanic archipelago like the Azores is a function of its geological age.
orthopteroid insects of the Gala´pagos Islands. Species richness in this study was significantly positively correlated with ecological diversity and area.
Most of the above mentioned works illustrate the principle that the amount of time since oceanic volcanic islands rose above sea level may be an important determinant of species richness, independent of island area (see Williamson, 1983 and 1988; Harris, 1984; Heaney, 1986). However, there have been few previous attempts (see Borges, 1992; Paulay, 1994) to quantify the effects of age on the species richness of volcanic-island faunas.
Aims
This paper tests the prediction that arthropod species richness within two habitats (sown pasture and semi-natural pasture) of a remote, recent oceanic archipelago (the Azores) is influenced primarily by the geological age of the islands. The
hypothesis that increasing geological age increases the rate of species accumulation, either by immigration or speciation, is tested and contrasted with three other models, the ‘species-area hypothesis’, the ‘altitude range hypothesis’ and the ‘isolation hypothesis’ (see Fig. 1).
Three islands from the Azorean archipelago were selected for study. The oldest island, St. Maria (8.12 Myr BP, Abdel-Monem, Fernandez & Boone, 1975), the young-est island, Pico (0.300 Myr BP, Chovellon, 1982) and a middle-aged island, Terceira (2 Myr BP, Queiroz, 1990). The ‘geological age hypothesis’ is tested using two sets of geological ages for the subaerial shield phase of the recent island (Pico). This island is currently separated from the nearest one (Faial) by a shallow 5 km wide channel with zones 40 m deep. At the peak of the last glaciation (18,000 years B.P.) and probably earlier in the Pleistocene, the lowering of the sea level may have created a land bridge between these islands (Borges, 1992; Eason & Ashmole, 1992). The presence of some endemic lava tube cave species on both islands (Eason & Ashmole, 1992; Borges & Oromı´, 1994) lends support to the hypothesis that the shallowest part of the channel between Pico and Faial formed a broad subaerial isthmus sometime during the last glaciation (Martins, 1993). We therefore also consider the age of the other, older island (Faial) as a predictor of the fauna present on Pico.
Based on lists of beetle species, it has been shown by several authors (Becker, 1975; Peck & Peck, 1990; Borges, 1992) that on some oceanic islands (e.g. Azores, Madeira, Canaries, Seychelles and Gala´pagos), predators are relatively better rep-resented than herbivores in terms of number of species. This pattern is also investigated on the three islands.
MATERIAL AND METHODS
The study area
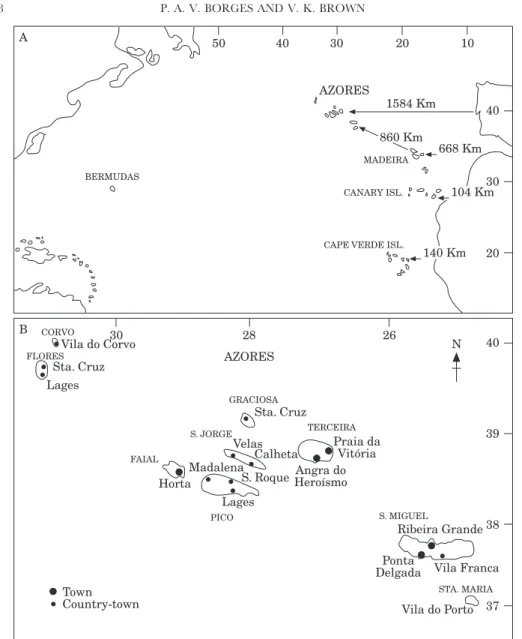
The Azorean archipelago is located in the North Atlantic, roughly between the coordinates 37° to 40° N latitude and 25° to 31° W longitude (Fig. 2). It is formed by nine main islands and some small islets aligned on a WNW-ESE trend which are fully oceanic, that is, they are totally volcanic islands of recent origin. Contrary to the Gala´pagos and Hawaiian archipelagoes, which are island chains formed from Hot Spots, the Azores were formed along spreading midoceanic ridges (Feraud, Kaneoka & Alle`gre, 1980; see Nunes & Forjaz, in press for further discussion on the geology of the islands).
The distance between the Azores and the mainland is about 1584 km, calculated from Cabo da Roca (the most westerly point of the European continent). The nine islands are divided into three groups: the occidental group of Corvo and Flores; the central group of Faial, Pico, Graciosa, Sa˜o Jorge and Terceira; and the oriental group of Sa˜o Miguel and Santa Maria, plus the Formigas islets (Fig. 2). The largest island is S. Miguel (757 km2
), and the smallest is Corvo (17 km2
). The distance between Corvo and Santa Maria, the islands farthest apart, is about 615 km. Corvo lies approximately equidistant between the Iberian Peninsula and Newfoundland.
The main characteristics of the three study islands are as follows: S. Maria
Geological Age: 8.12 Myr BP; Area: 97.18 km2; Altitude: 587 m, 0–300 m=86%,
26 B 30 28 AZORES 40 37 38 39 GRACIOSA CORVO Town Country-town FLORES Sta. Cruz Vila do Corvo Lages S. JORGE FAIAL Madalena Horta Velas S. Roque Sta. Cruz Calheta Lages PICO TERCEIRA Praia da Vitória Angra do Heroísmo S. MIGUEL Ribeira Grande STA. MARIA Vila do Porto Vila Franca Ponta Delgada N 20 A 50 40 40 20 30 BERMUDAS AZORES CANARY ISL.
CAPE VERDE ISL.
140 Km 104 Km 668 Km 860 Km 1584 Km MADEIRA 30 10
Figure 2. Map of the region, showing the Macaronesian region (A) and the nine islands of the Azores (B). In A, the distance of each Macaronesian archipelago from the nearest mainland is shown.
in Fontinhas (430 m). Max. in August, Min. in February; Rainfall: Max. in January– February, Min. in July. Airport (752 mm/year): 101 mm in January and 16 mm in July. Fontinhas (1386 mm/year): 181 mm in January and 45 mm in July. The island is divided into dry (west) and wet (east) parts by the Pico Alto (587 m).
S. Maria is located at the eastern and southern extreme of the archipelago and is undoubtedly the oldest of all the Azorean islands, with two distinct morphological areas: the western part (8.12 Myr BP as proposed by Abdel-Monem et al., 1975; 5.27 Myr BP as proposed by Feraud et al., 1984) is very flat with extensive wave cut platforms reaching altitudes of 250 m (Serralheiro & Madeira, 1993); the eastern part is more irregular and younger with the highest point reaching 587 m (Pico Alto). This is the only Azorean island with calcareous deposits of marine biological
origin, and taking into account the age of the fossil sediments, the island probably first rose from the sea about 20 Myr BP ago in the upper Miocene (Agostinho, 1937). Serralheiro & Madeira (1993) described in detail the geological evolution of S. Maria. The authors suggest that the last eruptive phase in the island took place during the interval −5 to −2 Myr BP (Feteiras Formation) and that the large amounts of ash emitted almost covered the island (Serralheiro & Madeira, 1993). However, unequivocally, this is the most volcanically stable Azorean island (Abdel-Monem et al., 1975; Queiroz, 1990; Martins, 1993), and, despite considerable debate on its age, the geological age given by Abdel-Monem et al. (1975) fits better the field conditions observed in the island (Serralheiro & Madeira, 1993). Therefore, for the present study, the age of 8.12 (±0.85) Myr BP proposed by Abdel-Monem et al. (1975) for the Anjos complex will be used as an estimate of the time S. Maria has been available for colonization and evolution. The last eruptive events that occurred in the island during the Pliocene probably led to the extinction of some fauna and flora, but in the absence of fossil remnants or mitochondrial DNA clock data, it is difficult to assess the age of the present biota.
Terceira
Geological Age: 0.300–2 Myr BP; Area: 402.2 km2; Altitude: 1023 m, 0–300 m=
55.62%, 300–800 m=42.5%; >800 m=1.9%; Temperature: average 17.5°C in the low altitudes. Max. in August, Min. in February; Rainfall: Max.: January–February, Min.: July. Angra do Heroı´smo (47 m): 969 mm/year (140 mm in January and 40 mm in July). Serra de S. Ba´rbara (1023 m): 3000 mm/year.
Terceira is a roundish (402 km2) island formed by four main volcanic complexes (Serra de Santa Ba´rbara, Serra do Moria˜o, Pico Alto and Serra do Cume) (Zbyszewski, Medeiros & Ferreira, 1971). The highest point (Serra de S. Ba´rbara, 1023 m) is also the most recent (0.025 Myr BP) of the three major island complexes (Martins, 1993). The eastern, flat part of the island is older, at about 2.0 Myr BP (Forjaz, 1986). Recent historical volcanic activity is evident in the western part of the island, where several well preserved lava tubes and volcanic chimneys are present (see Borges, Pereira & Silva, 1993). Pinheiro (1990) refers to the 21 eruptive events which occurred in the last 2000 years on the island. Some of the field sites are located near a scoria cone (Pico Gaspar) and a volcanic dome that erupted in 1761. We take the age proposed by Forjaz (1986) for the eastern part of the island (2.0 Myr BP) as the estimated geological age of the island.
Pico
Geological Age: 0.037–0.300 Myr BP; Area: 447.74 km2; Altitude: 2351 m, 0–300 m=
41.2%, 300–800 m=42.4%; >800 m=16.4%; Temperature: average 17.5°C in the low altitudes and average 11.5°C in the 1000 m. Max. in August, Min. in February; Rainfall: Max.: January–February, Min.: July. Madalena (50 m): 956 mm/year (128 mm in January and 26 mm in July). Lagoa do Capita˜o (795 m): 5075 mm/ year.
Pico is the most recent of all the Azorean islands. The island is dominated by a strato-volcano (Pico Mountain) 2351 m high. The island is covered by old and more recent lava flows with plenty of lava tubes and volcanic pits (Borges et al., 1993). Feraud et al. (1980) proposed an age of 37 000 years for Pico, but in a subsequent detailed volcano-tectonic study of the island, Chovellon (1982) gave an age of
c. 300 000 years to the oldest geological formations of the island (the eastern geological formations of Topo/Lajes Volcano). Evidence that the Topo/Lajes Volcano area is old also comes from the finding that most of the endemic beetles and spiders live in the mature Laurel forests in that area (Borges, 1992). Therefore, the age proposed by Chovellon (1982) (0.300 Myr BP) is taken as a conservative estimate of the time the island has been available for colonization and evolution.
Experimental design
The sample areas within the islands were cattle-grazed upland pastures of two different types: (a) recent sown pastures (3–4 years old) (=SP); (b) wet semi-natural old pastures (more than 35 years old) (=SNP). The major aim of having the two types of pasture was to detect ecological differences between improved highly productive pastures (originally sown with Trifolium repens L., Lolium perenne L. and other perennial grasses) and old semi-natural pastures. Two 900 m2
replicates of each type were selected in each island. The range of altitudes of the 12 field sites lays between 290 and 800 m (see Appendix 1 for more details). This design allows the 12 field sites (pastures) to be considered in any of three ways: (1) as 12 replicates of pasture (four in each island); (2) as six local habitats (two in each island) nested within the islands; (3) or as three islands, when considering the pool of different species contributed by the four sites from each island.
In all 12 pastures, an area of at least 900 m2
was fenced during January and February 1994 with posts and barbed wire. A preliminary sample was undertaken in March 1994 to assess the basic plant species composition. Rabbit fences were erected after this (in April 1994), to avoid differential rabbit grazing pressure. After the field sites were fenced, twenty 3 m×3 m plots were marked with coloured wood posts. Because of the different geometry of the main pastures, the 12 field sites were of two shapes: seven with a 5×4 configuration of plots and five with three rows of eight plots, with the last four being omitted from sampling. All 12 sites were selected after a careful examination of management regimes provided by the owners. All field sites were grazed regularly by dairy and beef cattle, thereby maintaining the traditional management of the sites (see Appendix 1). However, because of the sampling protocol, the number of grazing periods per year in the SP was lower than with usual management. The number of animals in the field sites of S. Maria was lower than on the other islands, but grazing periods were longer.
General sampling program
Islands were sampled with a constant quadrat size within each habitat. This is the preferred way of estimating the number of species on islands when testing the species-area models (Kelly et al., 1989; Tangney, Wilson & Mark, 1990; Holt, 1992, 1993; Hill, Curran & Foody, 1994; Kohn & Walsh, 1994). If the species-area equilibrium theory model fits the data, a given standard area should have more species on a large island than on a small island (Kohn & Walsh, 1994; Rosenzweig, 1995). This standard area has to be large enough to avoid sampling bias (see Kelly
et al., 1989). We used 900 m2, which is a much larger area than in earlier studies
two types of estimates of island species richness: (a) mean species richness per island within each habitat (=local richness), obtained by averaging the number of species in the two sites from each habitat within each island (equivalent to ‘alpha-diversity’); (b) total species per island (=regional richness), obtained by totalling all the different species found in the four sites of each island (equivalent to ‘gamma-diversity’).
All the sampling periods occurred at least three weeks after a grazing period, allowing regrowth of the vegetation. Three samples were taken during the first year (1994) in May–June (Spring), July–August (Summer), September–October (Autumn). In 1995, there was one sampling period: July–early September (Summer). For each, one method of sampling the vegetation (point-quadrat) and two methods for sampling arthropods (pitfall traps and suction) were used. Despite the limitations of pitfall trapping, there is no other method that combines a high level of accuracy with low operational costs (Southwood, 1978; Adis, 1979). The pitfall traps sampled nocturnal and large diurnal active epigean soil arthropods (e.g. large noctuid larvae, Diplopoda, Chilopoda, some large Heteroptera, wandering spiders, ground-beetles, rove-beetles, large Curculionoidea, etc.). Suction sampling, in contrast, is an ‘absolute’ method suitable for estimating abundance of vegetation-dwelling herbivores (e.g. Homoptera, Heteroptera, Thysanoptera, Chrysomeloidea and Curculionoidea and small Lep-idoptera larvae) and some predators (e.g. web-building spiders, small Staphylinidae). Results demonstrated that pitfall and suction sampling is largely complementary in determining species composition, and provides as complete a picture of the arthropod community as possible in the time (Borges & Brown, in prep.).
The sample data were enhanced by direct field observations of insect herbivores taken during the Spring (May–June) and Summer 1995, with equal additional sampling effort being applied to all plots. As a result, some species less prone to being sampled by pitfall and suction sampling were added to the species list (e.g. some Orthoptera and adult Lepidoptera).
Point-quadrat
A linear frame, with ten equally-spaced vertical 3.00 mm diameter point-quadrat pins, was used to survey plant species composition, abundance and structure (see Gibson et al., 1987). In each of the 20 plots, two frames were placed at random. The number of touches on each living plant species was recorded in 2 cm (below 10 cm) or 5 cm (10 cm and above) height intervals, to provide a measure of sward architecture, in addition to frequency and relative abundance. A total of 400 pins was used for each field site. As far as possible, sampling was undertaken on calm days, as the movement of grasses against the point quadrat pine made sampling difficult, and results potentially inaccurate.
Pitfall traps
Pitfall sampling took place over seven consecutive days in each of the 12 field sites. A set of 20 pitfall traps was used, and positioned according to the grid structure described above. Each trap was sunk into the ground, such that the rim was flush with the substrate. Traps were placed 30 cm in from each corner, one of the four traps being used for each sampling occasion. Pitfall traps comprised a plastic cup 110 mm in diameter and 70 mm deep. The killing preserving agent used was ethylene glycol (anti-freeze). Each trap was half-filled with the preservative and a little detergent (Teepol) added to lower the surface tension of the solution. Each trap was
protected against the rain by a white plastic cover fixed to the ground by three pieces of wire. Samples were stored in 70% ethanol with some drops of glycerol, prior to sorting.
Suction
A ‘Vortis’ suction apparatus (Burkhard Scientific Ltd., Rickmansworth, Hert-fordshire, England) was used. Sampling was carried out between 11.00 and 18.00, on warm, sunny days when the vegetation was dry. In each of the 20 plots in each field site, four random subsamples were taken, one in each corner of the 3×3 m square plots (a total area of 0.8 m2
). The collection nozzle was held in position for 30 seconds on each occasion. To simplify the sorting process, the four subsamples in a plot were taken successively without changing the collection vial. The samples were stored in 70% ethanol with glycerol prior to sorting.
Species sorting and identification
A field herbarium was established in order to have voucher specimens of all the plant species. Most of the species were confirmed by experts (see Acknowledgements). A total of 960 pitfall samples (20 pitfall traps×12 sites×4 sampling periods) and 960 suction samples (20 suction samples×12 sites×4 sampling periods) were taken during the course of the study. Sap-feeding and chewing herbivores and predators were selected for detailed treatment. For the guild assignment of each taxonomic group, we followed Moran & Southwood (1982) and Stork (1987). The taxonomic groups assigned to each guild in the suction and/or pitfall samples were as follows: (1) sap-feeders (for simplicity, referred to subsequently as suckers): Heteroptera (Tingidae, Miridae–Mirinae, Lygaeidae, Rhopalidae, Cydnidae and Pentatomidae), Homoptera (Cicadellidae, Delphacidae, Coccidae, Pseudococcidae, Aphididae), Thysanoptera;
(2) chewers: Diplopoda, Lepidoptera and Coleoptera (Carabidae, Dryopidae, Elater-idae, NitidulElater-idae, AnaspElater-idae, ChrysomelElater-idae, Rhynchophoridae and Curculionidae); (3) predators: Chilopoda, Pseudoscorpiones, Opiliones, Araneae, Heteroptera (Na-biidae, Miridae–Philinae and Anthocoridae), Thysanoptera (Aelothripidae), Neur-optera and ColeNeur-optera (Carabidae, Staphylinidae, Melyridae, Cucujidae and Coccinellidae).
Unlike many studies of food webs or based on faunal lists (e.g. Warren & Gaston, 1992; Rosenzweig, 1995; Wilson, 1996), predators do not include the parasitoids, herbivores do not include leaf-miners and gall-formers, and scavengers and fungivores are not considered.
Species were initially sorted into morphospecies, a common practice in biodiversity studies which does not compromise scientific accuracy (see Oliver & Beattie, 1996) and has some clear advantages when expertise in all taxonomic groups is not available (Gaston, 1996a). The morphospecies were identified by one of us (P. Borges) and subsequently sent to several taxonomists for species identification (see Acknowledgements). There were relatively few errors in the morphospecies defined and these were easily corrected by the taxonomic specialists (see Borges, 1997 for further discussion).
Data analysis Vegetation
Five presence/absence species data sets were created for the vascular plants (forbs, grasses, sedges, rushes and ferns) occurring in the 12 pasture sites, from point-quadrat pin and observational data. These five data sets were spring, summer and autumn 1994, summer 1995 and a pooled data set. The pooled data set comprises the four sampling periods and includes also information from Spring 1995.
Arthropod data set
Arthropod distributions for the 12 field sites were obtained from four complete field samples (spring, summer and autumn 1994 and summer 1995). The presence/ absence pooled matrix obtained was enhanced by direct field observations of insect herbivores during spring and summer 1995 (see above). In sum, the pooled data set was based on three different sampling methods, covering three seasons, in two different years.
Arthropods were classified to one of three colonization categories: natives, endemics and introduced. In cases of doubt, a species was assumed to be native. Native species arrived by long-distance dispersal to the Azores and are also known in other archipelagoes and on the continental mainland. Endemic species are those that occur only in the Azores, as a result of either speciation events (neo-endemics) or extinction of the mainland populations (palaeo-endemics). Indigenous refers to natives and endemics. Introduced species are those believed to be in the archipelago as a result of human activities, some of them being cosmopolitan species.
Sucking and chewing herbivores, total herbivore species (suckers+chewers), spiders, total predatory species (including the spiders) and total arthropod species (herbivores+predators) were selected as study groups. Some species of Heteroptera, Thysanoptera and Carabidae have both predatory and phytophagous feeding habits and therefore were included in the two major assemblages.
Statistical analysis
Obviously, the islands cannot be replicated. The experimental design is a split-plot design. GLIM (Generalized Linear Interactive Modelling) nested analysis of variance was used (see Crawley, 1993) to investigate whether the two habitats (sown and semi-natural pastures) differed in species richness, or if there was only a difference between islands. For a given arthropod species group, if an island effect was found to occur rather than a habitat effect, the four sites from each island were used to estimate the mean number of species per island.
In the ordinary linear least-squares (OLS) regression analysis, three groups of species were used as dependent variables: total species=introduced+native+endemic species; indigenous species=native+endemic species; and true endemics. Several geo-graphical variables are commonly used as explanatory variables in ecological and biogeographical work, these include: area of the islands and distance from the nearest mainland, because they are important factors in the equilibrium model of island biogeography; altitude, because maximum elevation is commonly used as a surrogate for ecological diversity; and finally, geological age which was the main factor to be tested.
T 1. Number of species of forbs (F), grasses (G), sedges (S), rushes (R) and ferns (Fr) found in sown and semi-natural pastures in the three islands studied
Sown Semi-natural
F G S R Fr F G S R Fr
S. Maria 53 21 4 0 0 30 20 5 1 2
Terceira 21 14 2 0 0 23 10 3 2 3
Pico 20 12 6 3 1 26 10 5 2 5
All islands combined 61 26 7 3 1 49 22 9 3 5
several reasons: (a) to overcome non-constant variance, and non-linearity of the data; (b) because higher r2
values were consistently obtained when using the log-log model; (c) the residuals appeared to show no pronounced patterns in the log-log model.
All regressions were performed on island species richness means and on ‘gamma-diversities’. As only three points are available with few degrees of freedom, the results are mainly interpreted in terms of trends, rather than significance levels or r2 values. When testing the area and altitude hypotheses, total species was used as the dependent variable. When isolation and geological age hypotheses were tested, only the indigenous and endemic species were used as dependent variables, the reason being that introduced species are a result of recent human activities and therefore their species richness cannot possibly be explained by island isolation or age.
In the predator/herbivore species ratio analysis, the proportion of predators was arcsin transformed. As neither the predators nor the herbivores can be considered as being the obvious independent variable (Warren & Gaston, 1992), a correlation analysis was chosen to study their species richness relationship. As no information is available on the error structure of both variables, a non-parametric test was used (Spearman’s rank correlation).
The OLS regression and correlation statistics were performed using the STAT-VIEW (Version 4.0) Macintosh statistical package.
RESULTS
Species composition Vascular plants
The 12 field sites contained 117 different species of vascular plants (71 forbs, 27 grasses, 11 sedges, 3 rushes and 5 ferns), belonging to 31 families. Ninety-eight different species of vascular plants were found in SP and 88 in SNP. In S. Maria, more species were found in SP than SNP (78 and 58 respectively), while slightly more species were found in SNP in Terceira (SP=37; SNP=41) and Pico (SP= 42; SNP=48) (Table 1). Twenty-seven species were found exclusively in SP (24 in S. Maria, 5 in Terceira and 2 in Pico) and 16 species only were found in SNP (5 in S. Maria, 7 in Terceira and 16 in Pico).
From the 113 species where colonization status is known, eight (7%) (5 forbs, 1 grass, 1 rush and 1 fern) are Azorean endemics (2 species in S. Maria, 4 in Terceira and 6 in Pico) (see Table 2); 31 (27%) (21 forbs, 2 grasses, 3 sedges, 1 rush
T 2. Number of species of forbs, grasses, sedges, rushes and ferns from the three main colonization categories (endemic, native, introduced) in the three islands studied
Forbs Grasses Sedges Rushes Ferns Total
S. Maria endemic 2 0 0 0 0 2 native 11 1 3 0 2 17 introduced 40 22 3 1 0 66 Terceira endemic 1 1 0 1 1 4 native 12 1 4 1 2 20 introduced 16 14 1 0 0 31 Pico endemic 3 1 0 1 1 6 native 10 2 6 1 4 23 introduced 17 10 0 1 0 28
and 4 ferns) are native to the Azores (17 in S. Maria, 20 in Terceira and 23 in Pico) (see Table 2); and 74 (65%) (42 forbs, 24 grasses, 7 sedges and 1 rush) are considered human introductions to the archipelago (66 in S. Maria, 31 in Terceira and 28 in Pico) (see Table 2). Most of the endemic and native species are forbs, sedges, rushes and ferns. The Compositae (=Asteraceae) and Gramineae (=Poaceae) are almost exclusively made up of introduced species. The average ratio of native/ introduced species is 0.28 for sites from S. Maria (0.25 in SP; 0.3 in SNP), 0.55 in Terceira (0.2 in SP; 0.9 in SNP), and 0.88 in Pico (0.65 in SP; 1.1 in SNP). Arthropods
Two hundred and thirty-seven arthropod species (128 herbivores and 117 pred-ators) were sampled by means of pitfall, suction and direct observation. Table 3 summarizes the pooled data set. It shows that the species richness of most taxa at a local scale, a habitat scale and an island scale is highest on S. Maria and lowest on Pico. Species richness is always intermediate on Terceira. The same pattern was obtained using the total number of species or indigenous species only (values in parenthesis in Table 3).
The numbers of introduced species were: S. Maria=83 spp. (44%); Terceira= 54 spp. (43%); Pico=38 spp. (43%). The number and proportion of endemic species in relation to indigenous species were: S. Maria=18 spp. (17%); Terceira=10 spp. (14%); Pico=5 spp. (10%). Several arthropod species were new records for the Azores or individual islands. In summary, 22 species were previously unknown from the islands, five being considered endemic (4 from S. Maria and 1 from Terceira). These are currently being described. Sixty-two species were new records for S. Maria, 21 for Terceira and 28 for Pico. S. Maria and Pico have been surveyed less intensively than Terceira (see Borges, 1992), so the high number of new records is not surprising. All such data will be the subject of a detailed taxonomic and biogeographic study to be published elsewhere (Borges et al., in preparation).
Herbivore and plant species richness patterns
There was a significant island effect on total vascular plant species richness (F8,12=4.77, P<0.01) and on total herbivorous species richness (F8,12 = 19.59,
T 3. The total numbers and the indigenous numbers (between brackets) of species of herbivores and p redators per field site, habitat and island S. Maria Terceira Pico Sown Semi-natural Sown Semi-natural Sown Semi-natural Taxa 1.1 1.2 2.1 2.2 3.1 3.2 4.1 4.2 5.1 5.2 6.1 6.2 Diplopoda 4 (1) 3 (1) 4 (1) 4 (1) 1 3 (1) 1 1 2 (1) 2 (1) 1 1 Orthoptera 1 (1) 2 (2) 1 (1) 2 (2) 1 (1) 1 (1) 0 (0) 1 (1) 1 (1) 1 (1) 1 (1) 1 (1) Heteroptera 8 (7) 6 (5) 5 (5) 7 (4) 3 (3) 3 (2) 2 (2) 5 (5) 2 (2) 2 (2) 1 (1) 1 (1) Homoptera, C icadellidae 4 (2) 2 4 (2) 3 (1) 4 (2) 3 (1) 2 (1) 3 (2) 2 (1) 1 1 1 Homoptera, D elphacidae 6 (6) 4 (4) 5 (5) 5 (5) 2 (2) 2 (2) 3 (3) 2 (2) 2 (2) 3 (3) 2 (2) 3 (3) Homoptera, S ternorrhyncha 1 2 (7) 9 (7) 12 (6) 1 1 (7) 4 (1) 5 (2) 5 (1) 7 (2) 6 (2) 4 (1) 5 (2) 5 (2) Thysanoptera 6 (2) 6 (4) 7 (3) 6 (2) 3 (1) 2 (1) 1 (1) 1 (1) 1 (1) 2 (2) 1 (1) 2 (2) Lepidoptera 17 (9) 1 2 (4) 18 (10) 20 (11) 11 (5) 1 4 (8) 7 (4) 10 (6) 8 (4) 7 (5) 1 0 (5) 7 (4) Coleoptera, Chrysomelidae 2 3 (1) 3 (1) 1 3 (1) 3 (1) 2 2 1 (1) 2 (1) 2 (1) 1 (1) Coleoptera, Curculionidae 3 (1) 3 (2) 3 (1) 5 (2) 3 2 3 (1) 3 2 3 1 3 Coleoptera (Other) 10 (4) 8 (3) 5 (1) 7 (3) 5 (1) 6 (2) 1 2 (1) 1 1 2 0 Total per fi eld site = 73 (40) 58 (33) 67 (36) 71 (38) 40 (18) 44 (22) 27 (13) 37 (19) 28 (15) 28 (16) 27 (13) 25 (14) Total per habitat = 88 (51) 86 (47) 51 (25) 40 (22) 36 (20) 33 (16) Total per island = 104 (57) 67 (36) 43 (23) Chilopoda 2 3 (1) 1 (1) 1 3 (1) 1 4 (3) 3 (2) 3 (3) 1 (1) 2 (2) 2 (2) Pseudoscorpiones 0 0 0 0 0 0 0 0 0 0 1 (1) 0 Opiliones 1 (1) 1 (1) 1 (1) 1 (1) 1 2 (1) 1 1 0 0 0 0 Araneae 2 1 (15) 23 (13) 19 (15) 19 (13) 16 (9) 1 5 (9) 16 (11) 16 (9) 1 3 (9) 13 (9) 1 2 (8) 11 (8) Heteroptera 2 (2) 4 (4) 1 (1) 2 (2) 2 (2) 1 (1) 2 (2) 2 (2) 2 (2) 3 (3) 2 (2) 2 (2) Thysanoptera 1 1 1 1 1 0 0 0 0 0 0 0 Neuroptera 1 (1) 1 (1) 0 2 (2) 1 (1) 1 (1) 0 0 0 0 0 0 Coleoptera, C arabidae 9 (1) 5 (1) 6 (1) 7 (2) 7 (1) 7 (1) 3 3 (1) 4 (1) 4 (1) 4 (1) 3 (1) Coleoptera, S taphylinidae 17 (7) 1 4 (5) 13 (5) 1 7 (9) 13 (6) 1 2 (6) 11 (5) 1 4 (8) 10 (5) 1 4 (7) 11 (6) 1 5 (9) Coleoptera (Others) 4 (2) 4 (2) 2 (1) 3 (3) 2 (1) 2 (2) 0 0 0 0 0 0 Total per fi eld site = 58 (29) 56 (28) 44 (25) 53 (32) 46 (21) 41 (22) 37 (22) 39 (23) 32 (20) 35 (22) 32 (20) 33 (22) Total per habitat = 71 (37) 68 (41) 52 (26) 47 (27) 41 (25) 38 (24) Total per island = 91 (50) 63 (37) 48 (29) HERB. + PRED. (Field sites) 125 (68) 110 (60) 107 (61) 121 (70) 82 (38) 83 (44) 63 (34) 75 (41) 58 (34) 60 (36) 57 (32) 57 (35) Total per habitat = 153 (87) 150 (88) 99 (50) 86 (48) 74 (43) 69 (39) Total per island = 189 (106) 125 (71) 88 (50)
1.60 1.6 1.0 1.40 1.4 1.2 1.50 1.55 B 1.3 1.1 1.45 1.70 1.9 1.3 1.50 1.8 1.6 1.60 1.65 D 1.7 1.5 1.55 1.5 1.7 1.6 1.0 1.2 1.4 1.2 1.4 1.5 A 1.6 1.3 1.1 1.3 1.9 1.9 1.4 1.4 1.8 1.6 1.6 1.7 C 1.8 1.7 1.5 1.5 log (no . of herbivore species) 1.5
log (no. of plant species) 1.4 2 ×
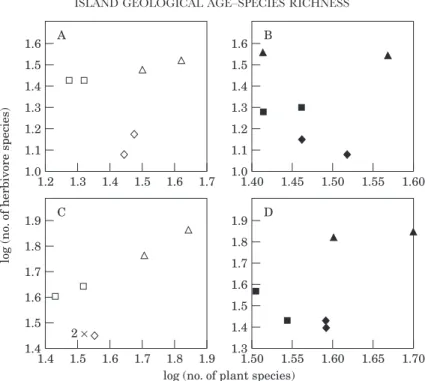
Figure 3. Relationship between the logarithm of total herbivore species richness and the logarithm of total plant species richness of sown pastures (open symbols) and semi-natural pastures (filled symbols) in three Azorean islands: S. Maria (triangles), Terceira (squares) and Pico (diamonds). None of the relationships is statistically significant at P=0.05, and only the Summer 1994 (A, B) and the pooled data (C, D) are shown as examples.
P< 0.001). On average, sites from S. Maria and Pico had more species of vascular plants than Terceira. Herbivore species richness was highest in S. Maria followed by Terceira and finally Pico.
The local species richness of assemblages of arthropod herbivores was regressed against the corresponding plant species richness. Figure 3 shows that there is no relationship between the total number of herbivorous arthropod species and total vascular plant species richness in the two pasture habitats. On the four sampling occasions and in the pooled data, all regressions were also non-significant at P= 0.05.
Island or habitat effect?
Before investigating the factors that may be shaping species richness patterns at the regional scale, a nested ANOVA was performed on the alpha diversities of 15 groups of species and on the ratio of predator/herbivore species richness (Table 4). With few exceptions (see below), the results clearly show an island effect, that is, the average number of species in each habitat was more similar within an island than between the islands. Regional processes appear to be shaping the number of arthropod species found in the 12 field sites of sown and semi-natural pasture. No significant island or habitat effects were found for the indigenous chewers (Table 4d) or the ratio predatory/herbivorous indigenous species (Table 4q).
T 4. Nested ANOVA for 15 groups of species and the ratio predators/herbivores
Source Islands Habitats within islands
Taxa F Signif. F Signif.
(a) Suckers (all species) 428.54 ∗∗∗ 0.12 n.s.
(b) Suckers (indigenous) 109.50 ∗∗ 0.71 n.s.
(c) Chewers (all species) 11.80 ∗ 3.33 n.s.
(d) Chewers (indigenous) 7.82 n.s. 2.11 n.s.
(e) Herbivores (all species) 45.36 ∗∗ 1.29 n.s.
(f ) Herbivores (indigenous) 84.81 ∗∗ 0.76 n.s.
(g) Herbivores (endemics) 10.65 ∗ 3.40 n.s.
(h) Spiders (all species) 17.90 ∗ 7.67 ∗
(i) Spiders (indigenous) 51.50 ∗∗ 0.67 n.s.
( j) Predators (all species) 11.48 ∗ 3.34 n.s.
(k) Predators (indigenous) 199.05 ∗∗∗ 0.07 n.s.
(l) Predators (endemics) 22.17 ∗ 3.00 n.s.
(m) Herb.+Pred. (all species) 52.90 ∗∗ 1.39 n.s.
(n) Herb.+Pred. (indigenous) 191.73 ∗∗∗ 0.28 n.s.
(o) Herb.+Pred. (endemics) 35.72 ∗∗ 2.43 n.s.
(p) Ratio Pred./Herb. (all species) 9.70 ∗ 1.21 n.s.
(q) Ratio Pred./Herb. (indigenous) 8.38 n.s. 2.36 n.s.
n.s.=not significant; ∗P<0.05; ∗∗P<0.01; ∗∗∗P<0.001.
T 5. Correlations among the explanatory variables. The lower triangle was obtained using log-transformed variables and the upper triangle using untransformed data.∗P<0.05; ∗∗P<0.01; ∗∗∗P<0.001. GA=geological age of the islands; AREA=area of the island; DML=distance from the nearest mainland; MAI=maximum altitude of the islands
GA AREA DML MAI
GA 1.00 −0.99∗∗∗ −0.99∗∗∗ −0.83∗∗∗
AREA −0.84∗∗∗ 1.00 0.96∗∗∗ 0.75∗∗
DML −0.96∗∗∗ 0.96∗∗∗ 1.00 0.90∗∗∗
MAI −1.00∗∗∗ 0.84∗∗∗ 0.96∗∗∗ 1.00
For the total species richness of spiders (introduced+native+endemic species), in addition to an island effect, habitat type also affected the number of species found in the four sites of each island (F3,6=7.66, P<0.05) (Table 4h). Nevertheless, there is evidence that habitat plays only a minor role in shaping the number of arthropod species found within each island. Therefore, in the following analyses, habitats are not analysed separately.
The role of geographical variables:
area, distance from mainland, altitude and geological age
The main geographical variables are highly intercorrelated (Table 5). Geological age is highly negatively correlated with all the other variables, and is a consequence of two factors: (a) the oldest island (S. Maria) is also the smallest, with the lowest maximum altitude and the nearest to the mainland; (b) the most recent island (Pico) is also the largest, having the highest elevation and is farthest from the nearest mainland. All the other geographical variables are highly positively intercorrelated. Log-transformation altered the correlation coefficients slightly, but did not change the basic patterns of correlation. This high autocorrelation between the explanatory
1.6 1.0 1.2 D 2.3 1.7 2.1 1.9 F 1.8 1.0 1.6 1.2 B 1.4 1.4 2.2 1.2 1.8 1.4 C log (no . of species) 2.8 2.0 1.4 1.8 1.8 1.6 2.0 2.2 2.6 E 1.8 0.8 1.4 1.0 A 2.0 1.6 1.6 1.2 log (area in sq. km) 2.4 1.8 2.0 2.2 2.4 2.6 2.8 2.8 1.8 2.0 2.2 2.4 2.6 1.8 2.0 2.2 2.4 2.6 2.8 2.8 1.8 2.0 2.2 2.4 2.6 1.8 2.0 2.2 2.4 2.6 2.8
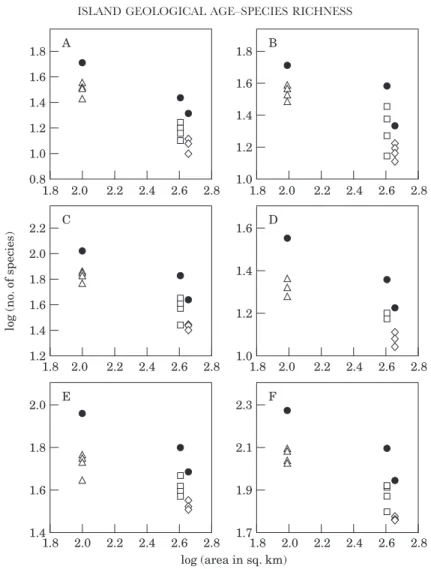
Figure 4. The relationship between the logarithm of total number of species of: (A) sucking insects, (B) chewing insects, (C) herbivorous arthropods, (D) spiders, (E) predatory arthropods, (F) all species combined and the logarithm of area of the three islands: S. Maria (triangles), Terceira (squares) and Pico (diamonds). Field sites are represented by open symbols and the filled circle gives the cumulative number of different species found in the four sites of each island (‘gamma-diversity’). See text for further details.
variables imposes difficulties in the interpretation of the contribution of individual variables in a multiple regression analysis. Thus, the effect of each one was analysed individually, following the models presented in Figure 1.
Area
The two larger islands (Terceira and Pico) have very similar areas, while the smallest island (S. Maria) is one quarter the size of the other two islands. Therefore, if an area-effect does occur, Pico and Terceira would be expected to have a similar number of species, both at the local and regional scale, and to support a greater number of species than S. Maria. However, the results are the reverse of these predictions (Fig. 4). In fact, the largest numbers of suckers, chewers, herbivores,
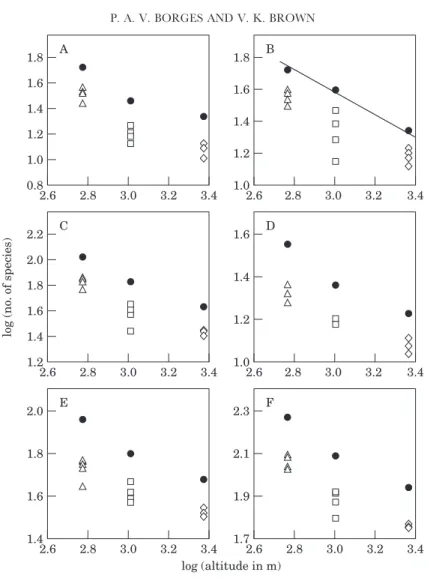
3.4 1.6 1.0 2.6 1.2 2.8 3.0 3.2 D 3.4 2.3 1.7 2.6 2.1 1.9 2.8 3.0 3.2 F 3.4 1.8 1.0 2.6 1.6 1.2 2.8 3.0 3.2 B 1.4 1.4 3.4 2.2 1.2 2.6 1.8 1.4 2.8 3.0 3.2 C log (no . of species) 3.4 2.0 1.4 2.6 1.8 1.6 2.8 3.0 3.2 E 3.4 1.8 0.8 2.6 1.4 1.0 2.8 3.0 3.2 A 2.0 1.6 1.6 1.2 log (altitude in m)
Figure 5. The relationship between the logarithm of total number of species of: (A) sucking insects, (B) chewing insects, (C) herbivorous arthropods, (D) spiders, (E) predatory arthropods, (F) all species combined and the logarithm of maximum altitude of the three islands. Regression line indicates a significant linear relationship at P=0.05. Symbols as in Fig. 4.
spiders, predators and the groups combined were found on the smallest island. None of the fitted regressions are statistically significant (see Appendix 2).
Altitude
From Figure 1, we predicted that Pico, with the highest elevation in the archipelago, would have more habitat diversification, and therefore more species. The results show the opposite trend, that is, a negative relationship between arthropod total species richness and the maximum altitude of each island (Fig. 5). Diversity was greater on the island with the lowest maximum altitude (S. Maria) and decreased with increasing altitude. A statistically significant negative relationship was obtained only between the regional diversity of chewing arthropods and the maximum altitude of the islands (log y=3.47−0.63 log x; r2=0.995; P=0.05) (Fig. 5B).
1.8 1.0 1.4 C log (no . of species) 1.6 1.2 1.4 0.8 1.2 1.0 D 1.8 1.2 1.6 1.4 E 2.2 1.4 1.8 F 2.0 1.6 1.6 0.6 1.4 1.0 A 1.2 0.8 1.4 0.6 1.0 B 1.2 0.8 3.28 3.18
log (distance from the nearest mainland in km)
3.20 3.22 3.24 3.26 3.18 3.20 3.22 3.24 3.26 3.28
3.28
3.18 3.20 3.22 3.24 3.26 3.18 3.20 3.22 3.24 3.26 3.28
3.28
3.18 3.20 3.22 3.24 3.26 3.18 3.20 3.22 3.24 3.26 3.28
Figure 6. The relationship between the logarithm of the indigenous number of species of: (A) sucking insects, (B) chewing insects, (C) herbivorous arthropods, (D) spiders, (E) predatory arthropods, (F) all species combined and the logarithm of the distance from the nearest mainland for the three islands. Regression line indicates a significant linear relationshiop at P=0.05. Symbols as in Fig. 4.
Distance
Isolated islands are expected to have depauperate faunas. The results are consistent with this hypothesis (Fig. 6). Within these overall trends, only the average number of local species of indigenous chewing arthropods is significantly negatively correlated with distance (log y=17.7−0.52 log x; r2=0.999, P<0.02) (Fig. 6B).
Geological age
Older islands should have more species because they have been available for colonization and speciation longer than recent islands. The results are consistent
7.0 1.8 1.0 5.0 1.4 6.5 5.5 C log (no . of species) 6.0 1.6 1.2 7.0 1.4 0.8 5.0 1.2 1.0 6.5 5.5 D 6.0 7.0 1.8 1.2 5.0 1.6 1.4 6.5 5.5 E 6.0 7.0 2.2 1.4 5.0 1.8 6.5 5.5 F 6.0 2.0 1.6
log (geological age in Myr) 7.0 1.6 0.6 5.0 1.4 1.0 6.5 5.5 A 6.0 1.2 0.8 7.0 1.4 0.6 5.0 1.0 6.5 5.5 B 6.0 1.2 0.8
Figure 7. The relationship between the logarithm of the indigenous number of species of: (A) sucking insects, (B) chewing insects, (C) herbivorous arthropods, (D) spiders, (E) predatory arthropods, (F) all species combined and the logarithm of the geological age of the three islands. Regression line indicates a significant linear relationship at P=0.05. Symbols as in Fig. 4.
with this prediction, both at the local and regional scale (Fig. 7A–F). However, only one regression is statistically significant: indigenous herbivore species (chewers+suckers) gamma-diversity (log y=−0.14+0.27 log x; r2=0.99, P=0.05) (Fig. 7C).
Another interesting pattern shown by the herbivores (Fig. 7C), predators (Fig. 7E) and all species combined (Fig. 7F) is a near linear increase in regional richness with the geological age of the islands, but an apparently more curvilinear increase at the local scale. The pattern, if real, implies a higher beta-diversity for the indigenous species of Terceira, the middle-aized island.
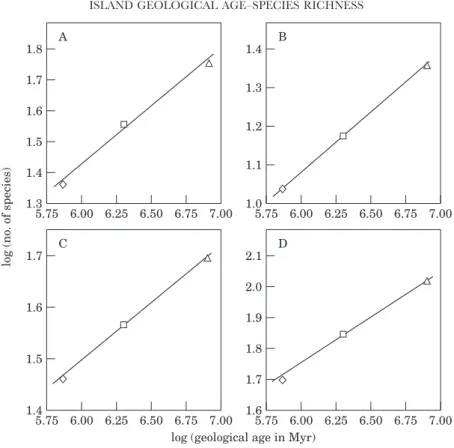
Even more interesting are the results presented in Figure 8, where the geological age of the recent island was replaced by the geological age of its nearest and probably sister older island (Faial), to which Pico was joined at the peak of the last glaciation (see above). Strong positive correlations were obtained between the gamma-diversities
7.00 1.7 1.4 5.75 1.6 6.00 6.25 6.75 C 6.50 1.5 7.00 2.1 1.6 5.75 1.9 6.00 6.25 6.75 D 6.50 1.7 7.00 1.8 1.3 5.75 1.7 6.00 6.25 6.75 A 6.50 1.5 7.00 1.4 1.0 5.75 1.3 6.00 6.25 6.75 B 6.50 1.1 log (no . of species)
log (geological age in Myr) 2.0
1.8 1.2 1.6
1.4
Figure 8. Linear regressions between the logarithm of ‘gamma-diversity’ of: (A) indigenous species of herbivorous arthropods, (B) spiders, (C) predatory arthropods, (D) all species combined and the logarithm of geological age of the three islands: S. Maria (triangles), Terceira (squares) and Pico-Faial (diamonds). In this figure, the geological age of Pico is given by the geological age of its nearest ‘sister’ island Faial (see text). Regression lines indicate a significant linear relationship at P=0.05. See text for further details.
of indigenous herbivores (log y=−0.82+0.37 log x; r2=0.99, P=0.05) (Fig. 8A), indigenous spiders (log y=−0.75+0.31 log x; r2=1, P=0.0016) (Fig. 8B), indigenous predators (log y=−0.14+0.23 log x; r2=0.999, P=0.02) (Fig. 8C) and all indigenous species combined (log y=−0.11+0.31 log x; r2=0.997, P=0.04) (Fig. 8D) and the geological age of the islands. Therefore, at least at the regional scale, there is some evidence that the geological age of the three islands is a good predictor of the number of species for some groups of pasture indigenous arthropods.
Endemic species
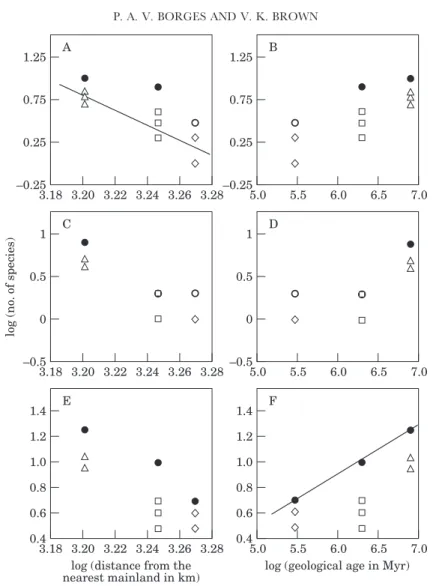
In Figure 9, the numbers of endemic species at local and regional scales are plotted against distance from the nearest mainland and geological age of the islands. More isolated islands usually have more endemic species and the same is thought to occur with older islands (see Introduction). The results are only consistent with the geological age hypothesis. In fact, B, D and F in Figure 9 show that there is a clear tendency for a positive relationship between endemic species richness and geological age of the islands. However, the relationship is only statistically significant for the all species combined (herbivores+predators) at a regional scale (log y=
3.28 1 –0.5 3.18 0.5 3.20 3.22 3.26 C 3.24 0 7.0 5.0 5.5 6.0 6.5 D 3.28 1.4 0.4 3.18
log (distance from the nearest mainland in km) 1.2 0.8 3.20 3.22 3.26 E 3.24 1.0 0.6 7.0 5.0 5.5 6.0 6.5
log (geological age in Myr) F 3.28 1.25 –0.25 3.18 0.75 3.20 3.22 3.26 A log (no . of species) 3.24 0.25 7.0 5.0 5.5 6.0 6.5 B 1 –0.5 0.5 0 1.4 0.4 1.2 0.8 1.0 0.6 1.25 –0.25 0.75 0.25
Figure 9. The relationship between the logarithm of the total endemic species of herbivorous arthropods (A, B), total predatory species (C, D), all species combined (E, F) against the logarithm of the distance from the nearest mainland (A, C, E) or the logarithm of geological age (B, D, F) of the three islands. Regression lines indicate a significant linear relationship at P=0.05. Symbols as in Fig. 4.
−1.43+0.39 log x; r2=0.998, P=0.02) (Fig. 9F). There is also a significant negative relationship between average endemic herbivore species richness per site and isolation (log y=21.92−6.61 log x; r2=0.997, P=0.03) (Fig. 9A). This result shows that, contrary to expectations, more isolated islands have fewer endemic species, probably because they are also the younger islands. Also surprising is the high beta-diversity in the endemic species found in Terceira, with each local site contributing different species to the regional pool.
Predator/herbivore species ratio
For all species, and for indigenous species, the number of species of predators in the two habitats exceeds the number of species of herbivores on the two recent
1.4 0.0 Ratio pred./herb . PIC 1.0 0.6 0.2 1.2 0.8 0.4 STM TER A 1.75 0.00 PIC 1.25 0.75 0.25 1.50 1.00 0.50 STM TER B Islands
Figure 10. Average (±SE) of the ratio of number of species of predatory arthropods/number of species of herbivorous arthropods in sown (Φ) and semi-natural pastures (Ε) in three islands: STM= S. Maria, TER=Terceira; PIC=Pico. A, all species; B, indigenous species.
1.9 45
20 1.5
log (total no. of species)
arcsin (prop . predator spp .) 40 35 30 25 1.6 1.7 1.8
Figure 11. Relationship between the proportion of indigenous predatory species (arcsin transformed) and the logarithm of the total indigenous species at the local scale. Symbols for sites as in previous figures.
islands, Terceira and Pico (Fig. 10A and B). However, a statistically significant island effect of the ratio of the number of species in the two guilds was found only when all the species were taken in consideration (see Table 4p). For the indigenous species, only a marginal island effect was obtained (F2,3=8.46, 0.05<P<0.1). No habitat effect was found in either group of species (Table 4p, q). There is also a significant tendency for large communities to have lower proportions of indigenous predators (arcsin y=1.78−0.73 log x; r2=0.88, P= 0.0001) (Fig. 11). Therefore, at sites on the older island, a greater proportion of indigenous herbivore species is usually found, suggesting that herbivore richness increases slightly faster than predator richness in the communities studied. The mean predator/herbivore ratio for S. Maria is 0.78 (SE=±0.039), for Terceira 1.27 (SE=±0.15) and for Pico 1.45 (SE= ±0.06). The indigenous predator and herbivore species numbers are proportional at the twelve sites (rs=0.83, P=0.006), which also suggests some constancy in com-munity structure.
Isolation and the geological age of the islands may also influence the predator-herbivore species richness ratio. The mean local proportion of predators increases
7.0 45
20 5.0
log (geological age in Myr) 40 35 30 25 5.5 6.0 6.5 B 3.28 45 20 3.18
log (distance from the nearest mainland in km) 40 35 30 25 3.20 3.26 A
arcsin (proportion of predatory species)
3.22 3.24
Figure 12. Relationship between the proportion of indigenous predatory species (arcsin transformed) and the logarithm of the distance from (A) the nearest mainland and (B) the logarithm of geological age. Symbols for sites as in previous figures. The proportion for ‘gamma-diversities’ are given by the large open circle. In (A) the line goes through the average of local proportions of predators, and in (B) the line goes through the proportion of ‘gamma-diversities’.
linearly with island isolation (arcsin y=−9.09+2.99 log x; r2=1, P=0.012) (Fig. 12A), and the regional proportion of predators decreases linearly with island age (arcsin y=+1.11−0.089 log x; r2=0.999, P=0.016) (Fig. 12B).
DISCUSSION
The overall percentage (34%) of indigenous (native+endemic) vascular plant species found at the 12 study sites is consistent with the overall pattern found in the archipelago, where only one third of the species are considered to be indigenous from the Azores (see Hansen, 1988; Dias, 1996). However, when the islands are analysed individually, the patterns differ: endemic and native species are better represented in the field sites from Terceira and Pico and most of the species found in the sites from S. Maria (78%) (cf. 56% in Terceira; 49% in Pico) are human post-colonization introductions. The small island of S. Maria has been heavily impacted by people, no doubt resulting in this very high proportion of non-native plant species. Moreover, the drier and more seasonal climate of S. Maria also favours colonization by introduced annual and/or ruderal plants.
islands than in arthropod species composition. For the arthropods, the proportions of introduced species are lower overall, and quite similar among the three islands. Thus, habitat destruction through land clearance, which is more evident in S. Maria, is not reflected in the arthropod species richness of the study sites on this island. In fact, when analysing the independent effects of habitat and island at the sites (local) scale, through a nested ANOVA, the results showed that, for most arthropod groups, recently sown pastures supported as many species as old semi-natural pastures.
These results are not in complete agreement with other work relating plant and insect diversity. Most previous studies (see review in Gaston, 1996b) show a correlation between plant species richness and phytophagous insect species richness, which is not the case in the current study. It appears that the poor correlation between plant and insect species richness emerges as a consequence of a depauperate herbivorous arthropod fauna in Pico and in the semi-natural pastures of Terceira (see Table 3). That is, local diversity in these systems may be strongly influenced by the size of the regional pool (Cornell & Lawton, 1992; Cornell, 1993), signifying that regional factors are of overwhelming importance in structuring local insect species richness (Ricklefs & Schluter, 1993).
Because of the high degree of covariance between area, maximum altitude, geological age and distance from the nearest mainland, it was not possible to separate the individual contributions of these variables through a multiple regression analysis. Consequently, each variable was tested independently to search for patterns in species richness, consistent with the predictions of each model (Fig. 1). Of the main hypotheses used to explain species richness, we used our extensive data set to test four.
Species-area hypothesis. The largest island did not have more species in sown or semi-natural pastures, either at the local or regional scale. As a result, the species-area hypothesis (see revision in Hart & Horwitz, 1991; Hill et al., 1994) is not supported for these assemblages.
Species-altitude hypothesis. Island elevation is considered to be one possible measure of habitat and ecological diversity (Buckley, 1982) and may also promote endemicity (Adler, 1994). However, there is no available study that shows that higher maximum altitude equates to more habitat types on these islands (see Borges, 1992). Contrary to expectation, a negative relationship was found between maximum elevation of the islands and species richness. Decreasing faunal diversity with increasing altitude due to increasingly harsh, variable and unpredictable environments at higher altitudes has been shown to occur in several communities (e.g. Lawton, MacGarvin & Heads, 1987; Fernandes & Price, 1992; see also reviews in McCoy, 1990 and Rahbek, 1995). However, it was shown elsewhere (see Borges, 1997) that temperatures and precipitation at the Terceira and Pico high altitude sites were very similar during this study. Moreover, in S. Maria, the sites located at the highest altitude (semi-natural pastures) were not particularly poor in species. Thus, the ‘harsh environment hypothesis’ is not a convincing explanation for these results, while the ‘altitude-hypothesis’ itself does not explain the species richness of these pasture arthropods. Distance hypothesis. Although a negative trend was found between indigenous species richness and the distance of each island to the nearest mainland, the result is probably largely an artefact. In fact, mainland-island distances in the present system are so large (more than 1400 km), relative to the dispersal abilities of the biota, that inter-island dispersal is likely to be much more important than island-mainland
dispersal (see Kobayashi, 1983 and Harvey, 1994). The three islands emerged sequentially in time and space, the oldest being located near the mainland and the most recent furthest away. Moreover, the more isolated and recent islands (Terceira and Pico) are close together in the Azorean Central Group and have a similar arthropod species composition (see Borges, 1997). The species composition of Terceira also appears to be a subset of the fauna of the less isolated old island (S. Maria). The results obtained here, together with the ‘nested’ species composition patterns, support the hypothesis that the colonization in the three islands followed a colonization sequence from the nearest, old island to the more isolated recent islands. Terceira was probably colonized through a ‘stepping-stone’ process from S. Maria and S. Miguel, the old eastern islands. Terceira, S. Jorge and most probably Faial (located very near Pico) may have acted as ‘stepping-stones’ to Pico, the most recent island of the archipelago. Moreover, the results showed that, contrary to the predictions of the ‘equilibrium model of island biogeography’ (MacArthur & Wilson, 1967), the more isolated islands (Terceira and Pico) had fewer endemic species than the least isolated island (S. Maria). Therefore, isolation alone cannot be used to explain the species richness patterns found in the pasture arthropod species of the three Azorean islands, and the ‘equilibrium model of island biogeography’ (MacArthur & Wilson, 1963, 1967) does not, apparently, apply to this system.
Geological age hypothesis. The system of three islands each of very different geological age presents a unique opportunity to investigate ecological and evolutionary patterns in species richness. A consistent pattern of increasing species richness with island age was found to occur for all the groups of indigenous and endemic arthropods studied at regional and local scales. This suggests that a mixture of ecological (accumulation of species with immigration) and evolutionary factors (speciation) are operating to generate the observed patterns. That the average number of species at the local scale also increased with island age reinforces the relationship between diversity and island age. Similar patterns of increasing species richness in standard sized quadrats, but with island area, have been found by other workers (Tangney et al., 1990; Kohn & Walsh, 1994), and are usually viewed as evidence that the immigration and extinction processes of the MacArthur & Wilson’s (1963, 1967) equilibrium model are a realistic explanation for island species richness (Tangney et al., 1990; Kohn & Walsh, 1994; Rosenzweig, 1995). However, in the present study, it is geological age rather than area which is the explanatory variable, implying that time is in some way influencing extinction and immigration rates on the islands. We suggest that, as the islands become old and eroded, the overall landscape changes to become more diversified (e.g. flattened areas, volcanic cones with differential erosion, more soil types, etc.), thereby increasing the niches available for colonization and diversification of species. The recent islands (e.g. Pico) have a more homogeneous landscape and therefore lower ecological diversification. The results obtained with the endemic species should be interpreted cautiously, because most of the endemics found in the pasture habitats are endemic to the Azores as a whole rather than to individual islands. Therefore, the positive trend found between endemic species richness and geological age does not necessarily imply a direct relationship between island age and speciation within each island, at least with the present data (but see Borges, 1992). However, the trend seems to be somewhat similar when using the exclusive endemic species of each island. Four exclusive endemics were found in the pastures of the oldest island S. Maria (the lepidopteran Cyclophora puppillaria granti, the weevil Donus n.sp., the spider Trachyzelotes n.sp., and the ground-beetle
Olisthopus inclavatus), one in the middle-aged island Terceira (the linyphiid spider Minicia n.sp.) and one in the recent island Pico (the linyphiid spider Minicia picoensis). The geological ages used in these analyses are from the old volcanic complexes on the three islands. They provide an estimate of the maximum times for the colonization of species. However, since their formation, these islands have had periodic volcanic activity with some historical eruptions having occurred in the two recent islands (Terceira and Pico). S. Maria has experienced a long period of volcanic stability in contrast with the other two islands. The Feteiras Formation was the last eruptive phase recorded in S. Maria (5 to 2 Myr BP) (Serralheiro & Madeira, 1993). Assuming that the ash emitted by the three subaerial spatter cones of the Feteiras Formation did not cause the extinction of all the S. Maria fauna, then S. Maria has been available for colonization for at least 8 million years. When the last volcanic activity in S. Maria took place neither Pico nor Terceira even existed. Both Terceira and Pico have had very recent historical eruptions that may also have caused extinction of species. The significant results obtained between regional species richness and age of the islands when considering the age of the ‘Faial-Pico’ complex deserve some attention. The proximity of these islands, together with the eustatic lowering of sea level at the peak of the last glaciation, with an eventual connection of the two islands, probably promoted the free movement of species between them. Several factors may have combined to maintain species richness on the older island (S. Maria) in spite of its small area and elevation. First, as S. Maria is the southernmost Azorean island, the effects of climatic changes during the Pleistocene glaciations, if they occurred, are likely to have affected S. Maria less than more northern islands. Second, the longer period over which S. Maria has been volcanically stable has probably reduced extinction rates compared with the western, more recent islands. However, S. Maria may also have experienced a higher rate of extinction for a different reason. Goodfriend, Cameron & Cook (1994) found that a high proportion of the land-snail extinctions in Madeira occurred after human colonization, 550 years ago, and a low proportion during the last 330 000 years. If this pattern can be generalized to other taxa and to the Azores, then a higher proportion of extinctions on S. Maria might be expected, with emphasis on the extinction of herbivorous species, because a greater proportion of the island’s natural vegetation has been cleared in comparison with Terceira and Pico. Borges (1991) found that the Azorean endemic predatory Tarphius (Coleoptera, Colydiidae) species occupy non-native or highly modified habitats, which is probably not possible for the phytophagous insects. Furthermore, A.F. Martins (pers. comm.) considers that the land-snail fauna of S. Maria is the richest of all the Azorean islands (with more endemic species than all the other islands combined), and many of them also occupy non-native or highly modified habitats. On balance, therefore, climatic, geological and biological processes may have favoured S. Maria more than Terceira and Pico. In fact, the length of time each island has experienced some sort of environmental stability must have become decisive in setting current levels of faunal diversity (see Wilson & Taylor, 1967; Wilson, 1969).
Diamond (1969) suggested that the effects of distance and area on equilibrium species numbers on islands may be masked if islands differ in other important parameters. Climatic differences between the three islands may also have an impact on arthropod diversity, mainly between the driest island (S. Maria) and the wetter ones (Terceira and Pico). However, the differences in species between Terceira and Pico cannot be explained by climate, as the two islands actually have very similar