Effect of cellular folate availability
on adipocyte life cycle and metabolism
Efeito da disponibilidade celular de folatos no metabolismo e ciclo de vida de adipócitos
Cláudia Sofia Fonseca Marques
Orientação: Mestre Ana Isabel Gonçalves Faria Co-orientação: Mestre Elisa Alexandra Mota Ferreira
Trabalho de Investigação
Agradeço à Professora Doutora Conceição Calhau, à Professora Doutora Elisa Keating, à Professora Doutora Rosário Monteiro e à Mestre Ana Faria, pois sem os seus oportunos ensinamentos e sem a sua experiência e sabedoria a realização deste trabalho não teria sido possível.
Contents
Abbreviations ... vii
Abstract ... 1
Resumo ... 3
Introduction... 5
Materials and methods ... 9
Cells, chemicals and reagents ... 9
Cell culture ... 10
Sulforhodamine B assay... 11
Methyl-3H-thymidine incorporation into DNA ... 12
Lipid accumulation in adipocytes ... 12
Measurement of 3 H-deoxyglucose uptake ... 13
Determination of cell viability ... 14
Determination of homocysteine released to the culture medium ... 14
Statistical analysis ... 15
Results ... 17
Discussion ... 25
Conclusion... 32
Abbreviations
AICAR - 5-amino-4-imidazolecarboxamide ribonucleotide AR - adenosine receptors
BMI - body mass index cpm - counts per minute DEX - dexamethasone DG - deoxyglucose DHF - dihydrofolate
DHFR - dihydrofolate reductase
DMEM - Dulbecco’s modified Eagle’s medium
DMSO - dimethyl sulfoxide DNA - deoxyribonucleic acid
EDTA - ethylenediaminetetraacetic acid FBS - fetal bovine serum
GLUT - glucose transporter
HEPES - 4-(2-hydroxyethyl)-1-piperazineethanesulfonic acid HSL - hormone-sensitive lipase
IBMX - 3-isobutyl-1-methylxanthine LDH - lactate dehydrogenase MTX - methotrexate
NADH - nicotinamide adenine dinucleotide NAFLD - nonalcoholic fatty liver disease PBS - phosphate-buffered saline
PKA - protein kinase A RFC - reduced folate carrier
RNA - ribonucleic acid
SAH - S-adenosyl-homocysteine
SAHH - S-adenosyl-homocysteine hydrolase SAM - S- adenosyl-methionine
SEM - standard error of mean SRB - sulforhodamine B TAG - triglycerides
TCA - trichloroacetic acid THF - tetrahydrofolate
Tris - tris(hydroxymethyl)aminomethane TS - thymidylate synthase
Abstract
The role of folate in obesity and metabolic syndrome has started to be investigated but is far from being fully understood. Many studies have drawn attention to the association of folate status and plasma homocysteine levels, an established independent risk factor for cardiovascular disease development. Recently, epidemiologic data shows an inverse association between serum folate and body mass index. However, there is no straight evidence about the effects of folate on adipose tissue. In this regard, the aim of this study was to investigate the effect of cellular folate availability on preadipocyte proliferation, and on adipocyte adipogenesis and glucose uptake.
3T3-L1 preadipocytes were cultured to evaluate proliferation by sulforhodamine B staining and methyl-3H-thymidine incorporation, after 24 h or 48 h of treatment with methotrexate (MTX, 0.1 and 10 µM), an inducer of a low cellular folate status. Preadipocytes were induced to differentiate with an appropriate adipogenic cocktail in the presence or absence of MTX, and adipogenesis was determined by measuring lipid accumulation after staining with oil red O. 3H-Deoxyglucose uptake was determined by liquid scintillation counting.
MTX treatment for 24 h and 48 h reduced culture protein content and methyl-3H-thymidine incorporation in a time- and concentration-dependent manner (P < 0.05). At the end of treatment, there was even a lower protein content than in the beginning of treatment for the highest concentration of MTX (10 µM) used (P < 0.05), revealing cytotoxicity. In adipocytes, MTX treatment increased lipid accumulation and the effect was much more pronounced for the highest concentration of MTX. Furthermore, MTX (10 µM) increased basal glucose uptake (P < 0.05 vs control and MTX 0.1 µM). However, in MTX (10 µM)-treated
adipocytes, insulin-stimulation did not result in an increase of glucose uptake, contrary to what was observed in untreated adipocytes.
According to the new understanding of obesity therapeutic strategies with the aim of reducing associated metabolic complications, adipocyte hypertrophy and dysfunction could be prevented if adipose tissue preserves the ability to recruit preadipocytes to differentiate, so that fat content can be distributed among the new adipocytes. Our results showed that, when folate availability was compromised by MTX treatment, there was a stimulation of preadipocyte differentiation, but this stimulation was accompanied by a decrease in preadipocyte number. Furthermore, the results obtained in glucose uptake studies implying that these cells were resistant to insulin stimulation.
In conclusion, our results suggest that folate deprivation can interfere with adipocyte proliferation, differentiation and metabolism and promote the hypertrophic growth of adipocytes, which may contribute to the development of obesity complications and the metabolic syndrome.
Resumo
O papel dos folatos na obesidade e na síndrome metabólica começa agora a ser estudado mas ainda está longe de ser compreendido. Vários estudos têm focado a sua atenção na associação dos níveis plasmáticos de folatos com os de homocisteína, um factor de risco independente para o desenvolvimento da doença cardiovascular. Mais recentemente, estudos epidemiológicos revelaram uma associação inversa entre os níveis plasmáticos de folatos com o índice de massa corporal. Contudo, não há evidências directas sobre os efeitos dos folatos no tecido adiposo. Assim, o presente trabalho teve como objectivo investigar o efeito da disponibilidade celular de folatos na proliferação dos pré-adipócitos e na captação de glicose e na adipogénese de adipócitos.
Para tal, usou-se a linha celular de pré-adipócitos 3T3-L1 e avaliou-se a sua proliferação por coloração das proteínas da cultura com sulforrodamina B (SRB) e a incorporação de metil-timidina-3H após 24 h ou 48 h de tratamento com metotrexato (MTX, 0.1 and 10 µM), um indutor de baixos níveis celulares de folatos. A diferenciação foi induzida nos pré-adipócitos com um cocktail apropriado de diferenciação na presença ou ausência de MTX e a adipogénese foi determinada pela quantificação da acumulação lipídica após a coloração com
oil red O. A captação de desoxiglicose-3H pelos adipócitos foi determinada por cintilometria líquida.
O tratamento com metotrexato durante 24 h ou 48 h reduziu o conteúdo proteico da cultura celular e a incorporação de metil-timidina-3H de uma forma dependente do tempo e da concentração (P < 0,05). No final do tratamento com MTX 10 µM, o conteúdo proteico celular era ainda mais baixo do que no início da
experiência (P < 0,05), o que traduziu um efeito citotóxico. Nos adipócitos, o tratamento com MTX aumentou a acumulação lipídica, sendo este efeito muito mais pronunciado quando usada a concentração mais elevada do composto. O tratamento com MTX também aumentou o transporte basal de glicose, contudo, a estimulação pela insulina não aumentou a captação de glicose nos adipócitos tratados com MTX, contrariamente ao que se observou nos adipócitos não tratados.
De acordo com as novas estratégias terapêuticas da obesidade, cujo objectivo é a redução das suas complicações metabólicas, a hipertrofia e disfunção dos adipócitos pode ser prevenida se o tecido adiposo preservar a capacidade de recrutar pré-adipócitos para diferenciar de modo a haver a distribuição das reservas de gordura entre os novos adipócitos. Os resultados deste trabalho demonstram que, quando a disponibilidade de folatos está comprometida pelo tratamento com MTX, há uma estimulação da diferenciação dos pré-adipócitos. Porém, esta estimulação é acompanhada pela diminuição do número de pré-adipócitos. As observações efectuadas nas experiências de transporte de glicose propõem ainda que estas células são resistentes à estimulação da insulina.
Concluindo, estes resultados sugerem que a privação de folatos pode interferir com a proliferação, diferenciação e metabolismo dos adipócitos, promovendo o seu crescimento hipertrófico, o que pode contribuir para o desenvolvimento de complicações da obesidade e da síndrome metabólica
Introduction
Folate is a generic term for a naturally occurring family of B-group vitamins composed of an aromatic pteridine ring linked to p-aminobenzoic acid and a glutamate residue (Figure 1), which typically appears in food in a reduced, polyglutamyl form(1). The main dietary sources of folate include green leafy vegetables, like spinach and asparagus, some fruits, and fortified cereals and cereal products(2). Folic acid is the most common form of folate used in supplements and in fortified food products because it is highly bioavailable and
Figure 1 – Chemical structures of folate, 5-methyl-tetrahydrofolate and methotrexate. Adapted
from Assaraf et al(1).
chemically stable, since it has only one glutamate molecule(3). During their passage across the intestinal mucosa, folic acid and most dietary folates, after cleavage to the monoglutamyl form, are metabolized to 5-methyl-tetrahydrofolate
Folate
Methotrexate 5-methyl-tetrahydrofolate
Homocysteine
(Figure 1), the active coenzyme form of folate, to be absorbed in the proximal jejunum via the reduced folate carrier (RFC)(4).
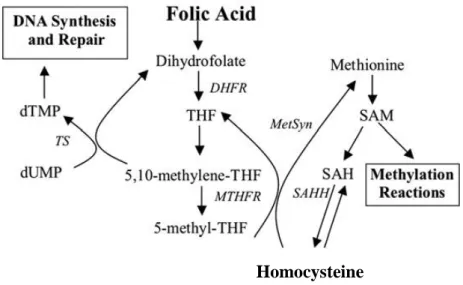
Figure 2 – Involvement of folate in pyrimidine biosynthesis and the homocysteine remethylation cycle. DHFR - dihydrofolate reductase, MetSyn - vitamin-B12-dependent methionine synthase, MTHFR - methylenetetrahydrofolate reductase, SAH - adenosyl-homocysteine, SAHH - S-adenosyl-homocysteine hydrolase, SAM - S- adenosyl-methionine, THF - tetrahydrofolate, TS -
thymidylate synthase. Adapted from Katula et al(5).
Cellular folates act as donors and acceptors of methyl groups in the biosynthesis of nucleotide precursors used for DNA and RNA synthesis, and provide methyl groups for DNA, RNA and protein methylation(6). Folic acid is reduced to dihydrofolate (DHF) and tetrahydrofolate (THF) by dihydrofolate reductase (DHFR), which is converted to 5,10-methyleneTHF(4). This coenzyme is a substrate for the thymidylate synthase (TS) enzyme in the methylation of deoxyuridine monophosphate to deoxythymidine monophosphate, which is the sole de novo source of thymidine and the rate limiting step in DNA synthesis. 5,10-MethyleneTHF is also used in the production of formylTHF, which is, in turn, used in de novo purine synthesis(6) by glycinamide ribonucleotide transformylase and
5-amino-4-imidazolecarboxamide ribonucleotide (AICAR) transformylase enzymes. In addition, the conversion of 5,10 - methyleneTHF to THF in the folate cycle provides the methyl group required to convert homocysteine to methionine(7) (Figure 2).
Folate deficiency can result from an inadequate folic acid intake, malnutrition, or increased metabolic needs caused by pregnancy, metastatic cancer or antifolate chemotherapy, e.g. methotrexate (MTX)(4). MTX is actively transported into mammalian cells by RFC(8). Once in the cytosol, it binds to and
inactivates DHFR, resulting in the depletion of metabolically active intracellular
folates with subsequent inhibition of the synthesis of thymidylate(9). Inhibition of
DHFR causes cessation of the synthesis of purine metabolites which are crucial
for cell proliferation (9).
Low folate status is associated with elevated homocysteine levels(10), an independent risk factor for cardiovascular disease(11), with coronary heart disease (independently of total homocysteine levels)(12), with neural tube defects(13) and, recently, with increased body mass index (BMI)(14). Epidemiological data suggests that not only folate deficiency is associated with adiposity or body fat percentage, but also with absolute amounts of central and peripheral fat(15). It has been pointed as a risk factor for nonalcoholic fatty liver disease (NAFLD)(16) and, therefore, for metabolic syndrome, since approximately 90% of the patients with NAFLD have more than one feature of the metabolic syndrome(17). In addition, another study has shown that weight loss can help to improve the folate status of overweight and obese women(18). Understanding the mechanisms underlying this association is of great significance because obesity and its metabolic associated complications are major health problems(19).
A number of important functions in intermediary metabolism and hormonal interactions with other tissues have been attributed to adipose tissue, which is no longer considered as just an energy store(20). Since there is no straight evidence about the effects of folate on adipose tissue, the aim of this study was to investigate the effect of cellular folate availability on preadipocyte proliferation, and on adipocyte adipogenesis and glucose uptake. For this purpose, the 3T3-L1 murine preadipocyte line was chosen due to the ability of these cells to undergo differentiation into mature adipocytes and because of its wide use and characterization as a model of this adipose tissue cellular component(21, 22). To induce a low cellular folate status, cells were treated chronically with different concentrations of MTX.
Materials and Methods
Cells, chemicals and reagents
The murine 3T3-L1 cell line was obtained from the American Type Culture Collection (ATCC, CL-173) through LGC Promochem (Spain). L-amethopterin hydrate (methotrexate), antibiotic-antimycotic solution, dexamethasone (DEX), Dulbecco’s modified Eagle’s medium (DMEM),
4-(2-hydroxyethyl)-1-piperazineethanesulfonic acid (HEPES), insulin, 3-isobutyl-1-methylxanthine (IBMX), β-nicotinamide adenine dinucleotide, reduced disodium salt hydrate (β-NADH-Na2), oil red O, sodium piruvate, sulforhodamine B (SRB),
tris(hydroxymethyl)aminomethane (Tris), tris(hydroxymethyl)aminomethane hydrochloride (Tris-HCl), and trypsin-ethylenediaminetetraacetic acid (EDTA) were obtained from Sigma-Aldrich Chemicals (U.S.A.). Fetal bovine serum (FBS) was purchased from Gibco (United Kingdom). Dimethyl sulfoxide (DMSO), gelatin,
p-formaldehyde, trichloroacetic acid (TCA) and triton X-100 were obtained from
Merck (Germany). 3H-Deoxyglucose (3H-DG) and methyl-3H-thymidine were obtained from American Radiolabeled Chemichals (U.S.A), Inc and Amersham (U.S.A.), respectively.
MTX was dissolved in NaOH 0.1 M each time it was used, to obtain MTX 0.1 mM and 10 mM. For all experiments, MTX 0.1 mM, MTX 10 mM or the solvent were dissolved 1:1000 in incubation media of preadipocytes and adipocytes.
Cell culture
3T3-L1 preadipocytes were cultured at 37ºC in a 5% CO2 humidified
atmosphere in DMEM growth medium (containing in average 35.93 ± 1.505 ng/mL of folic acid), supplemented with 1.5 g/L NaHCO3, 10% (v/v)
heat-inactivated FBS (56°C, 30 min), 100 U/mL penicillin and 100 U/mL streptomycin. Every other day, when cells got confluent, culture was split at a 1:3 ratio by incubation with 1 mL 0.25% trypsin-EDTA solution, and subcultured in 21 cm2 polystyrene culture plates (21 cm2, Ø 60 mm, Orange Scientific, Belgium).
To measure proliferation, we used 96-well plates (0.37 cm2/well, Orange Scientific, Belgium) and 24-well plates (1.65 cm2/well, Orange Scientific, Belgium) and in differentiation assays, cells were seeded in 24-well plates precoated with 0.2% (w/v) gelatin prepared in phosphate-buffered saline (PBS;140 mM NaCl, 3 mM KCl, 8 mM Na2HPO4, 2 mM KH2PO4, pH 7.4).
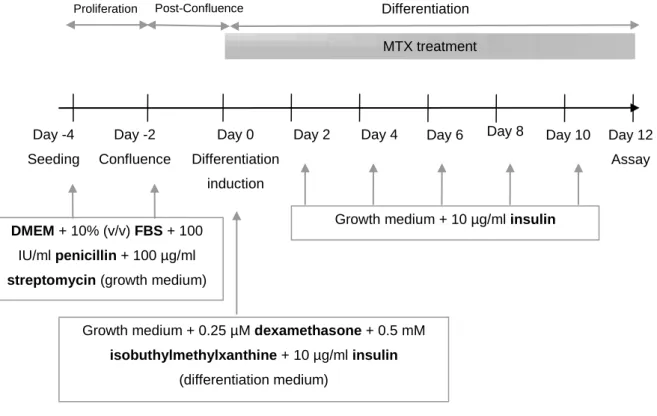
Adipocytes were obtained through induction of 3T3-L1 preadipocyte differentiation (Figure 3). Two days after reaching confluence (day 0 of differentiation), 3T3-L1 preadipocytes were exposed to IBMX (0.5 mM), DEX (0.25 μM), and insulin (10 μg/mL) in growth medium as described(23)
. After 2 days, this differentiation cocktail was removed and cells were maintained in growth medium containing only insulin (10 μg/mL). This medium was changed every 2-3 days. Adipocytes were used 12 days after differentiation induction when approximately 80% of control cells were differentiated.
Figure 3 – Representation of differentiation protocol and methotrexate (MTX) treatment of adipocytes. DMEM, Dulbecco’s modified Eagle’s medium; FBS, fetal bovine serum. Adapted from Teixeira et al(24).
Sulforhodamine B assay
For sulforhodamine B (SRB) assay, cells were seeded (4 × 10³ cells in 100 µL per well) in 96-well plates. After 24 h, MTX was added to the culture in different final concentrations (0.1 µM and 10 µM) for 24 h or 48 h. At the end of each experiment, 25 μL of ice-cold 50% (w/v) TCA was added to the culture medium on
each well to fix cells for 1 h at 4°C in the dark. Cells were then gently washed 4 times with distilled water to remove TCA. Plates were air-dried and then stained for 15 min with 0.4% (w/v) SRB dissolved in 1% acetic acid as described(25). Excess SRB was removed and cultures were quickly rinsed 5 times with 1% acetic
Proliferation Day -2 Confluence Day 0 Differentiation induction Day 2 Day 8 Differentiation Day -4 Seeding Day 4
Growth medium + 0.25 µM dexamethasone + 0.5 mM
isobuthylmethylxanthine + 10 µg/ml insulin
(differentiation medium)
(Differentiation medium)
Growth medium + 10 µg/ml insulin Day 6
DMEM + 10% (v/v) FBS + 100
IU/ml penicillin + 100 µg/ml
streptomycin (growth medium)
Day 10 Day 12
Assay
Post-Confluence
acid to remove unbound dye. After drying, the bound dye was solubilized with 150 μL Tris (10 mM, pH 10.5) and the absorbance was determined at 492 nm with
reference at 650 nm on a plate reader (Thermo Electron Corporation, Multiskan Ascent, U.S.A.). Before the beginning of treatment (day 0), the absorbance of control wells containing untreated cells in the 96-well plates was determined and the proliferative activity was calculated from the ratio of the absorbance readings between treated and these untreated control wells.
Methyl-3H-thymidine incorporation into DNA
Cells were seeded in 24-well cell culture plates (1 × 10⁴ cells per well) in a final volume of 500 µL culture medium. After 24 h in culture, cells were treated with different concentrations of MTX (0.1 and 10 µM) or vehicle (NaOH 0.1 mM) dissolved in culture medium. After 24 h or 48 h, cells were incubated with 200 µL of methyl-3H-thymidine (0.5 µCi/well) for 4 h at 37ºC. The medium was removed and cells were fixed by incubation in 10% TCA for 1 h at 4ºC. Cells were then washed twice with 10% TCA to remove unbound radioactivity. Plates were air-dried and cells were lysed with 1 M NaOH (280 µL/well) as described(26). A 250 µL aliquot of the lysate was neutralized with 5 M HCl prior to the addition of scintillation fluid. The radioactivity of the samples was quantified in a liquid scintillation counter and the results are presented in counts per minute (cpm).
Preadipocytes were seeded (1 × 10⁴ cells in 500 μL per well, 24-well cell culture plates) in wells precoated with 0.2% gelatin. Cells were treated with MTX (0.1 and 10 µM) during cellular differentiation from day 0 to day 12 (Figure 3). Differentiation medium was added in the presence of MTX or vehicle (NaOH 0.1 mM) and was replaced two days later by growth medium containing INS and MTX, which was renewed every 2-3 days. Twelve days after the beginning of differentiation, the culture medium was removed and cells were washed with PBS and fixed with p-formaldehyde (3.7% (v/v) in PBS) for 1 h at room temperature. The cells were stained with 0.3% oil red O solution in isopropanol:distilled water (3:2) for 15 minutes as described(24). The culture plate was washed 4 times with distilled water and air-dried. Oil red O in the cells was recovered in 150 μL of DMSO, and the absorbance measured at 492 nm with reference at 650 nm on a plate reader (Thermo Electron Corporation, Multiskan Ascent, U.S.A.). Results were normalized to cell number counted through the trypan blue method.(26)
Measurement of 3H-deoxyglucose uptake
Preadipocytes were seeded, differentiated and treated as detail above. On day 12 of differentiation, the culture medium was removed and cells were washed with 0.3 mL glucose-free HEPES buffered saline (140 mM NaCl, 5 mM KCl, 2.5 mM MgSO4, 1 mM CaCl2, 1 mM NaH2PO4.H2O, 4 mM Na2HPO.2H2O, 20 mM
HEPES, pH 7.4) at 37ºC. Cells were then pre-incubated for 30 minutes with 0.3 mL glucose-free HEPES buffered saline in the presence or absence of 0.1 nM insulin. Glucose uptake was initiated by the addition of 0.3 mL buffer at 37ºC containing 1 µM 3H-deoxyglucose, according to the procedure described by Faria
et al(27). After 10 minutes, incubation was stopped by washing adipocytes with 0.3 mL ice-cold buffer. The cells were then solubilized with 0.3 mL 0.1% (v/v) Triton X-100 (in 5 mM Tris-HCl, pH 7.4), and placed overnight at room temperature. Radioactivity was afterwards measured by liquid scintillation counting and total protein amount was determined as described by Bradford to correct results for total culture proteins(28).
Determination of cell viability
Cell viability was assessed by measuring lactate dehydrogenase (LDH) activity, as described by Bergmeyer and Bernt(29). Preadipocytes were treated with MTX or vehicle, 24 h or 48 h after seeding in 24-well cell culture plates. At the end of each treatment, 50 µL of culture medium were collected to a 96-well culture plate to determine extracellular LDH activity through the addition of 250 µL of reagent solution (11.3 mM β-NADH-Na2, 50 mM phospate, 0.63 mM piruvate, pH
7.4). To determine intracellular LDH activity, cells were then washed with 1 mL PBS and lysed with 0.3 mL 0.1% (v/v) Triton X-100 (in 5 mM Tris-HCl, pH 7.4) for 30 minutes at 37ºC. Lactate dehydrogenase activity was determined by measuring the oxidation of NADH at a wavelength of 340 nm during the reduction of pyruvate to lactate. Absorvance values were determined for 2 min, and the rate of NADH reduction was calculated. Adipocyte viability was also evaluated as well after the 12 days of differentiation and treatment following the same protocol.
Homocysteine concentration was measured in culture media before and after treatments.
After 24 h and 48 h of preadipocyte treatment with vehicle or MTX, the incubation medium was used to determine total homocysteine released. After 12 days of adipocyte differentiation with MTX or vehicle the incubation medium was also used for total homocysteine determination. Homocysteine quantification was performed by Clinical Biochemistry Department of S. João Hospital using an automatic method that followed the guidelines(30).
The values obtained in the culture media (in µmol/L), after have been incubated with the cells, were normalized for the available indexes of cell density in the culture. In the case of preadipocytes, homocysteine concentration were normalized for methyl-thymidine-3H incorporation, where as homocysteine in adipocyte-conditioned media was normalized for the number of cells counted by trypan blue method.
Statistical analysis
Results are presented as arithmetic means and standard error of mean (SEM) of three independent experiments with measurements at least in triplicate. Statistical significance of the difference between various groups was evaluated by one-way analysis of variance (ANOVA test) followed by Bonferroni test (in Graph Pad Prism 5.0 software, U.S.A.). Student’s t test was used for comparison between two groups. Whenever variances differed significantly, the correspondent non-parametric tests were chosen (Kruskal-Wallis followed by Dunn’s multiple comparison test for comparison of three or more groups and Mann Whitney’s test
for comparison of two groups). Differences between means were considered significant when P < 0.05.
Results
Preadipocytes were used for proliferation assays and adipocytes for lipid accumulation and glucose transport studies. Cellular viability was determined both in preadipocytes and adipocytes after treatment with MTX. The concentrations chosen for MTX treatment of preadipocytes and adipocytes were based on previous investigations(31, 32).
3T3-L1 preadipocyte proliferation
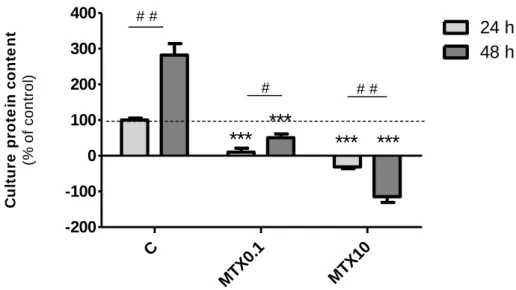
Proliferation of 3T3-L1 cells after treatment with different concentrations of MTX was determined by SRB staining and methyl-3H-thymidine incorporation into cell culture DNA. In SRB protein staining assay, the dye binds to basic amino acids of cellular proteins and colorimetric evaluation provides an estimate of total protein mass which is related to cell number(25). Culture protein content after treatment was compared with the initial amount of protein (after 24 h of plating) and this value was considered the baseline. An increase in the number of cells in comparison to this time point appears graphically as a positive value and a decrease as a negative value. The percentage control (using values of control cells grown another 24 h after beginning of treatments) were then calculated and are displayed in Figure 4.
Cell culture protein content was significantly decreased by 0.1 µM MTX treatment for 24 h (to 10.33 ± 10.75% of control) and 48 h (to 50.74 ± 10.62% of control) as compared to control cells (absorvance: 0.071 ± 0.007). For the highest concentration of MTX used (10 µM) after 24 h or 48 h of treatment, there was even a lower protein content in the culture than at the beginning of treatment (-31.20 ±
4.880% and -114.6 ± 16.30% of control, respectively). This result indicates that MTX at 10 µM was cytotoxic to preadipocytes.
Figure 4 - Culture protein content after treatment with methotrexate (MTX). Preadipocytes were
treated with MTX 0.1 µM (MTX0.1), MTX 10 µM (MTX10) or vehicle (C, 0.1 M NaOH) for 24 h or 48 h, 24 h after seeding. At the end of treatment, cells were fixed with trichloroacetic acid and stained with sulforhodamine B. Bound dye was extracted with Tris solution (10 mM, pH 10.5) and absorvance was measured at 492 nm with reference at 650 nm. Bars represent means and vertical
lines are one SEM. ***P < 0.0001 vs respective control, #P < 0.05 and # #P < 0.01 between columns
(n = 24).
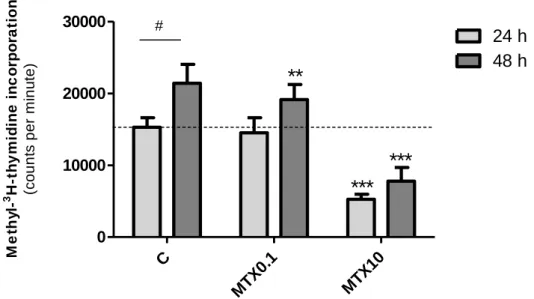
The other method used to evaluate cellular proliferation consisted in measuring the incorporation of labeled thymidine nucleoside into cellular DNA during cellular cycle S phase. Since DNA synthesis is a requisite for cell proliferation, incubation of cells with methyl-3H-thymidine allows incorporation of the tritiated nitrogen base into cells when cells replicate their DNA and divide(26).
Comparatively to the cells treated with vehicle for 24 h (15295 ± 1320 cpm) and 48 h (21408 ± 2632 cpm), 10 μM MTX reduced methyl-3H-thymidine incorporation significantly after 24 h (5261 ± 714.2 cpm) or 48 h (7777 ± 1904 cpm) of treatment (Figure 5). On the other hand, 0.1 μM MTX had no effect on
C MTX 0.1 MTX 10 -200 -100 0 100 200 300 400 24 h 48 h
***
***
***
***
# # # # # C u lt u re p ro te in c o n te n t (% o f c o n tr o l)methyl-3H-thymidine incorporation after 24 h of treatment but reduced cell proliferation when cells were incubated 48 h with the compound (19133 ± 2097 cpm).
Figure 5 - Methyl-3H-thymidine incorporation into cellular DNA after treatment with methotrexate (MTX). Preadipocytes seeded on 24-well plates were treated with MTX 0.1 µM (MTX0.1), MTX 10 µM (MTX10) or vehicle (C, 0.1 M NaOH) for 24 h or 48h, 24 h after seeding. At the end of
treatment, cells were incubated with methyl-3H-thymidine (0.5 µCi/well) at 37ºC, for 4 h, washed
and fixed with trichloroacetic acid, lysed with NaOH and incorporated methyl-3H-thymidine was
measured in cell lysates through liquid cintilometry. Bars represent means and vertical lines are
one SEM. **P < 0.001 and ***P < 0.0001 vs respective control and #P < 0.05 between columns (n =
18).
Lipid accumulation in adipocytes
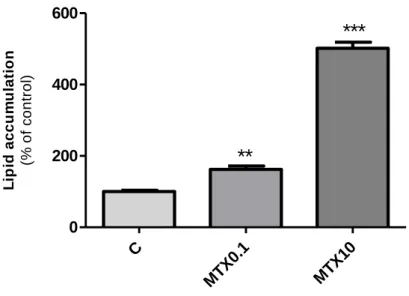
On the first 4-7 days after preadipocyte differentiation induction, in the cytoplasm of maturing adipocytes there are multiple small lipid droplets that tend to coalesce into bigger droplets as differentiation proceeds. At day 12 of differentiation process, cells were stained with oil red O to assess lipid accumulation, as an index of the degree of differentiation(33).
C MT X0.1 MT X10 0 10000 20000 30000 24 h 48 h
***
***
**
# M e th y l-3 H -t hy m idi n e i nc orpo ra ti o n (c o u n ts p e r m in u te )The quantitative spectrophotometric analysis of cellular lipid content revealed that treatment of adipocytes with MTX resulted in a significant, concentration-dependent, higher oil red O incorporation (162.5 ± 9.3% of control and 501.6 ± 17.2% of control respectively) in comparison to vehicle-treated cells (absorvance: 0.014 ± 0.001 / 104 cells) (Figure 6).
Figure 6 - Lipid accumulation in adipocytes after treatment with methotrexate (MTX). Cells were
treated with MTX 0.1 µM (MTX0.1), MTX 10 µM (MTX10) or vehicle (C, 0.1 M NaOH) dissolved in culture medium since the induction of differentiation. At day 12 of the differentiation protocol, cells were fixed with p-formaldehyde (3.7% (v/v)) and stained with oil red O (0.3% in isopropanol:destiled water, 3:2). Incorporated dye was extracted with dimethyl sulfoxide and absorvance was measured at 492 nm with reference at 650 nm. Results were normalized to cell number counted through the trypan blue method. Bars represent means and vertical lines are one SEM. **P < 0.001 and ***P < 0.0001 vs control (n = 18).
Measurement of 3H-deoxyglucose uptake
Adipocytes are cells that can express glucose transporters (GLUT) - 1 and 4 in their plasma membrane. GLUT1 transporters have high affinity to glucose and their action is not insulin-dependent. GLUT4 transporters are stored in intracellular
C MTX 0.1 MTX 10 0 200 400 600
**
***
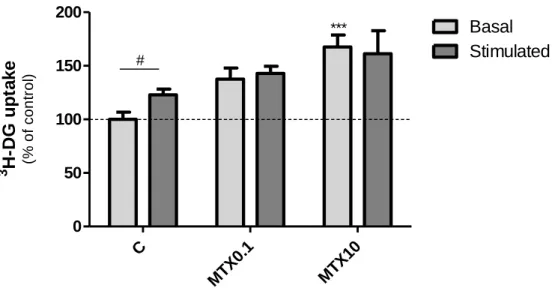
L ip id a c c u m u la ti o n (% o f c o n tr o l)sites and their translocation to the plasma membrane is determined by insulin stimulus(34). The effect of MTX treatment on glucose uptake in the presence or absence of insulin was evaluated by measuring the uptake of 3H-DG (Figure 7).
MTX 0.1 µM treatment had no effect on 3H-DG basal uptake but the highest concentration of MTX (10 µM) used significantly increased 3H-DG basal uptake (to 167.7 ± 11.1 % of control). Addition of insulin to vehicle-treated cells resulted in a significant increase of 3H-DG uptake (from 911.5 ± 64.8 fmol/mg of protein to 1122.74 ± 46.05 fmol/mg of protein after insulin treatment). This is in contrast to what was observed in 0.1 µM MTX- and 10 µM MTX-treated adipocytes suggesting that MTX-treated cells are resistant to insulin stimulation, at least in what concerns glucose uptake.
Figure 7 - 3H-Deoxyglucose (3H-DG) uptake after treatment with methotrexate (MTX) in the absence (basal) or presence (stimulated) of insulin. Cells were treated with MTX 0.1 µM (MTX0.1), MTX 10 µM (MTX10) or vehicle (C, 0.1 M NaOH) dissolved in culture medium since the induction of differentiation. At day 12 of the differentiation protocol, cells were pre-incubated with glucose-free HEPES buffered saline in the absence or presence of 0.1 nM insulin. Afterwards, cells were
incubated with 3H-deoxyglucose for 10 minutes at 37ºC and 3H-deoxyglucose incorporation was
C MT X0.1 MT X10 0 50 100 150 200 Basal Stimulated # *** 3 H-DG u p ta k e (% o f c o n tr o l)
measured by liquid scintillation counting. Bars represent means and vertical lines are one SEM.
***P < 0.0001 vs respective control and #P < 0.05 between columns (n = 12).
Determination of cell viability
LDH is a cytoplasmic enzyme which catalyses the conversion of pyruvate to lactate in the presence of NADH. Its presence in the extracellular medium gives information about membrane integrity and cell viability. Since released LDH is a stable enzymatic marker that correlates linearly with cell viability(35) the MTX cytotoxic effects on preadipocytes and adipocytes were evaluated by measuring the activity of this enzyme.
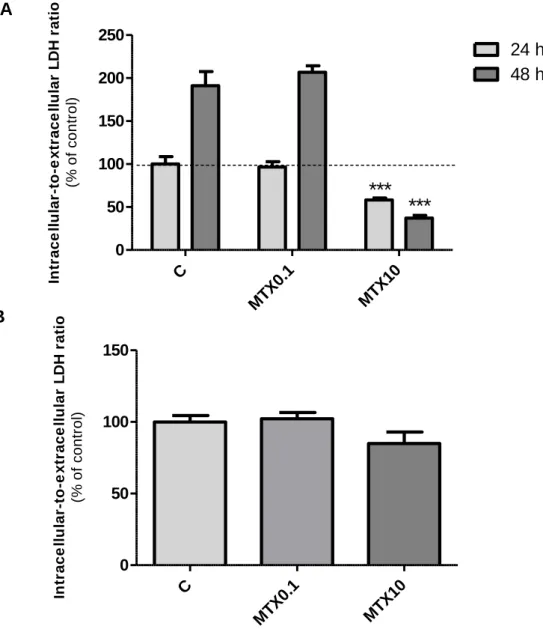
In preadipocytes, results suggest that 0.1 µM MTX treatment did not have cytotoxic effects, since there were no differences between intracellular-to-extracellular LDH ratio in treated and control cells (4.426 ± 0.417 intracellular-to-extracellular LDH ratio in control cells) (Figure 8). On the other hand, the highest concentration of MTX used (10 µM) reduced cell viability significantly after 24 h or 48 h of treatment (to 58.19 ± 2.31% and to 37.18 ± 3.23% of control at 24 h and 48 h, respectively). In adipocytes, MTX treatment, which begun 2 days after cells reached confluence, did not reduce cell viability in any of the concentrations used, suggesting that its cytotoxic effects may be restricted to proliferating cells.
Figure 8 - Cell viability in preadipocytes (A) and adipocytes (B) after treatment with methotrexate.
Cells were treated with MTX 0.1 µM (MTX0.1), MTX 10 µM (MTX10) or vehicle (C, 0.1 M NaOH) 24 h or 48 h after seeding (A) or 12 days after differentiation induction (B). Extracellular and intracellular lactate dehydrogenase activity was determined by measuring the oxidation of NADH at a wavelength of 340 nm during the reduction of pyruvate to lactate. Bars represent means and vertical lines are one SEM. ***P < 0.0001 vs respective control (n = 12 and n = 8 on experiments using preadipocytes and adipocytes, respectively).
Determination of homocysteine released to culture medium
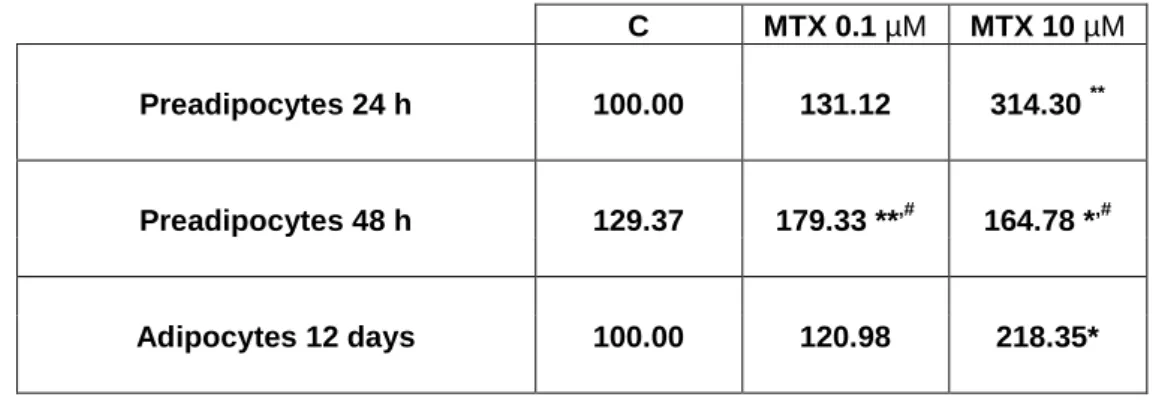
After 24 h, 0.1 or 10 µM MTX treatment significantly increased homocysteine release to the culture medium (to 131.1 ± 5.7 and to 314.3 ± 15.7%
A B C MT X0.1 MT X10 0 50 100 150 200 250 24 h 48 h
***
***
In tr a c e ll u la r-to -e x tr a c e ll u la r L DH ra ti o (% o f c o n tr o l) C MTX 0.1 MTX 10 0 50 100 150 In tr a c e ll u la r-to -e x tr a c e ll u la r L DH r a ti o (% o f c o n tr o l)of control respectively) in comparison with cells treated with vehicle (0.121 ± 0.010 nM/cpm) (Table 1). After 48 h both concentrations of MTX used caused a significant increase on homocysteine release (to 179.3 ± 2.2 and to 164.8 ± 5.3% of control in 0.1 µM and 10 µM MTX-treated cells, respectively).
In adition, total homocysteine was also increased from 179 ± 0.0 nM/ 104 cell in control cells to 390.2 ± 0.04 nM/ 104 cell in the culture medium of 10 µM MTX treated-adipocytes.
Culture medium homocysteine concentration was below the detection level of the method (< 1 µmol/L).
C MTX 0.1 µM MTX 10 µM Preadipocytes 24 h 100.00 131.12 314.30 ** Preadipocytes 48 h 129.37 179.33 **,# 164.78 *,# Adipocytes 12 days 100.00 120.98 218.35*
Table 1 – Total homocysteine released to the culture medium in % of control. After 24 h and 48 h
of preadipocyte treatment and after 12 days of adipocyte differentiation and treatment with vehicle (C, 0.1 M NaOH) or MTX, culture medium was collected and used to determine
homocysteine release. Results were normalized for cell number measured by methyl-3
H-thymidine incorporation and trypan blue method on experiments using preadipocytes and
adipocytes, respectively. *P < 0.05 and **P < 0.01 vs respective control and #P < 0.05 vs
Discussion
Research on the relationship between folate and obesity or the metabolic syndrome includes only a few studies to date but there is evidence supported by epidemiological investigations that low levels of plasma folate are associated with increased BMI(36-38) and body fat percentage(15). Obesity and the associated metabolic pathologies are the most common and detrimental metabolic diseases(39). They are associated with a chronic inflammatory response characterized by abnormal cytokine production and by activation of inflammatory signaling pathways, which appears to be triggered in adipose tissue(39). Adipose tissue growth can be a result from an increase in adipocyte number (hyperplasia), or from an increase in adipocyte volume due the incorporation of triglycerides (TAG) (hypertrophy), or from both(40). However, it seems that if energy is stored predominantly through lipogenesis resulting in adipocyte hypertophy instead of adipogenesis with recruitment and differentiation of new adipocytes and hyperplasia, adipose tissue responses can be pathological contributing to metabolic disease(41).
According to the new understanding of obesity therapeutic strategies with the aim of reducing associated metabolic complications, adipocyte hypertrophy and dysfunction could be prevented if adipose tissue preserves the ability to recruit preadipocytes to differentiate, so that fat content can be distributed among the new adipocytes(42). There is also evidence that the opposite also applies, i.e. when there is a decrease in the ability to recruit new preadipocytes, obesity complications may be precipitated(43). Here, we demonstrate that, when folate availability is compromised by MTX treatment preadipocyte proliferation is inhibited as shown by methyl-3H-thymidine incorporation and SRB staining
experiments. This decrease in preadipocyte number can limit the recruitment of these cells to differentiate. In SRB assay, after 24 h or 48 h of 10 µM MTX treatment, there was a lower protein content in the culture than at the beginning of treatment. This suggested that MTX at 10 µM concentration was cytotoxic to preadipocytes. To confirm these results, we determined cell viability after 24 h and 48 h of 10 µM MTX treatment, by LDH activity determination. In fact, 10 µM MTX treatment caused cell death and reduced cell viability at 24 h and 48 h. Similarly, Savion et al. suggested that the lower survival rate of embryonic fibroblasts in response to MTX might be caused, at least partially, by a decrease in cell proliferation, which might be attributed to the bax protein, an inducer of apoptosis that enhances the permeability of the mitochondrial membrane and the release of cell death proteins(32). On the other hand, 0.1 µM MTX did not exert cytotoxic effects on preadipocytes but did reduce 3T3-L1 fibroblast proliferation measured by SRB. The results regarding methyl-3H-tymidine incorporation also showed a reduction in preadipocyte proliferation by MTX in a time- and concentration-dependent manner. This reduction can be explained through the inhibition of DHFR and TS by methotrexate, causing cessation of the purine and pyrimidine synthesis which are important for cell proliferation(44).
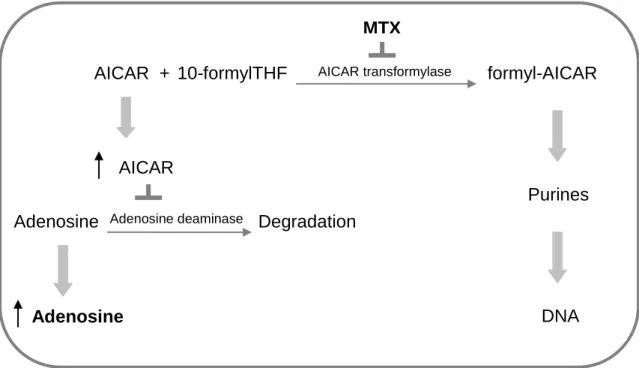
Another interesting result from the present work concerns lipid incorporation into adipocytes measured by oil red O. MTX treatment of adipocytes resulted in a higher (concentration-dependent) lipid accumulation, suggesting a stimulation of preadipocyte differentiation when folate availability was compromised. The fact that low cellular folate availability may impair de novo biosynthesis of purines, leading to AICAR and adenosine accumulation, may help explain this result. In
by fibroblasts(9). MTX inhibits AICAR transformylase, which catalyzes one of the final stages of de novo purine synthesis. Inhibition of AICAR transformylase leads to AICAR accumulation. This results, in turn, in a net increase in intra- and extracellular adenosine(45), since adenosine deaminase, an enzyme responsible for adenosine degradation, is also inhibited (Figure 9). Adenosine receptors (ARs) are widely distributed in tissues and modulate numerous physiological processes(46). A1 ARs are highly expressed in the adipose tissue, and it has been
shown that endogenous adenosine can tonically activate adipose tissue A1 ARs,
causing inhibition of lipolysis(47).
Figure 9 - Methotrexate increases adenosine accumulation via 5-amino-4-imidazolecarboxamide
ribonucleotide (AICAR) transformylase inhibition. THF, tetrahydrofolate; MTX, methotrexate.
Adapted from Dhalla et al(47).
Adenosine AICAR formyl-AICAR Purines DNA 10-formylTHF + AICAR transformylase Adenosine Degradation AICAR MTX Adenosine deaminase
Lipolysis is the process by which TAG are hydrolysed into free fatty acids and glycerol. Adipocyte lipolysis is activated by catecholamines that bind to GS
protein-coupled receptors activating adenyl cyclase. This stimulation leads to an increase in intracellular cAMP concentration, resulting in activation of cAMP-dependent protein kinase A (PKA). PKA phosphorylates hormone-sensitive lipase (HSL), leading to increased cellular TAG hydrolytic activity(48), and perilipin, the lipid droplet-coating protein that when activated allows TAG breakdown by HSL.
When adenosine binds to A1 ARs in adipocytes, it inhibits adenylyl cyclase
and cAMP production, causing inhibition of lipolysis and increasing adipocyte TAG accumulation. This adenosinergic mechanism of action may underline the results obtained with the oil red O assay. Promoting adenosine accumulation and release by adipocytes, MTX directly, and also indirectly, through the induction of a low folate availability, may exert antilipolytic effects leading to increased lipid accumulation in adipocytes, in a concentration-dependent manner. In the same line, Lam et al., described that folic acid supplementation has significant modulatory effects on lipolysis and results in an improvement of both baseline and beta-adrenoceptor-mediated lipolysis in +db/+db mice(49). Therefore, it is suggested that folate can contribute to decreased lipid accumulation both by inhibiting A1 ARs receptor stimulation but also by stimulating
adrenoceptor-mediated lipolysis.
Adipocytes can also re-esterify fatty acids and synthesize TAG from glucose or other energy sources acquired in the diet through a process called de
novo lipogenesis(50). The results obtained in 3H-DG uptake suggest that 10 µM MTX treatment stimulates basal glucose uptake in adipocytes (and that 0.1 µM MTX treatment induces the same trend), probably favoring de novo lipogenesis
and contributing to higher lipid accumulation in these cells. Given the importance of GLUT1 on adipocyte basal glucose transport, a stimulation of this membrane transporter by MTX or folate deficiency could explain these results.
Several enzymes involved in adipose tissue lipogenesis, like fatty acid synthase and acetyl coenzyme A carboxylase, contributing to TAG synthesis from glucose, are induced by insulin(50). In addition, GLUT4, responsible for increasing glucose entry to adipocytes after translocation to the plasma membrane, is also stimulated by insulin. Thus, an increase in 3H-DG uptake after adipocyte incubation with insulin, was expected. However, incubation with insulin after MTX treatment did not result in a increased 3H-DG uptake, as opposite to what was observed in control cells, suggesting that MTX treated adipocytes were resistant to insulin stimulation. Mechanisms that could explain what cause this resistance to insulin stimulus, deserve further investigation. The influence of folate on insulin levels was recently postulated by Setola et al. who reported that prolonged folate treatment in patients with metabolic syndrome not only decreased homocysteine levels, but also reduced insulin levels, improving insulin resistance(52). In addition, Golbahar et al. reported that hyperhomocysteinemia, also associated with low plasma folate levels, induced insulin resistance in male Sprague Dawley rats(53). These reports prompted us to determinate homocysteine released to the culture medium of preadipocytes and adipocytes, before and during MTX treatment.
Homocysteine is a sulphur-containing amino acid derived from the conversion of methionine to cysteine and has been regarded as an independent risk factor for atherosclerotic cardiovascular, since elevated plasma levels (> 15 µmol/L) are associated with the pathogenesis of atherosclerosis and cardiovascular disease(54). Folate deficiency can increase plasma homocysteine
levels, since the conversion of 5-methylTHF into THF provides the methyl group required for homocysteine metabolism through the remethylation pathway(10). This is well demonstrated by our results, showing that when folate availability was compromised by MTX treatment, homocysteine in the culture medium of preadipocytes was increased at 24 h and at 48 h after treatment for both concentrations of MTX used. After 12 days of differentiation under folate deprivation due the presence of MTX, adipocytes released increased amounts of homocysteine to the culture medium in a concentration-dependent manner. Riederer et al. had already found that progressive differentiation of 3T3-L1 cells resulted in increased homocysteine concentration in cell culture supernatants(55). They attributed this finding to N-nicotinamide metyltransferase, which catalyses the reaction of nicotinamide to methyl-nicotinamide using the methyl group provided by methionine (SAM) conversion into adenosyl-homocysteine (SAH) (Figure 2). SAH is then converted into adenosyl-homocysteine by S-adenosyl-homocysteine hydrolase, increasing through this pathway the release of the atherogenic metabolite in the culture medium(55). In our study, N-nicotinamide metyltransferase of adipocytes could have used the nicotinamide present in the culture medium (4 mg/L) to produce methyl-nicotinamide and thus release homocysteine. Since homocysteine metabolism is compromised in MTX-treated cells due to folate deprivation, differences between homocysteine concentration in culture media of treated and untreated cells could be explained. Accordingly, we show that preadipocytes and adipocytes can be a source of homocysteine and that the release of this metabolite is dependent of folate status. However, further investigation is necessary to understand the relationship between adipocyte de
novo lipogenesis, insulin resistance and homocysteine to understand the role of
Conclusion
In our study, we present the possibility that low cellular folate availability may result in a higher accumulation of lipids in adipocytes which may denote that there was an increase of the differentiation of preadipocytes into adipocytes. This can be due either to inhibition of lipolysis or to stimulation of de novo lipogenesis, two important processes involved on the regulation of intracellular lipid content. Furthermore, we show that there was a simultaneous decrease in preadipocyte proliferation when folate availability is compromised, which can contribute to adipocyte hypertrophy and dysfunction, since fewer cells would be present to accommodate nutrient surplus. In addition, we demonstrate that folate deprivation can make adipocytes resistant to insulin stimulation, as demonstrated in glucose transport studies. It can also increase homocysteine released by these cells, which supports the idea that the adipose tissue may be a source of homocysteine, especially when there is low folate availability.
In conclusion, our results suggest that folate deprivation can interfere with adipocyte proliferation, differentiation and metabolism and promote the hypertrophic growth of adipocytes, which may contribute to the development of obesity complications and the metabolic syndrome.
References
1. Assaraf YG. Molecular basis of antifolate resistance. Cancer Metastasis Rev. 2007; 26(1):153-81.
2. Rampersaud GC, Kauwell GPA, Bailey LB. Folate: A Key to Optimizing Health and Reducing Disease Risk in the Elderly. J Am Coll Nutr. 2003; 22(1):1-8. 3. Shane B. Folate and vitamin B12 metabolism: overview and interaction with riboflavin, vitamin B6, and polymorphisms. Food And Nutrition Bulletin. 2008; 29(2 Suppl):S5.
4. Depeint F, Bruce WR, Shangari N, Mehta R, O'Brien PJ. Mitochondrial function and toxicity: Role of B vitamins on the one-carbon transfer pathways. Chemico-Biological Interactions. 2006; 163(1-2):113-32.
5. Katula KS, Heinloth AN, Paules RS. Folate deficiency in normal human fibroblasts leads to altered expression of genes primarily linked to cell signaling, the cytoskeleton and extracellular matrix. The Journal of Nutritional Biochemistry. 2007; 18(8):541-52.
6. Hubner RA, Houlston RS. Folate and colorectal cancer prevention. Br J Cancer. 2009; 100(2):233-9.
7. Gregorio V-M, Michelle MM, John MS. Cobalamin, folic acid, and homocysteine. Nutrition Reviews. 2009; 67(s1):S69-S72.
8. Matherly L, Hou Z, Deng Y. Human reduced folate carrier: translation of basic biology to cancer etiology and therapy. Cancer and Metastasis Reviews. 2007; 26(1):111-28.
9. Swierkot J, Szechinski J. Methotrexate in rheumatoid arthritis. Pharmacol Rep. 2006; 58(4):473-92.
10. Wierzbicki AS. Homocysteine and cardiovascular disease: a review of the evidence. Diabetes and Vascular Disease Research. 2007; 4(2):143-49.
11. Ntaios G, Savopoulos C, Grekas D, Hatzitolios A. The controversial role of B-vitamins in cardiovascular risk: An update. Archives of Cardiovascular Diseases. 2009; 102(12):847-54.
12. Onat A, Hergenç G, Küçükdurmaz Z, Can G, Ayhan E, Bulur S. Serum folate is associated with coronary heart disease independently of homocysteine in Turkish men. Clinical Nutrition. 2008; 27(5):732-39.
13. Wolff T, Witkop CT, Miller T, Syed SB. Folic Acid Supplementation for the Prevention of Neural Tube Defects: An Update of the Evidence for the U.S. Preventive Services Task Force. Annals of Internal Medicine. 2009; 150(9):632-39.
14. Mojtabai R. Body mass index and serum folate in childbearing age women. Eur J Epidemiol. 2004; 19(11):1029-36.
15. Mahabir S, Ettinger S, Johnson L, Baer DJ, Clevidence BA, Hartman TJ, et al. Measures of adiposity and body fat distribution in relation to serum folate levels in postmenopausal women in a feeding study. Eur J Clin Nutr. 2007; 62(5):644-50. 16. Hirsch S, Poniachick J, Avendano M, Csendes A, Burdiles P, Smok G, et al. Serum folate and homocysteine levels in obese females with non-alcoholic fatty liver. Nutrition. 2005; 21(2):137-41.
17. Almeda-Valdes P, Cuevas-Ramos D, Aguilar-Salinas CA. Metabolic syndrome and non-alcoholic fatty liver disease. Ann Hepatol. 2009; 8 Suppl 1:S18-24.
18. Ortega RM, Oacute, Pez-Sobaler AM, Andr, Eacute, S P, et al. Folate Status in Young Overweight and Obese Women: Changes Associated with Weight
Reduction and Increased Folate Intake. Journal of Nutritional Science and Vitaminology. 2009; 55(2):149-55.
19. Stein CJ, Colditz GA. The Epidemic of Obesity. Journal of Clinical Endocrinology and Metabolism. 2004; 89(6):2522-25.
20. Galic S, Oakhill JS, Steinberg GR. Adipose tissue as an endocrine organ. Molecular and Cellular Endocrinology. 2009; 316(2):129-39.
21. Okada T, Nakai M, Maeda H, Hosokawa M, Sashima T, Miyashita K. Suppressive Effect of Neoxanthin on the Differentiation of 3T3-L1 Adipose Cells. Journal of Oleo Science. 2008; 57(6):345-51.
22. Do G-M, Choi M-S, Kim H-J, Woo M-N, Lee M-K, Jeon S-M. Soy pinitol acts partly as an insulin sensitizer or insulin mediator in 3T3-L1 preadipocytes. Genes & Nutrition. 2008; 2(4):359-64.
23. Horie T, Ono K, Kinoshita M, Nishi H, Nagao K, Kawamura T, et al. TG-interacting factor is required for the differentiation of preadipocytes. J Lipid Res 2008; 49(6):1224-34.
24. Teixeira D, Pestana D, Faria A, Calhau C, Azevedo I, Monteiro R. Modulation of Adipocyte Biology by Delta(9)-Tetrahydrocannabinol. Obesity (Silver Spring). Epub 2010;
25. Papazisis KT, Geromichalos GD, Dimitriadis KA, Kortsaris AH. Optimization of the sulforhodamine B colorimetric assay. Journal of Immunological Methods. 1997; 208(2):151-58.
26. Miranda CL, Stevens JF, Helmrich A, Henderson MC, Rodriguez RJ, Yang YH, et al. Antiproliferative and cytotoxic effects of prenylated flavonoids from hops (Humulus lupulus) in human cancer cell lines. Food Chem Toxicol. 1999; 37(4):271-85.
27. Faria A, Pestana D, Azevedo J, Martel F, de Freitas V, Azevedo I, et al. Absorption of anthocyanins through intestinal epithelial cells - Putative involvement of GLUT2. Mol Nutr Food Res. 2009; 53(11):1430-7.
28. Bradford MM. A rapid and sensitive method for the quantitation of microgram quantities of protein utilizing the principle of protein-dye binding. Anal Biochem. 1976; 72:248-54.
29. Bergmeyer HU, Bernt E. Lactate dehydrogenase. In: Bergmeyer, H.U., ed. Methods in Enzimatic Analysis. New York: Academic Press.1974. pp 574-9.
30. Recommended methods for the determination of four enzymes in blood. Scand J Clin Lab Invest. 1974; 33(4):291-306.
31. Brengauz-Breitmann M, Friedman E, Savion S, Torchinsky A, Fein A, Toder V. Involvement of NF-[kappa]B in the response of embryonic cells to Methotrexate. Reproductive Toxicology. 2006; 22(3):469-78.
32. Savion S, Shtelman E, Orenstein H, Torchinsky A, Fein A, Toder V. Bax-associated mechanisms underlying the response of embryonic cells to methotrexate. Toxicology in Vitro. 2009; 23(6):1062-68.
33. Manickam E, Sinclair A, Cameron-Smith D. Suppressive actions of eicosapentaenoic acid on lipid droplet formation in 3T3-L1 adipocytes. Lipids in Health and Disease. 2010; 9(1):57.
34. Huang S, Czech MP. The GLUT4 Glucose Transporter. Cell Metabolism. 2007; 5(4):237-52.
35. Monteiro R, Calhau C, Martel F, Faria A, Mateus N, Azevedo I. Modulation of MPP+ uptake by tea and some of its components in Caco-2 cells. Naunyn Schmiedebergs Arch Pharmacol. 2005; 372(2):147-52.
36. Casanueva E, Drijanski A, Fernández-Gaxiola AC, Meza C, Pfeffer F. Folate deficiency is associated with obesity and anemia in Mexican urban women. Nutrition Research. 2000; 20(10):1389-94.
37. Karatela RA, Sainani GS. Plasma homocysteine in obese, overweight and normal weight hypertensives and normotensives. Indian Heart J. 2009; 61(2):156-9.
38. Gallistl S, Sudi K, Mangge H, Erwa W, Borkenstein M. Insulin is an independent correlate of plasma homocysteine levels in obese children and adolescents. Diabetes Care. 2000; 23(9):1348-52.
39. Wellen KE, Hotamisligil GS. Obesity-induced inflammatory changes in adipose tissue. J Clin Invest. 2003; 112(12):1785-8.
40. de Ferranti S, Mozaffarian D. The perfect storm: obesity, adipocyte dysfunction, and metabolic consequences. Clin Chem. 2008; 54(6):945-55.
41. Bays HE, Gonzalez-Campoy JM, Bray GA, Kitabchi AE, Bergman DA, Schorr AB, et al. Pathogenic potential of adipose tissue and metabolic consequences of adipocyte hypertrophy and increased visceral adiposity. Expert Rev Cardiovasc Ther. 2008; 6(3):343-68.
42. Sethi JK, Vidal-Puig AJ. Thematic review series: Adipocyte Biology. Adipose tissue function and plasticity orchestrate nutritional adaptation. J Lipid Res. 2007; 48(6):1253-62.
43. Tchoukalova YD, Koutsari C, Karpyak MV, Votruba SB, Wendland E, Jensen MD. Subcutaneous adipocyte size and body fat distribution. Am J Clin Nutr. 2008; 87(1):56-63.
44. Joel MK. Toward a better understanding of methotrexate. Arthritis and Rheumatism. 2004; 50(5):1370-82.
45. Bangert CA, Costner MI. Methotrexate in dermatology. Dermatol Ther. 2007; 20(4):216-28.
46. Hutchinson SA, Scammells PJ. A(1) adenosine receptor agonists: medicinal chemistry and therapeutic potential. Curr Pharm Des. 2004; 10(17):2021-39. 47. Dhalla AK, Chisholm JW, Reaven GM, Belardinelli L. A1 adenosine receptor: role in diabetes and obesity. Handb Exp Pharmacol. 2009; (193):271-95. 48. Jaworski K, Sarkadi-Nagy E, Duncan RE, Ahmadian M, Sul HS. Regulation of triglyceride metabolism. IV. Hormonal regulation of lipolysis in adipose tissue. Am J Physiol Gastrointest Liver Physiol. 2007; 293(1):G1-4.
49. Lam TY, Seto SW, Au AL, Poon CC, Li RW, Lam HY, et al. Folic acid supplementation modifies beta-adrenoceptor-mediated in vitro lipolysis of obese/diabetic (+db/+db) mice. Exp Biol Med (Maywood). 2009; 234(9):1047-55. 50. Vazquez-Vela ME, Torres N, Tovar AR. White adipose tissue as endocrine organ and its role in obesity. Arch Med Res. 2008; 39(8):715-28.
51. Lee H, Kim HJ, Kim J-m, Chang N. Effects of dietary folic acid supplementation on cerebrovascular endothelial dysfunction in rats with induced hyperhomocysteinemia. Brain Research. 2004; 996(2):139-47.
52. Setola E, Monti LD, Galluccio E, Palloshi A, Fragasso G, Paroni R, et al. Insulin resistance and endothelial function are improved after folate and vitamin B12 therapy in patients with metabolic syndrome: relationship between homocysteine levels and hyperinsulinemia. Eur J Endocrinol. 2004; 151(4):483-89.
53. Golbahar J, Aminzadeh MA, Kassab SE, Omrani GR.
Hyperhomocysteinemia induces insulin resistance in male Sprague-Dawley rats. Diabetes Research and Clinical Practice. 2007; 76(1):1-5.
54. Ntaios G, Savopoulos C, Grekas D, Hatzitolios A. The controversial role of B-vitamins in cardiovascular risk: An update. Arch Cardiovasc Dis. 2009; 102(12):847-54.
55. Riederer M, Erwa W, Zimmermann R, Frank S, Zechner R. Adipose tissue as a source of nicotinamide N-methyltransferase and homocysteine. Atherosclerosis. 2009; 204(2):412-7.