A Work Project presented as part of the requirements for the Award of a Master’s Degree in Economics from the NOVA School of Business and Economics
WHAT DRIVES THE ISSUANCE OF GREEN BONDS – WHAT COUNTRY CHARACTERISTICS HAVE AN EFFECT ON THE ISSUANCE OF GREEN BONDS? Julia Maria Menge Rodrigues
A Project carried out on the Master’s in Economics Program, under the supervision of: Maria Antonieta Cunha e Sá and João Pedro Pereira
Lisbon, Portugal January 2019
WHAT DRIVES THE ISSUANCE OF GREEN BONDS – WHAT COUNTRY CHARACTERISTICS HAVE AN EFFECT ON THE ISSUANCE OF GREEN BONDS? Abstract
We perform a two-step analysis to (i) understand what country characteristics influence the probability that green bonds have been issued in it, and (ii) evaluate what country characteristics affect the volume of green bonds issued in it. By running a logistic regression with 119 countries, we find evidence that the level of development, environmental preferences, transparency and quality of the financial markets, and absence of corruption have a positive effect on the probability of green bonds having been issued in a country. Furthermore, our results suggest that conditional on issuance, environmental preferences also have a positive effect on the volume issued in a country.
1 1. Introduction
The transition to a low-carbon, cleaner and more sustainable economy has already begun. While governments are increasingly taking policy actions and investing in those aspects, businesses are incorporating sustainability into their strategies, and the population is becoming more aware and progressively engaging with this cause.
Nevertheless, there are still many challenges associated with this transition, and they are related to the complexity of the interactions between human society’s activities and the environment. Nature provides us with an extensive diversity of ecosystem services, such as the provision of food and clean water, and climate regulation. However, over the past centuries, the growth of the human population and the intensification of its activities has increased the pressure society imposes on the environment, thus threatening the provision of these services with a negative impact on the welfare of current and future populations (Heal, 2000).
Because environmental quality is a public good, the costs imposed by human activities on the environment are typically not fully internalised as markets for the related products and services do not work properly, implying that prices are distorted below its social value. This makes the transition towards a more sustainable economy all the more challenging, as society must come up with innovative ways of factoring in nature – in general – and ecosystem services – in particular – into the traditional economic and financial systems.
Green bonds are one solution which can help to promote this transition. They differ from regular bonds only regarding their proceeds, which are specifically used to finance green projects (i.e. projects that have positive environmental impacts). These bonds should usually be aligned with the four components of the Green Bond Principles (e.g. use of proceeds, process for project evaluation and selection, management of proceeds, and reporting). However, compliance is voluntary and external reviews although recommended are not mandatory (Green Bond
2
Principles, 2018). Moreover, there is still debate regarding the different shades of green – or the different levels of environmental quality a project can have (Cicero, 2015).
The first green bond was issued in 2007 by the European Investment Bank (EIB). Since then, this market has grown significantly and in 2017 issuance reached US$ 155.5 billion worldwide (Climate Bonds Initiative, 2018). There is still a lot of potential for further growth as current estimates suggest that the needed annual investments in green infrastructures are projected to reach US$ 5.7 trillion in 2020 (World Economic Forum, 2013). However, this market is not yet globally spread. In 2017, issuances were dominated by the US, China and France which accounted for 56% of the total (Climate Bonds Initiative, 2018).
Transitioning to a sustainable economy and mitigating climate change are global challenges. In 2015, the Paris Agreement was ratified by more than 180 countries committing to combat climate change and adapt to its effects (UN, 2018). Still, the efforts undertaken differ significantly among countries as does the climate risk each country faces.
Until now, green bonds – either government or corporate – have been issued in 44 countries (Bloomberg, 2018).1 Even if there is some agreement regarding the challenges that developing countries face when trying to transition to a more sustainable economy and to fund climate mitigation and adaptation (World Bank, 2018), there are some puzzling aspects regarding how the green bonds’ market is developing worldwide that make the analysis performed in this study relevant.
While green bond issuance has occurred in 26 out of 36 OECD countries, some small states with a not-so-strong economy are among the 44 in which green bonds have been issued – including Fiji, Mauritius and Costa Rica. Meanwhile, China – an emerging market with a poor
1 We here sum up issuances by Cayman, British Virgin Islands, Bermuda and England as issuances of the United Kingdom and we consider Taiwan and Hong Kong issuances within China's. Issuances by multilateral organisations, such as the European Investment Bank and the World Bank, which are not country-specific, were not included in the analysis.
3
track record on most environmental issues – has been the second largest issuer in 2017, behind only the USA.
In this study, we aim first at contributing to understanding what country-specific characteristics are driving the usage of this specific instrument – that is: why the issuance of green bonds has taken place in some countries and not in others – and, second, conditional on green bonds having been issued, to explain how country-specific characteristics may influence the volume issued.
Through our empirical analysis, we find evidence suggesting that a country’s environmental preferences, the transparency and quality of its financial markets, its stage of development and its level of corruption have a significative effect on the likelihood of green bond having been issued in the country. Our results also point toward a lack of correlation between the climate risk faced by a country and the issuance of green bonds.
In other words, we find that green bonds are more likely to have been issued in countries which are more developed, have stronger environmental preferences, have more transparent and better-quality financial markets and have lower levels of corruption. Moreover, a country’s level of exposure to climate risk does not seem to affect the likelihood of green bond issuance. Finally, when analysing for countries in which green bonds have been issued, we find evidence that – among the characteristics evaluated – only a country's environmental preferences have a significant effect on the volume issued.
Through understanding which country characteristics may have driven the issuance of green bonds, the evidence found in this study can help policymakers and international organisations to better shape the mechanisms to incentivise the issuance of green bonds and thus fund climate mitigation and the transition to a more sustainable economy.
4
The remainder of this study is organised as follows. In section 2, a literature review on the topic of green bonds and investors’ preferences is presented. Section 3 describes the framework of the analysis performed, section 4 the data used, and section 5 the empirical methodology applied. Then, section 6 presents the empirical results, and section 7 the limitations and possibilities for further research. Finally, section 8 offers conclusions.
2. Literature Review
Green bonds are relatively new instruments, and although the market, as well as the interest in the subject, has been growing consistently over the last decade, the literature on green bonds is still in its early days.
Much of the growth in the green bond market is due to the growing interest that investors show for these assets – an increased demand. Investors are becoming more aware of the benefits created by green projects (Shishlov, 2016) and of the risk that climate change can impose on more traditional financial assets (OECD, 2015), thus anticipating more stringent climate policies in the future. According to Morgan Stanley (2016), 55% of investors state they are interested in sustainable investing.
On the supply side, governments and corporations have multiple reasons for issuing green bonds. Most of the climate adaptation and mitigation projects are expected to be implemented by cities (Banga, 2018), which means that local governments must obtain the funds to invest in them. Green bonds can serve as a compelling solution for this. Moreover, by creating an institutional framework for the issuance of green bonds and setting the example, governments can influence growth in this market.
Meanwhile, having a green image can enhance corporations' value (Hamilton, 2011) which makes it attractive for businesses to consider issuing green bonds as part of its corporate sustainability strategy. Green bonds issuance – like other pro-green and sustainable strategies
5
that companies can adopt (e.g. corporate social responsibility, carbon offsetting, climate mitigation, internal carbon pricing) – can also help companies hedge against compliance and climate risks in the future (Pinkse, 2007).
While the green bond market has been growing exponentially over the last few years, its size remains tiny when compared to the total fixed-income market (Franklin, 2016). Moreover, issuance has been uneven between different regions and markets, and in many developing countries it remains incipient (Banga, 2018). While US$ 17 billion of the proceeds from green bonds were directed to cities in developed economies, only US$ 2.2 billion were directed to cities in developing economies (Climate Bonds Initiative, 2016).
A significant share of the existing literature on green bonds focuses on specific financial aspects of green bonds. Zerbib (2018) uses green bonds as an instrument to identify the effect that the green label has on bond market prices. The author uses matching to compare green bonds with counterfactual conventional bonds and obtains results that point to a negative green bond premium of 2 base points (bps) – meaning that the yield of a green bond is lower than that of the counterfactual conventional bond. Similarly, Baker et al. (2018) analyse the USA bond market based on a sample of municipal bonds. Likewise, the authors find that green bonds are issued with lower yields when compared to regular bonds.
Ehlers and Packer (2017) and Hachenberg and Schiereck (2018) also find evidence of a negative green bond premium – 18 bps and 1 bp respectively – by using an approach similar to Zerbib (2017) but with a more specific focus – the primary market between 2014 and 2017 and the secondary market between 2015 and 2016, respectively. Moreover, Barclays (2015) and Bloomberg (2017) focus on the secondary market and similarly find evidence pointing towards a negative green bond premium.
6
Meanwhile, studies from the HSBC (2016), the Climate Bonds Initiative (2017), the OECD (2017), Petrova (2016) and Shishlov (2016) focus on comparing the difference in yield at issuance (primary market) between conventional and regular bonds and find no evidence of a significative discrepancy. Karpf and Mandel (2018) obtain evidence of a positive green bond premium – meaning that green bonds are issued with higher yields – when controlling for the number of transactions as a proxy for bond’s liquidity.
Karpf and Mandel (2017) compare the returns on green bonds to that of regular bonds and find evidence that returns on the latest are on average higher. Although they mention that this spread can be explained by characteristics that are issuer or bond specific, they conclude that green bonds are traded at lower prices than what could be expected. Ley (2017) performs a comparative analysis between 359 green bonds and 1291 regular bonds and the author’s results provide evidence of a better performance in terms of financial returns for the green bonds. Gyura (2017) analyses the existing approaches for green bonds sustainability ratings and points out that there is room for improvements in those ratings, with increased competition between providers being key to enable this development.
Chiesa and Barua (2018) investigate which characteristics can affect the issue size of green bonds, and how do these differ across emerging and non-emerging markets. The sample consists of green bond issuing firms, and the author includes a series of bond-, issuer-, economic- and market-specific characteristics in the model. The study finds evidence that bonds issued in emerging markets are larger in volume than those issued in non-emerging markets. While the existing literature on green bonds has been thoroughly scrutinised, the authors were not able to find studies proposing a broader analysis by comparing the issuance of green bonds between different countries and the drivers of this issuance. This study builds much on findings from Banga (2018) and aims at filling this gap in the literature.
7
Banga (2018) uses a qualitative approach to identify the drivers of the green bond market and the main barriers to the growth of this market, with a specific focus on developing countries. The author identifies the key obstacles to the development of the green bond market, namely: the high transaction costs, the minimum issuing size, and the lack of institutional arrangements. Throughout the study, the author frequently emphasises the difference in issuance between the different countries.
Based on this literature review, we may conclude that to date no study has addressed the issues discussed in this paper from an empirical perspective. The contribution of this study to the literature is twofold: (i) to identify what country characteristics are driving the issuance of green bonds, and (ii) conditional on the issuance of green bonds to understand what features drive the volume of green bonds issued.
3. Analytical Framework
We begin the analysis by evaluating the effect of specific characteristics on whether green bonds have or not been issued in a country. Based on an extensive literature review followed by a data-driven approach, we estimate a model which predicts how likely it is that green bonds have been issued in a country, given its specific characteristics. For the countries in which there has been green bond issuance, we also analyse the effect these characteristics can have on the volume of green bonds issued. In other words, given that a country has issued green bonds, what attributes have an effect on the volume issued.
Specifically, our two research questions are:
RQ1. What country-specific characteristics have an effect on the probability that green bonds have been issued in a country?
RQ2. Considering that green bonds have been issued in a country, what country-specific characteristics may explain the volume of green bonds that have been issued in it?
8
Thus, we are testing whether a selection of characteristics has an effect on the likelihood of green bond issuance in the different countries and if they can also influence the volume issued. For the purpose of this study, we do not differentiate between corporate and government green bonds. Moreover, due to the nature of our database, we also make no distinction regarding when the green bonds were issued. Because green bonds are a relatively recent instrument and because bonds, in general, are long-term assets, a yearly comparison or a panel analysis at this point would not be much informative.
To answer both RQ1 and RQ2, we run econometric models in which the issuance of green bonds and the volume of green bonds issued are the dependent variables, respectively. The independent variables used in the regressions are country characteristics that provide information regarding its environmental preferences, its financial markets, its stage of development, its level of corruption, and its exposure to climate risk.
The variables used to test these effects are detailed in section 4.2.3. Explanatory Variables. All variables used in this study are country specific.
4. Data
4.1. Sample Description.
To answer RQ1, we include a broad sample of 119 countries for which we were able to obtain sufficient data to run the regression - which represents 61% of the world’s existing countries in 2018 (Worldometer, 2018). From these 119 countries, 40 have had green bonds issuance (34%) while 79 haven’t. To answer RQ2, we consider only these 40 countries in which green bonds have been issued. The countries included in both analyses are listed in the Annexes.
In this study, we have included issuances from Taiwan and Hong Kong into China's and issuances from Cayman, Bermuda and the British Virgin Islands into the UK's. While green bond data was available separately for these regions, this was not the case for most of the
9
independent variables considered, which is why we chose to aggregate. Furthermore, Mauritius, Luxembourg, Fiji and the United Arab Emirates are the only countries in which there has been green bond issuance which were not included in the sample due to the lack of data.
4.2. Variable Description
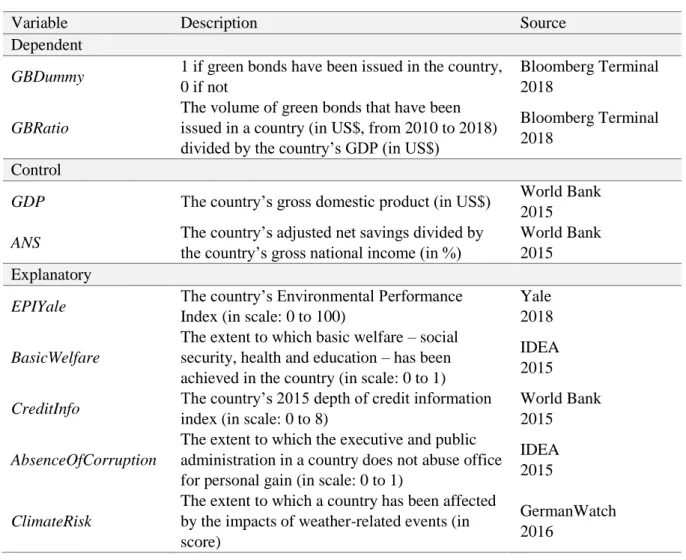
Table 1 summarises the variables employed in the models.
Table 1 - Description of the Variables
Variable Description Source
Dependent
GBDummy 1 if green bonds have been issued in the country, 0 if not
Bloomberg Terminal 2018
GBRatio
The volume of green bonds that have been issued in a country (in US$, from 2010 to 2018) divided by the country’s GDP (in US$)
Bloomberg Terminal 2018
Control
GDP The country’s gross domestic product (in US$) World Bank
2015
ANS The country’s adjusted net savings divided by
the country’s gross national income (in %)
World Bank 2015 Explanatory
EPIYale The country’s Environmental Performance
Index (in scale: 0 to 100)
Yale 2018 BasicWelfare
The extent to which basic welfare – social security, health and education – has been achieved in the country (in scale: 0 to 1)
IDEA 2015 CreditInfo The country’s 2015 depth of credit information
index (in scale: 0 to 8)
World Bank 2015 AbsenceOfCorruption
The extent to which the executive and public administration in a country does not abuse office for personal gain (in scale: 0 to 1)
IDEA 2015
ClimateRisk
The extent to which a country has been affected by the impacts of weather-related events (in score)
GermanWatch 2016
4.2.1. Dependent Variables
To answer RQ1, we build a model in which the dependent variable is a binary variable which takes the value of 1 for countries in which green bonds (corporate, government or both, as well as both active and mature bonds) have been issued or 0 for countries in which no green bond was issued. This variable is named GBDummy. To generate this variable, we use data extracted
10
from the Bloomberg Terminal for all bonds issued between 2010 and November 2018 with the green bond use of proceeds filter. We use the country of issuance information available in the bond database to attribute values 1 or 0 for each country in the sample.
Also using the same Bloomberg database, we created the GBVolume variable. This variable consists of a sum of the volume of all green bonds issued in each country between 2010 and November 2018 in US$. Although the first green bond was issued in 2007, the issuer was the EIB which is a supranational institution. The first country-specific green bond was issued only in 2010. For the purpose of this study, all green bonds listed in the Bloomberg database as supranational (SNAT) were not included, as they are not country specific.
Finally, to answer RQ2, we created the GBRatio variable by dividing the GBVolume variable by the country gross domestic product (GDP) in 2015, using World Bank data, as follows.
𝐺𝐵𝑅𝑎𝑡𝑖𝑜 = 𝐺𝐵𝑉𝑜𝑙𝑢𝑚𝑒
𝐺𝐷𝑃 (1) We used this approach to adjust the green bond volume to the size of each country’s economy and thus to eliminate a potential bias.
We chose to use the sum of the volume of green bonds instead of using data available from the latest year or running a panel analysis because issuance has been uneven across different years for most countries. This is to be expected because (i) this is an instrument still in its early years, and (ii) bonds are long-term debt securities, with maturities often longer than ten years, which can make a yearly assessment inadequate.
We decided to use the ratio instead of the volume to eliminate the effects of a country's economy size of our dependent variable. Also, we chose not to use the total volume of bonds (regular plus green) for this adjustment because we want to capture the effect of financial markets characteristics in the model. For this purpose, the use of the total volume of bonds would create
11
an endogeneity issue, as the model could be capturing the independent variables' effect on the full bond market and not specifically the green bond market.
Finally, we chose to use data from 2015 because the World Bank database contains many missing values for more recent years for either GDP or the other variables which were also extracted from this database.
4.2.2. Control Variables
Each country’s 2015 gross domestic product (GDP) in US$ was included to control for the size of its economy. Moreover, the countries’ 2015 adjusted net savings as a percentage of gross national income (ANS) were included in the model as this measure is deemed to be the leading economic indicator of weak sustainability (Heal, 2012). The adjusted net savings measure is calculated by adding education expenditure to the net national savings and then subtracting energy, mineral and net forest depletion, as well as damages from carbon dioxide and particulate emissions. The source for both GDP and ANS data is The World Bank.
4.2.3. Explanatory Variables
In our analysis, we included five explanatory variables for which we are assessing the effect on green bond issuance. The variables are indicators of a country's environmental preferences, financial markets condition, development stage, corruption level, and exposure to climate risk. To assess a country’s environmental preferences, we used the Environmental Performance Index (EPIYale) calculated by the University of Yale in collaboration with the World Economic Forum. The index allows a quantitative assessment of how environmental performance differs between various countries at a given point in time. Moreover, the index is updated biannually, which allows for an observation of the development of countries’ environmental performance over time. The first version of the index was published in 2006, and the more recent update available is the 2018 publication – which was the one used in this study.
12
The index is calculated on a scale from 0 to 100, with 0 being the worst and 100 the best. It is calculated through a weighted average of twenty-four indicators across ten categories (air quality, water quality, heavy metals, biodiversity & habitat, forests, fisheries, climate & energy, air pollution, water resources and agriculture).
In this study, we are considering EPIYale as a proxy for a country’s environmental preferences – the assumption is that a country’s environmental performance and its environmental preferences are strongly correlated. Hence, by estimating the coefficient for EPIYale in the model, we are trying to capture if a country’s environmental preferences have an effect on the issuance of green bonds.
To assess the condition of a country’s financial markets, we used 2015 data on the Depth of Credit Information Index (CreditInfo) published by The World Bank. The index is calculated in a scale from 0 to 8, with 0 being the lowest and 8 the highest and it measures the availability and quality of credit information available.
In this study, we are considering CreditInfo as a proxy for the transparency and quality of the financial markets in a country. Thus, by estimating the coefficient for CreditInfo in the model, we are trying to perceive if the transparency and quality of a country’s financial markets influence the issuance of green bonds.
To assess the stage of development and life conditions of a country, we used 2015 data on the Basic Welfare indicator (BasicWelfare) published by IDEA – The International Institute for Democracy and Electoral Assistance. The gauge is calculated in a scale from 0 to 1, with 0 being the lowest and 1 the highest and it measures the extent to which basic welfare – social security, health and education – has been achieved in the country.
13
In this study, we use BasicWelfare as a proxy for the level of development in a country. Thus, by estimating the coefficient for BasicWelfare in the model, we are trying to perceive if a country’s stage of development influences the issuance of green bonds.
To assess a country’s level of corruption, we used 2015 data on the Absence of Corruption indicator (AbsenceOfCorruption) published by IDEA – The International Institute for Democracy and Electoral Assistance. The indicator is calculated in a scale from 0 to 1, with 0 being the lowest (lowest absence of corruption, meaning more corruption) and 1 the highest (highest absence of corruption, which means less corruption) and it measures the extent to which the executive and public administration in a country does not abuse office for personal gain.
By estimating the coefficient for AbsenceOfCorruption in the model, we are trying to perceive if a country’s level of corruption influences the issuance of green bonds.
Finally, to assess the level of risk to the effects of climate change faced by each country, we used the 2016 Global Climate Risk Index (ClimateRisk), published by the GermanWatch. The index provides a quantitative gauge that measures to what extent countries and regions have been affected by the impacts of weather-related events (e.g. storms, floods, heat waves). By estimating the coefficient for ClimateRisk in the model, we are trying to perceive if a country’s level of exposure to climate risk influences the issuance of green bonds.
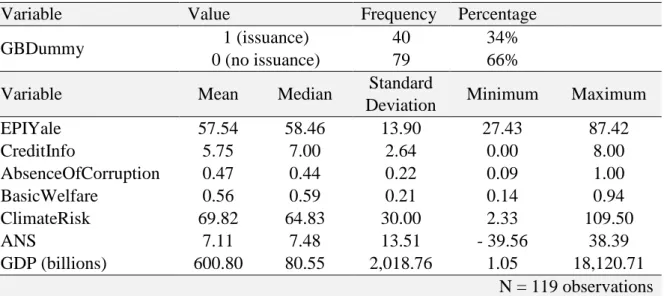
4.3. Descriptive Statistics
Tables 2 and 3 summarise the descriptive statistics for the employed variables. Table 2 includes all of the 119 countries included in the first-step regression (RQ1) and Table 3 includes only the 40 countries included in the second-step regression (RQ2), for which GBDummy is equal to 1. Annexes I, II and III list the countries in which green bonds have been issued, the countries
14
included in the first-step regression and the countries included in the second-step regression, respectively.
Table 2- Descriptive Statistics for the First-Step Regression
Variable Value Frequency Percentage
GBDummy 1 (issuance) 40 34%
0 (no issuance) 79 66%
Variable Mean Median Standard
Deviation Minimum Maximum
EPIYale 57.54 58.46 13.90 27.43 87.42 CreditInfo 5.75 7.00 2.64 0.00 8.00 AbsenceOfCorruption 0.47 0.44 0.22 0.09 1.00 BasicWelfare 0.56 0.59 0.21 0.14 0.94 ClimateRisk 69.82 64.83 30.00 2.33 109.50 ANS 7.11 7.48 13.51 - 39.56 38.39 GDP (billions) 600.80 80.55 2,018.76 1.05 18,120.71 N = 119 observations
Table 3 - Descriptive Statistics for the Second-Step Regression
Variable Mean Median Standard
Deviation Minimum Maximum GBRatio 0.0082 0.0042 0.0097 0.0001 0.0446 EPIYale 68.32 70.26 11.95 30.57 87.42 CreditInfo 7.08 7.00 0.89 5.00 8.00 AbsenceOfCorruption 0.65 0.66 0.21 0.11 1.00 BasicWelfare 0.74 0.79 0.17 0.27 0.94 ClimateRisk 66.38 62.59 25.22 18.33 109.50 ANS 11.20 10.24 7.49 -7.50 34.14 GDP (billions) 1,581.98 479.21 3,280.74 22.57 18,120.71 N = 40 observations
From comparing the values in Tables 2 and 3, we can observe that the mean values of EPIYale,
CreditInfo, BasicWelfare, AbsenceOfCorruption, GDP and ANS are higher when considering
only the countries in which there has been green bond issuance. 5. Methodology
15
In the first-step, to answer RQ1, we estimate the following model:
𝐺𝐵𝐷𝑢𝑚𝑚𝑦 = 𝛽0+ 𝛽1𝐸𝑃𝐼𝑌𝑎𝑙𝑒 + 𝛽2𝐵𝑎𝑠𝑖𝑐𝑊𝑒𝑙𝑓𝑎𝑟𝑒 + 𝛽3𝐶𝑟𝑒𝑑𝑖𝑡𝐼𝑛𝑓𝑜 + (2)
𝛽4𝐴𝑏𝑠𝑒𝑛𝑐𝑒𝑜𝑓𝐶𝑜𝑟𝑟𝑢𝑝𝑡𝑖𝑜𝑛 + 𝛽5𝐶𝑙𝑖𝑚𝑎𝑡𝑒𝑅𝑖𝑠𝑘 + 𝛽6𝐺𝐷𝑃 + 𝛽7𝐴𝑁𝑆
Because GBDummy is a dichotomous variable, we run a binary logistic regression to estimate this model.2 The coefficients on the explanatory variables (β1, β2, β3, β4 and β5) measure the effects we are trying to estimate.
In the second-step, to answer RQ2, we estimate the following model:
𝐺𝐵𝑅𝑎𝑡𝑖𝑜 = 𝛽0+ 𝛽1𝐸𝑃𝐼𝑌𝑎𝑙𝑒 + 𝛽2𝐵𝑎𝑠𝑖𝑐𝑊𝑒𝑙𝑓𝑎𝑟𝑒 + 𝛽3𝐶𝑟𝑒𝑑𝑖𝑡𝐼𝑛𝑓𝑜 + (3)
𝛽4𝐴𝑏𝑠𝑒𝑛𝑐𝑒𝑜𝑓𝐶𝑜𝑟𝑟𝑢𝑝𝑡𝑖𝑜𝑛 + 𝛽5𝐶𝑙𝑖𝑚𝑎𝑡𝑒𝑅𝑖𝑠𝑘 + 𝛽6𝐺𝐷𝑃 + 𝛽7𝐴𝑁𝑆
Because GBRatio is a continuous variable, we run an ordinary least squares (OLS) regression to estimate this model. The coefficients on the explanatory variables (β1, β2, β3, β4 and β5) measure the effects we are trying to estimate.
We ran a univariate analysis through a series of Spearman correlation tests to investigate the correlation between the variables. The results are presented in Annex V.
6. Empirical Results
6.1. Main Findings
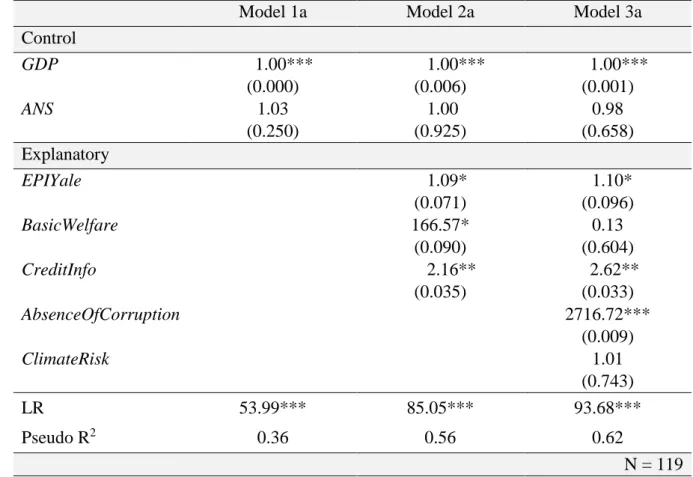
6.1.1. First-Step Analysis
Table 4 summarises the results of the binary logistic regression performed in the first-step analysis to evaluate the effect of the explanatory variables in the dependent variable –
GBDummy. The coefficients should be interpreted in terms of odds ratio. Thus, a coefficient
greater than 1 for an explanatory variable means that its effect on the outcome variable is
2 Because we could here use either probit or logit, we tested both regressions and obtained very similar results. We chose to use logistic because it allows for an easier interpretation of coefficients in terms of odds ratios.
16
positive – the higher the value of the explanatory variable, the greater the probability of green bonds having been issued in the country.
Table 4 - Summarized results of the binary logistic regression (first-step)
Model 1a Model 2a Model 3a
Control GDP 1.00*** (0.000) 1.00*** (0.006) 1.00*** (0.001) ANS 1.03 (0.250) 1.00 (0.925) 0.98 (0.658) Explanatory EPIYale 1.09* (0.071) 1.10* (0.096) BasicWelfare 166.57* (0.090) 0.13 (0.604) CreditInfo 2.16** (0.035) 2.62** (0.033) AbsenceOfCorruption 2716.72*** (0.009) ClimateRisk 1.01 (0.743) LR 53.99*** 85.05*** 93.68*** Pseudo R2 0.36 0.56 0.62 N = 119 Odds ratio reported * significant at 10% ** significant at 5%
*** significant at 1%
Model 1a includes only the control variables – GDP and ANS. Model 2a includes three explanatory variables: EPIYale for environmental preferences, BasicWelfare for development, and CreditInfo for transparency and quality of the financial system. Model 3a further includes
AbsenceOfCorruption and ClimateRisk.
The Pseudo R2 increases consistently when we add more variables to the models and has a value of 0.36 for Model 1a, 0.56 for Model 2a, and 0.62 for Model 3a. The last result indicates that 62% of the variation in the outcome variable – issuance/no issuance of green bonds – can be explained by the proposed model.
17
In all of the models we ran, the odds ratio for GDP is statistically significant and has a value of 1.00, meaning that an increase in GDP has no effect in the probability of green bonds having been issued in a country.
In Model 2a, EPIYale, BasicWelfare 3 and CreditInfo have odds ratios that are statistically significant and greater than 1 – suggesting that stronger environmental preferences, higher stage of development and increased quality and transparency in the financial markets increase the probability of green bonds having been issued in a country.
In Model 3a, EPIYale and CreditInfo remain significant. Furthermore, AbsenceofCorruption 3 has an odds ratio that is significant and higher than 1 – suggesting that lower levels of corruption increase the likelihood of green bond issuance in a country. In this model, BasicWelfare becomes not significant. However, this does not necessarily weaken the hypothesis that the stage of development has a significant effect on green bond issuance because
AbsenceOfCorruption is a variable that is also strongly associated with the level of
development.
Finally, the odds ratio coefficient on ClimateRisk is not significant, suggesting that there is not an association between the risk of climate change faced by a country and whether or not green bonds have been issued in the country.
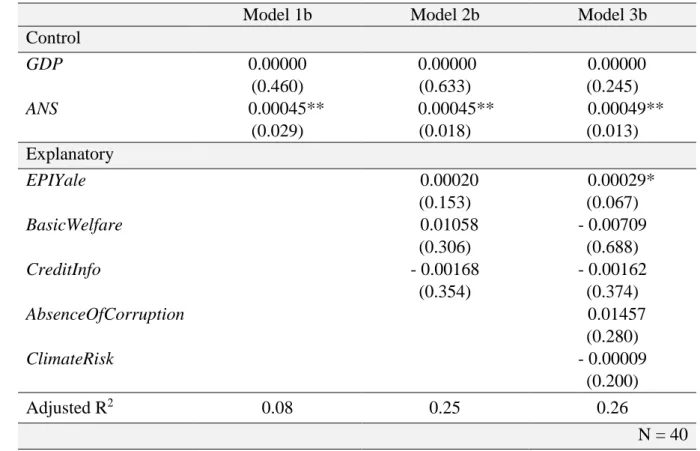
6.1.2. Second-Step Analysis
Table 5 summarises the results of the OLS regression performed in the second-step analysis to evaluate the effect of the explanatory variables in the dependent variable (GBRatio).
Model 1b includes only the control variables (GDP and ANS). Model 2b includes three explanatory variables: EPIYale for environmental preferences, BasicWelfare for development,
3 The coefficients on BasicWelfare and AbsenceOfCorruption are high because the variables are expressed on a scale of 0 to 1.
18
and CreditInfo for transparency and quality of the financial system. Model 3b further includes
AbsenceOfCorruption and ClimateRisk.
The Adjusted R2 increases consistently when we add more variables to the models and has a value of 0.08 for Model 1b, 0.25 for Model 2b, and 0.26 for Model 3b, meaning that 26% of the variation in the outcome variable – adjusted volume of green bonds issued – can be explained by the proposed model.
Table 5 - Summarized results of the OLS regression (second-step)
Model 1b Model 2b Model 3b
Control GDP 0.00000 (0.460) 0.00000 (0.633) 0.00000 (0.245) ANS 0.00045** (0.029) 0.00045** (0.018) 0.00049** (0.013) Explanatory EPIYale 0.00020 (0.153) 0.00029* (0.067) BasicWelfare 0.01058 (0.306) - 0.00709 (0.688) CreditInfo - 0.00168 (0.354) - 0.00162 (0.374) AbsenceOfCorruption 0.01457 (0.280) ClimateRisk - 0.00009 (0.200) Adjusted R2 0.08 0.25 0.26 N = 40 Average marginal effects reported * significant at 10% ** significant at 5%
*** significant at 1%
The coefficients in Table 5 are expressed in terms of average marginal effects, meaning that for a unit increase in the explanatory variable, the volume of green bonds issued in the country increases on average by the factor expressed by the coefficient, ceteris paribus.
19
In all of the models we ran, the marginal effect for ANS is statistically significant and has a positive value, meaning that a country with higher ANS has issued a greater adjusted volume of green bonds, on average ceteris paribus.
In Model 2b, all coefficients are statistically insignificant. However, in Model 3b, EPIYale has a positive and significant coefficient – suggesting that countries with stronger environmental preferences have issued on average a larger adjusted volume of green bonds, ceteris paribus. 6.2. Discussion
The results from our analyses provide evidence supporting the following statements:
▪ Green bonds issuance is more likely to have occurred in countries which are more developed and have less corruption.
▪ Green bonds issuance is more likely to have occurred in countries in which environmental preferences are stronger.
▪ Green bonds issuance is more likely to have occurred in countries in which the financial markets are more transparent and higher-quality.
▪ The climate risk a country faces does not affect the probability of green bonds having been issued in it.
▪ A country's environmental preferences have on average a positive marginal effect on the volume of green bonds issued, ceteris paribus.
From the results of the first-step regression, it seems that indeed our proposed model can answer RQ1 and explain – even if to a limited extent – what characteristics seem to have an effect on the probability that green bonds have been issued in a country. However, the low Adjusted R2 for the second-step regression indicates that the model is less effective in answering RQ2 and predicting the country characteristics that drive the volume of green bonds issued.
20
Regarding the effect of environmental preferences and the quality of financial markets on the green bonds’ market, the authors were not able to find relevant literature. Still, it seems reasonable that countries with stronger environmental preferences and better financial markets are those in which green bond issuance is taking place. Further research that builds on these results is surely pertinent.
With regards to development, the main argument used by Banga (2018) is that developing countries have not yet been able to explore the green bonds market to the same extent that developed countries have.
Indeed, there is a relative agreement in the literature regarding developing countries’ increased risk of suffering from the effects of climate change and their low capacity of funding climate mitigation and adaption (World Bank, 2018; Jacob et al., 2015). This challenge is much due to environmental sustainability competing with social and economic development in terms of funding, institutional framework and policies trade-off (Dercon, 2014; Barbier, 2016).
This study finds empirical evidence – specifically related to the green bonds market – that is consistent with this challenge faced by developing countries.
7. Limitations and Future Research
The results of this study should be considered in the context of its many limitations. Because the authors were not able to find similar studies to build on, this analysis consists of an original yet preliminary approach to try understanding the difference in green bond issuance between the different countries.
The analysis undertaken considers only green bond issuance and thus does not compare bond trading in the secondary market. Furthermore, we do not differentiate bonds regarding their issuer (government or corporate), rating, yield to maturity, callability, premium, issue size,
21
issue date or whether or not they went through second- or third-party verification of the green status.
Specifically, results of RQ2 should be interpreted in the context of a selection bias – only countries in which there has been green bond issuance were included in the sample. Moreover, the sample considered is very limited, with only 40 individuals. These two issues – selection bias and small sample size – weaken the validity of the results. However, at present, these issues cannot be solved, as the sample size reflects the reality of green bond issuance. In a couple of years, once the green bond market matures and more countries become part of it, it might be interesting to repeat this assessment and hence obtain more robust results.
We limited our analysis to a set of characteristics we deemed to be relevant and for which we were able to find enough data. However, the model can be expanded, and some variables can be replaced. We did not aim to be exhaustive or absolute in our analysis but rather to propose an original approach to understanding the difference in green bond issuance between countries. Another variable that could have been used as a proxy for a country’s environmental preferences is the Climate Laws, Institutions and Measures Index, published by the European Bank for Reconstruction and Development in 2011. However, this data is available only for 95 countries and only for the year 2008 – which is why we chose to use EPIYale.
The World Bank presents a broad variety of information regarding the financial markets in different countries, and it would be interesting to investigate the effect of other variables on the issuance of green bonds. Specifically, we tried to include in our model the risk premium on lending, the lending interest rate and the interest rate spread. However, it was not possible to obtain valid results because the data was available only for a small group of countries.
22
A country's stage of development can also be measured by a using a series of alternative variables, and it can be interesting to further explore how the different aspects of development affect the green bonds' market.
We also tried including more control variables, such as the country's bond market size and its GDP per capita. This led to worse econometric results (Pseudo R-squared, Log-Likelihood) and thus these variables were dropped.
Finally, further research can build upon the findings of this study, such as:
▪ An analysis from a demand-side perspective. Instead of comparing the issuance between the different countries, it would be interesting to examine which countries have invested more in buying green bonds. Because many bonds are issued in the international market and not directed to domestic buyers, this analysis could lead to different yet complementary results.
▪ A similar analysis which differentiates corporate and government bonds and evaluates if the results are significantly different from those presented in this study.
▪ An evaluation of the effects of green bond issuance in the countries’ characteristics. As aforementioned, these instruments are new, and it is still early to evaluate the impact they are creating. However, in the future, it might be interesting to run a panel analysis and investigate if, in countries in which green bond issuance has been strong, environmental performance has improved, or climate risk has decreased.
8. Conclusions
While the green bond market has grown significantly in the last few years, issuance remains uneven between the different countries. In this paper, we found empirical evidence suggesting that the likelihood of green bonds having been issued is on average higher in countries which are more developed, have stronger environmental preferences, have more transparent and
23
better-quality financial markets and have less corruption. Our analysis fails to find a correlation between the likelihood of green bond issuance in a country and its exposure to the risk of climate change. Furthermore, conditional on green bonds having been issued in a country, we found evidence suggesting a positive correlation between the country’s environmental preferences and the volume of green bonds issued in the country.
Finally, as previously acknowledged, our study has several limitations and should be considered as a preliminary empirical approach towards understanding what characteristics drive the green bonds’ market in different countries. While there is room for more thorough investigation, much of it depends on the availability of new data – which makes this study an on-going research.
24 References
Baker, Malcolm, Daniel Bergstresser, George Serafeim and Jeffrey Wurgler. 2018. “Financing the Response to Climate Change: The Pricing and Ownership of U.S. Green Bonds.”Harvard Business School and NBER.
Banga, J. 2018. “The green bond market: a potential source of climate finance for developing
countries.” Journal of Sustainable Finance and Investment.
https://doi.org/10.1080/20430795.2018.1498617.
Barbier, Edward B. 2016. “Is Green Growth Relevant for Poor Economies? Resource and Energy Economics. DOI: 10.1016/j.reseneeco.2016.05.001.
Barclays. 2015. “The Cost of Being Green.” Accessed November 1, 2018. https://www.environmental-finance.com/assets/files/US_Credit_Focus_The_Cost_of_Being_Green.pdf
Bloomberg, 2017. “Fixed Income.” Accessed November 1, 2018.
https://www.bloomberg.com/impact/impact/fixed-income/.
Bloomberg, 2017. “Investors are willing to pay a green premium”. Bloomberg New Energy Finance report.
Chiesa M. and Barua, S. 2018. “The surge of impact borrowing: the magnitude and determinants of green bond supply and its heterogeneity across markets”. Journal of Sustainable Finance &
Investment, DOI: 10.1080/20430795.2018.1550993.
https://doi.org/10.1080/20430795.2018.1550993.
CICERO. 2015. “Cicero Shades of Green.” Accessed November 11, 2018.
https://www.cicero.oslo.no/en/posts/single/cicero-shades-of-green.
Climate Bonds Initiative, 2017. “Green Bonds Highlights 2016.” Accessed October 20, 2018.
https://www.climatebonds.net/files/files/CBI State of the Market 2016 A4.pdf
Climate Bonds Initiative, 2018. “Green Bond Highlights 2017.” Accessed November 1, 2018.
https://www.climatebonds.net/files/reports/cbi-green-bonds-highlights-2017.pdf.
Climate Bonds Initiative, 2018. “The Green Bond Market in Europe.” Accessed November 11, 2018.
https://www.climatebonds.net/files/reports/the_green_bond_market_in_europe.pdf.
Climate Bonds Initiative. 2016. “Understanding Green Bond Data Can Help Cities in Developing
Countries Tap the Market.” Accessed December 5, 2018.
https://climatepolicyinitiative.org/2016/09/06/understanding-green-bond-data-to-help-cities-developing-countries-tap-market/.
Dercon, Stefan. 2014. “Is Green Growth Good for the Poor?” World Bank Research Observer.
https://elibrary.worldbank.org/doi/abs/10.1093/wbro/lku007
Deutsche Bank. 2015. “Investing in Green Bonds – promoting sustainable projects.” Accessed November 1, 2018. https://socialmedia.db.com/infographics/green-bonds/green-bonds.htm. Ehlers, T., Packer F., 2017. “Green bond finance and certification.” Bank Int. Settlements Quarterly
25
EIB, 2018. “Environmental and Social Standards.” Accessed November 6, 2018.
http://www.eib.org/attachments/strategies/environmental_and_social_practices_handbook_en.pdf.
Euromoney. 2010. “Environmental Finance Handbook.” Accessed October 20, 2018.
http://worldbank.or.jp/debtsecurities/web/Euromoney_2010_Handbook_Environmental_Finance.p df.
Franklin, Aaron. 2016. “Is Green Striping the Future of Green Bonds?” International Financial Law Review, September. https://www.lw.com/thoughtLeadership/green-striping.
GIZ. 2018. “Green Bonds – Ecosystem, Issuance, Process and Case Studies.” Accessed November 5, 2018.
http://www.emergingmarketsdialogue.org/wp-content/uploads/2018/02/GIZ-SEB_Green_Bond_Publication_WEB.pdf.
Hachenberg, B. and Dirk Schiereck, 2018. “Are green bonds priced differently from conventional bonds?” Journal of Asset Management 19: 371-383. doi.org/10.1057/s41260-018-0088-5.
Hamilton, I. and J. Eriksson. 2011. “Influence Strategies in Shareholder Engagement: A Case Study of all Swedish National Pension Funds.” Journal of Sustainable Finance and Investment 1 (1): 44– 61.
Heal, G.2012. “Defining and Measuring Sustainability.” Review of Environmental Economics and Policy, 6(1): 147–163.
HSBC, 2016. Green Bonds 2.0. Fixed Income Credit report.
ICMA, 2018. “Green Bond Principles (GBP).” Accessed November 9, 2018.
https://www.icmagroup.org/green-social-and-sustainability-bonds/green-bond-principles-gbp/.
IDEA - The International Institute for Democracy and Electoral Assistance, 2018. The Global State of Democracy Indices. Accessed October 20, 2018.
https://www.idea.int/data-tools/tools/global-state-democracy-indices.
IFC. 2017. “IFC’s Definitions and Metrics for Climate-Related Activities.” Accessed October 28,
2018.
https://www.ifc.org/wps/wcm/connect/8ea3b242-c6bb-4132-82b1-ee4bd7007567/IFC+Climate+Definitions+v3.1+.pdf?MOD=AJPERES.
Jakob, Michael. Jan Christoph Steckel, Christian Flachsland & Lavinia Baumstark. 2014. “Climate finance for developing country mitigation: blessing or curse?” Climate and Development, DOI: 10.1080/17565529.2014.934768. https://doi.org/10.1080/17565529.2014.934768.
Karpf, A. and Antoine Mandel, 2017. “Does it Pay to Be Green?”
https://papers.ssrn.com/sol3/papers.cfm?abstract_id=2923484.
Karpf, A. and Antoine Mandel, 2018. “The changing value of the ‘green’ label on the US municipal bond market.” Nature Climate Change 8: 161-165. DOI:10.1038/s41558-017-0062-0.
Ley, L.W.W. 2017. “A comparative study on the financial performance of green bonds and their conventional peers.” Master Thesis. Erasmus School of Economics, Erasmus University Rotterdam. Morgan Stanley. 2013. “Morgan Stanley Investor Pulse Poll. National Report - Wealth Management.”
Morgan Stanley Smith Barney LLC.
OECD 2015. “Divestment and Stranded Assets in the Low-carbon Transition.” Background paper for the 32nd Round Table on Sustainable Development.
26
OECD, 2012. “OECD Environment Working Paper No. 46 Mobilising Investment in Low Carbon, Climate Resilient Infrastructure.” Accessed November 10, 2018. https://www.oecd-
ilibrary.org/environment/mobilising-investment-in-low-carbon-climate-resilient-infrastructure_5k8zm3gxxmnq-en.
OECD. 2017. “Green bonds: Mobilising Bond Markets for a Low-carbon Transition.”, Green Finance and Investment, OECD Publishing. https://dx.doi.org/10.1787/9789264272323-en.
Petrova, A. 2016. “Green Bonds: Lower Returns or Higher Responsibility?” Master thesis. Radboud University, Nijmegen School of Management.
PRI. 2017. “Engaging with sovereign green bond issuers.” Accessed November 7, 2018.
https://www.unpri.org/fixed-income/engaging-with-sovereign-green-bond-issuers/70.article
S&P Dow Jones Indices, 2014. “Climate Change, Green Bonds and Index Investing: The New
Frontier.” Accessed October 29, 2018.
http://asia-first.s3.amazonaws.com/researches/web_link/5a4dc41ddd1a74ae782d8900f5a3a63c.pdf.
Shishlov I., Romain Morel and Ian Cochran, 2016. “Beyond Transparency: unlocking the full potential of green bonds.” I4CE, Institute for Climate Economics. https://www.i4ce.org/wp-core/wp-content/uploads/2016/06/I4CE_Green_Bonds-1.pdf
Stockholm Environment Institute, 2018. “The Sustainable Development Goals viewed through a climate lens”. Accessed December 3, 2018.
https://www.sei.org/publications/the-sustainable-development-goals-viewed-through-a-climate-lens/.
UNDP. 2017. “Financing Solutions for Sustainable Development – Green Bonds.” Accessed November 1, 2018. http://www.undp.org/content/sdfinance/en/home/solutions/green-bonds.html. World Bank, 2014. “Green Bond – Fact Sheet.” Accessed November 10, 2018.
http://unfccc.int/files/adaptation/workstreams/loss_and_damage/application/pdf/worldbankgreenb ondfactsheet.pdf.
World Bank. 2017. “IBRD Funding Program - Green Bonds.” Accessed November 1, 2018.
http://treasury.worldbank.org/en/about/unit/treasury/ibrd/ibrd-green-bonds.
World Bank. 2018. “Tackling climate change poorest countries”. Accessed December 28, 2018.
http://blogs.worldbank.org/voices/tackling-climate-change-poorest-countries?cid=ECR_LI_worldbank_EN_EXT.
World Economic Forum, 2013. “The Green Investment Report: The ways and means to unlock private
finance for green growth.” Accessed November 3, 2018.
http://www3.weforum.org/docs/WEF_GreenInvestment_Report_2013.pdf.
Worldometer. 2018. “How many countries are there in the world?” Accessed December 10. http://www.worldometers.info/geography/how-many-countries-are-there-in-the-world/.
Yale, 2018. “Environmental Performance Index.” Accessed November 2, 2018.
https://epi.envirocenter.yale.edu/.
Zerbib, Olivier David. 2018. “The effect of pro-environmental preferences on bond prices: Evidence from green bonds.” Journal of Banking and Finance 98 (2019): 39-60.
i
ANNEX I – List of countries in which green bonds have been issued until 2018 (Source: Bloomberg Terminal)
Argentina Australia Austria Belgium Brazil Canada Chile China 4 Colombia Costa Rica Denmark Estonia Fiji Finland France Germany Greece India Indonesia Ireland Italy Japan Latvia Lithuania
4 Includes Taiwan and Hong Kong, which are listed separately in the Bloomberg Terminal.
Luxembourg Malaysia Mauritius Mexico Netherlands New Zealand Nigeria Norway Peru Poland Singapore Slovenia South Africa South Korea Spain Sweden Switzerland
United Arab Emirates United Kingdom 5 USA
5 Includes Britain, Cayman Islands, British Virgin Islands, and Bermuda, which are listed separately in the Bloomberg Terminal.
ii
ANNEX II – List of countries included in the first-step regression
Albania Algeria Angola Argentina Armenia Australia Austria Azerbaijan Bangladesh Belarus Belgium Benin Botswana Brazil Bulgaria Burkina Faso Burundi Cambodia Cameroon Canada Chile China Colombia Costa Rica Croatia Cyprus
Dem. Rep. Congo Denmark Dominican Republic Ecuador Egypt El Salvador Estonia Ethiopia Finland France Georgia Germany Ghana Greece Guatemala Guinea-Bissau Haiti Honduras Hungary India Indonesia Iraq Ireland Israel Italy Jamaica Japan Kazakhstan Kenya Kuwait Latvia Lebanon Lesotho Liberia Lithuania Madagascar Malawi Malaysia Mauritania Mexico Moldova Mongolia Morocco Mozambique Myanmar Namibia Nepal Netherlands New Zealand Nicaragua Niger Nigeria Norway Oman Pakistan Panama Paraguay Peru Philippines Poland Portugal Qatar Romania Russia Rwanda Saudi Arabia Sierra Leone Singapore Slovakia Slovenia South Africa South Korea Spain Sri Lanka Sudan Swaziland Sweden Switzerland Tanzania Thailand Timor-Leste Togo
Trinidad and Tobago Tunisia Turkey Uganda Ukraine United Kingdom Uruguay USA Viet Nam Zambia Zimbabwe
iii
ANNEX III – List of countries included in the second-step regression
Argentina Australia Austria Belgium Brazil Canada Chile China Colombia Costa Rica Denmark Estonia Finland France Germany Greece India Indonesia Ireland Italy Japan Latvia Lithuania Malaysia Mexico Netherlands New Zealand Nigeria Norway Peru Poland Singapore Slovenia South Africa South Korea Spain Sweden Switzerland United Kingdom USA
iv ANNEX IV – Robustness Checks
To test the robustness of our findings, we add four extra variables to both our empirical models and check whether our results remain consistent.
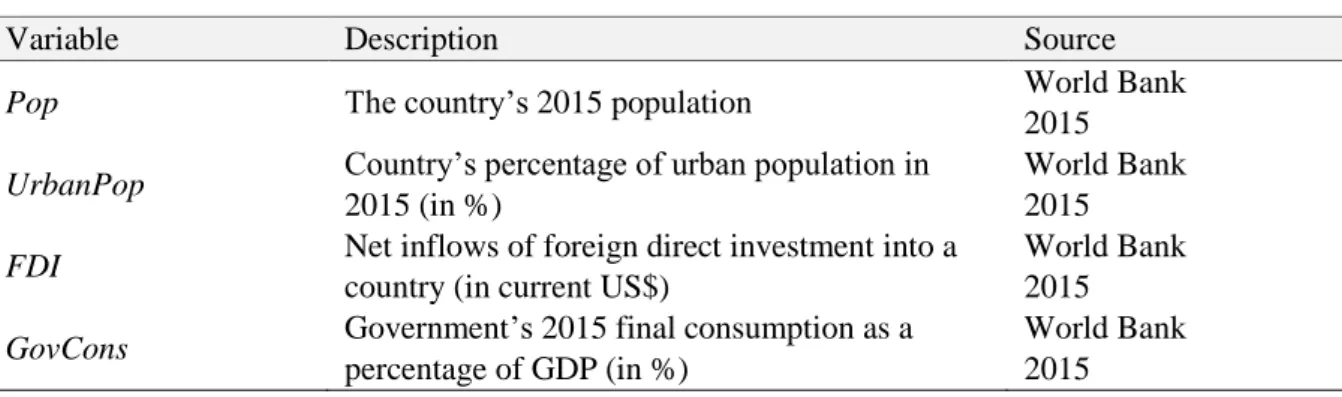
Table 6 presents the variables included.
Table 6 - Description of the Variables
Variable Description Source
Pop The country’s 2015 population World Bank
2015 UrbanPop Country’s percentage of urban population in
2015 (in %)
World Bank 2015 FDI Net inflows of foreign direct investment into a
country (in current US$)
World Bank 2015 GovCons Government’s 2015 final consumption as a
percentage of GDP (in %)
World Bank 2015
With the added variables, the expanded version of our first-step model becomes as follows:
𝐺𝐵𝐷𝑢𝑚𝑚𝑦 = 𝛽0+ 𝛽1𝐸𝑃𝐼𝑌𝑎𝑙𝑒 + 𝛽2𝐵𝑎𝑠𝑖𝑐𝑊𝑒𝑙𝑓𝑎𝑟𝑒 + 𝛽3𝐶𝑟𝑒𝑑𝑖𝑡𝐼𝑛𝑓𝑜 + (4)
𝛽4𝐴𝑏𝑠𝑒𝑛𝑐𝑒𝑜𝑓𝐶𝑜𝑟𝑟𝑢𝑝𝑡𝑖𝑜𝑛 + 𝛽5𝐶𝑙𝑖𝑚𝑎𝑡𝑒𝑅𝑖𝑠𝑘 + 𝛽6𝐺𝐷𝑃 + 𝛽7𝐴𝑁𝑆 +
𝛽8𝑃𝑜𝑝 + 𝛽9𝑈𝑟𝑏𝑎𝑛𝑃𝑜𝑝 + 𝛽10 𝐹𝐷𝐼 + 𝛽11𝐺𝑜𝑣𝐶𝑜𝑛𝑠
With the added variables, the expanded version of our second-step model becomes as follows:
𝐺𝐵𝑅𝑎𝑡𝑖𝑜 = 𝛽0+ 𝛽1𝐸𝑃𝐼𝑌𝑎𝑙𝑒 + 𝛽2𝐵𝑎𝑠𝑖𝑐𝑊𝑒𝑙𝑓𝑎𝑟𝑒 + 𝛽3𝐶𝑟𝑒𝑑𝑖𝑡𝐼𝑛𝑓𝑜 + (5)
𝛽4𝐴𝑏𝑠𝑒𝑛𝑐𝑒𝑜𝑓𝐶𝑜𝑟𝑟𝑢𝑝𝑡𝑖𝑜𝑛 + 𝛽5𝐶𝑙𝑖𝑚𝑎𝑡𝑒𝑅𝑖𝑠𝑘 + 𝛽6𝐺𝐷𝑃 + 𝛽7𝐴𝑁𝑆 +
𝛽8𝑃𝑜𝑝 + 𝛽9𝑈𝑟𝑏𝑎𝑛𝑃𝑜𝑝 + 𝛽10 𝐹𝐷𝐼 + 𝛽11𝐺𝑜𝑣𝐶𝑜𝑛𝑠
Again, we run a binary logistic regression for the first-step model and an OLS regression for the second-step model. Tables 7 and 8 present our results.
v
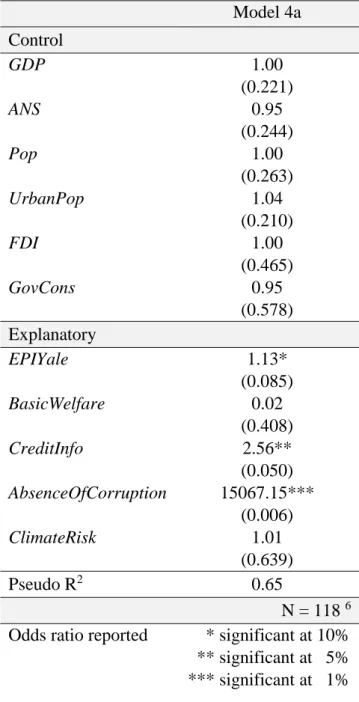
Table 7- Summarized results of the binary logistic regression (first-step) Model 4a Control GDP 1.00 (0.221) ANS 0.95 (0.244) Pop 1.00 (0.263) UrbanPop 1.04 (0.210) FDI 1.00 (0.465) GovCons 0.95 (0.578) Explanatory EPIYale 1.13* (0.085) BasicWelfare 0.02 (0.408) CreditInfo 2.56** (0.050) AbsenceOfCorruption 15067.15*** (0.006) ClimateRisk 1.01 (0.639) Pseudo R2 0.65 N = 118 6
Odds ratio reported * significant at 10% ** significant at 5%
*** significant at 1%
Based on the results presented in Table 7, the effects of EPIYale, CreditInfo and
AbsenceOfCorruption on GBDummy remain positive and significant, indicating that our results
are indeed robust.
6 When including the additional variable to perform the robustness check, we lose an observation (Trinidad and Tobago) due to lack of data and are left with 118 countries instead of 119.
vi
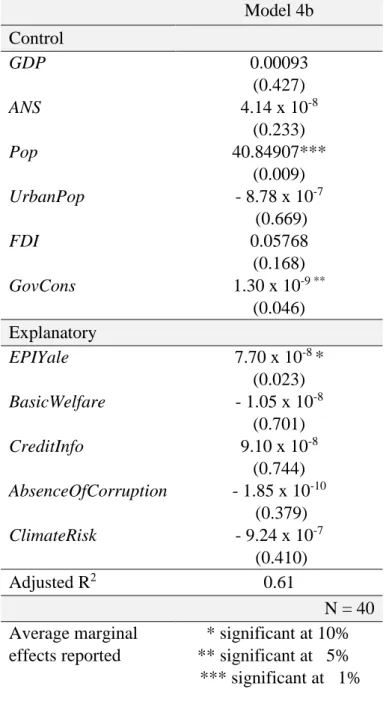
Likewise, results presented in Table 8 show that our second-step model is also robust and suggest that conditional on issuance, the effect of environmental preferences on the volume issued is positive and significant.
Table 8 - Summarized results of the OLS regression (second-step) Model 4b Control GDP 0.00093 (0.427) ANS 4.14 x 10⁻⁸ (0.233) Pop 40.84907*** (0.009) UrbanPop - 8.78 x 10⁻⁷ (0.669) FDI 0.05768 (0.168) GovCons 1.30 x 10⁻⁹ ** (0.046) Explanatory EPIYale 7.70 x 10-8 * (0.023) BasicWelfare - 1.05 x 10⁻⁸ (0.701) CreditInfo 9.10 x 10⁻⁸ (0.744) AbsenceOfCorruption - 1.85 x 10⁻¹⁰ (0.379) ClimateRisk - 9.24 x 10⁻⁷ (0.410) Adjusted R2 0.61 N = 40 Average marginal effects reported * significant at 10% ** significant at 5% *** significant at 1%
vii ANNEX V – Multicollinearity Matrix
Univariate Analysis – Spearman Correlations
1 2 3 4 5 6 7 8 9 1. GBDummy 1.000*** 2. GBRatio 0.973*** 1.000*** 3. GDP 0.653*** 0.633*** 1.000*** 4. ANS 0.192** 0.237*** 0.312*** 1.000*** 5. EPIYale 0.556*** 0.589*** 0.532*** 0.250*** 1.000*** 6. BasicWelfare 0.595*** 0.622*** 0.545*** 0.344*** 0.792*** 1.000*** 7. CreditInfo 0.347** 0.314*** 0.366*** 0.221** 0.338*** 0.269*** 1.000*** 8. AbsenceOfCorruption 0.568*** 0.595*** 0.352*** 0.276*** 0.592*** 0.769*** 0.175* 1.000*** 9. ClimateRisk -0.075 -0.056 -0.251 -0.108 0.195** 0.097 -0.146 -0.004 1.000*** * significant at 10% ** significant at 5% *** significant at 1%