Ana Sofia de Campos Grosso
Licenciatura em BioquímicaMolecular recognition of tumor-associated
antigens by lectins and antibodies
Dissertação para obtenção do Grau de Mestre em Química Bioorgânica
Orientador: Doutora Filipa Marcelo, Investigadora Auxiliar,
Faculdade de Ciências e Tecnologia- Universidade Nova de
Lisboa
Júri:
Presidente: Prof. Doutora Paula Cristina de Sério Branco Arguente: Doutora Maria Angelina de Sá Palma Vogal: Doutora Filipa Margarida Barradas de Morais Marcelo
2017 Molecul ar r ec o g n it ion of t umor -as soc iated ant igen s b y l e ctin s a n d ant ibo d ie s An a Grosso
Ana Sofia de Campos Grosso
Licenciatura em BioquímicaMolecular recognition of tumor-associated
antigens by lectins and antibodies
Dissertação para obtenção do Grau de Mestre em Química Bioorgânica
Orientador: Doutora Filipa Marcelo, Investigadora Auxiliar,
Faculdade de Ciências e Tecnologia- Universidade Nova de
Lisboa
Júri:
Presidente: Prof. Doutora Paula Cristina de Sério Branco Arguente: Doutora Maria Angelina de Sá Palma Vogal: Doutora Filipa Margarida Barradas de Morais Marcelo
Molecular recognition of MUC1 tumor-associated antigens by
lectins and antibodies
Copyright © Ana Sofia de Campos Grosso, Faculdade de Ciências e Tecnologia da Universidade Nova de Lisboa
A Faculdade de Ciências e Tecnologia e a Universidade Nova de Lisboa têm o direito, perpétuo e sem limites geográficos, de arquivar e publicar esta dissertação através de exemplares impressos reproduzidos em papel ou de forma digital, ou por qualquer outro meio conhecido ou que venha a ser inventado, e de a divulgar através de repositórios científicos e de admitir a sua cópia e distribuição com objectivos educacionais ou de investigação, não comerciais, desde que seja dado crédito ao autor e editor.
Agradecimentos
Este foi um ano maravilhoso, onde aprendi imenso sobre coisas que não teria aprendido de outra forma, especialmente sobre açúcares. Os açúcares são biomoléculas fantásticas, mas raramente mencionados durante as unidades curriculares de Mestrado ou Licenciatura. Devido a isto, a esta oportunidade de aprender não só sobre os açúcares, mas também sobre técnicas experimentais que nunca tinha feito, RMN e ter-me dado a oportunidade de ter conhecido o seu grupo de investigação, gostaria de agradecer à Investigadora Filipa Marcelo, por ter aceite orientar-me durante esta minha viagem no conhecimento. Obrigada por toda a ajuda ao longo deste ano, as boleias e o computador que me emprestou.
Outra pessoa muito importante neste ano e nesta maravilhosa experiência foi a bolseira Ana Diniz. A Ana ajudou-me a vários níveis, quer no laboratório, onde estava sempre um passo à frente e me ensinou imensas coisas, como também facilitou o meu processo de integração no grupo e laboratório. Ela é realmente o espírito deste laboratório e está sempre disposta a ajudar todos e a facilitar a vida de todos no laboratório. Para além da Ana, também tenho que agradecer à aluna de Doutoramento Helena Coelho, por me ter ajudado na última parte da tese. Não conheci muito bem a Helena, mas ela esteve sempre disposta em ajudar-me em tudo o que precisei. Por isso, obrigada pelo vosso esforço em me ajudar ao longo do meu percurso durante a minha tese.
Para além destas pessoas, devo dizer que todo o grupo de investigação foi muito acolhedor, simpático e prestativo sempre que tive problemas. O Doutor Jorge Dias ajudou sempre que tinha dúvidas em relação à parte de purificação e expressão de proteínas e HPLC; a Doutora Ana Sofia Ferreira ajudou quando tive problemas informáticos; o Professor Eurico Cabrita ensinou imensa coisa sobre RMN; o aluno de Doutoramento Micael Silva tornou o ambiente do laboratório mais cheio de vida; os restantes alunos de Doutoramento com quem não interagi muito também foram sempre muito simpáticos e dispostos a ajudar.
Fora do grupo tenho de agradecer à minha Tia Catarina por me disponibilizar um sítio para dormir e me ouvir e aconselhar sempre que havia algo que me preocupava e aos meus pais por sempre terem se interessado pela minha educação. Às minhas maninhas que serviram para me distrair e esquecer da tese.
Abstract
Every living cell on Earth is covered by glycans. They are inserted in proteins and lipids by a posttranslational modification called glycosylation. Their recognition by specific receptors is translated into distinct biological signals.
In cancer cells, a misregulation in expression and/or activity of glycosyltransferases, alters the mechanism of glycosylation, creating new glycan epitopes dubbed tumor-associated carbohydrate antigens (TACAs). These are recognized by various receptors, playing a major role in tumor immune responses and metastasis. To target cancer-associated glycan phenotype is crucial to disentangle the molecular recognition process that involves TACAs recognition and biosynthesis.
Therefore, NMR techniques were employed to investigate distinct glycan-protein systems: i) the molecular interactions between a mucin-1 (MUC1) related Tn-glycopeptide mimetic containing a non-natural amino acid and distinct antibodies by saturation transfer-difference (STD-NMR); ii) the molecular interactions between galectin-3 (Gal-3) and TF-antigen (TF-Thr and TF-peptide), by heteronuclear single quantum coherence 1H,15N-HSQC titrations, STD-NMR and line broadening
analysis and iii) the glycosylation of MUC1 tandem repeated protein (G1VT3S4APDT8RPAPGS14T15APPAH20)
4 by GalNAc-T3 using 1H,15N-HSQC and STD-NMR.
In i), the STD-NMR binding experiments show that all antibodies under study recognize the Tn-glycopeptide mimetic and point out structural differences that explain antibodies’ binding preferences.
In ii), the 1H,15N-HSQC titrations experiments indicate that Gal-3 binds both TF-derivatives. The
dissociation constant KD estimated for both through chemical shift analysis also shows the same range of affinity (275 μM and 413 μM for TF-antigen and TF-peptide, respectively). STD-NMR results demonstrate that the protons from galactose in the TF-moiety govern the recognition process of Gal-3.
In iii), the 1H,15N-HSQC experiments of MUC1 in presence of GalNAc-T3 show that the enzyme
has preference to glycosylate first the Thr at –GVTS-, followed by the residue Thr at –GSTA-. STD-NMR confirms the cooperative mechanism between the lectin and catalytic domain of GalNAc-T3.
Keywords: Carbohydrate-protein interactions; NMR Spectroscopy; Galectins; Antibodies; GalNAc-transferases; Mucin-1.
Resumo
Os açúcares cobrem todas as células vivas do planeta. São inseridos em proteínas e lípidos por uma modificação pós-translacional, a glicosilação. A sua tradução em sinais biológicos ocorre através do reconhecimento por certos receptores.
No cancro, uma disfunção na regulação na expressão e/ou actividade de glicosiltransferases altera o mecanismo de glicosilação, criando novos epitopos de açúcares, os antigénios de carbohidratos-associados a tumor (TACAs). Estes são reconhecidos por vários receptores, influenciando a resposta imune e promovendo metástases. Por isso, é importante perceber o processo de reconhecimento molecular que envolve o reconhecimento e biossíntese dos TACAs.
Para tal, técnicas de RMN foram utilizadas para investigar vários sistemas açúcar-proteína: i) as interações moleculares entre um Tn-glicopéptido mucina-1 (MUC1) com um aminoácido não natural e vários anticorpos, por Saturation Transfer-Difference (STD-RMN), ii) as interações moleculares entre a Galectina-3 (Gal-3) e o antigénio-TF (TF-Thr e péptido-TF), por titulações Heteronuclear
Single Quantum Coherence 1H,15N-HSQC, STD-RMN e análise de largura de linha e iii) a
glicosilação da proteína MUC1 (G1VT3S4APDT8RPAPGS14T15APPAH20)
4 pela GalNAc-T3 usando 1H,15N-HSQC e STD-RMN.
Em i), as experiências de STD-RMN mostraram que os anticorpos estudados conseguem reconhecer o Tn-glicopéptido e que as diferenças estruturais explicam as diferentes preferências de interação.
Em ii), as experiências de titulação de 1H,15N-HSQC mostraram que a Gal-3 interage com ambos
os derivados-TF. A constante de dissociação (KD) estimada através da análise dos desvios químicos mostrou a mesma gama de afinidade para o antigénio-TF e o péptido-TF de 275 μM e 413 μM, respectivamente. STD-RMN mostrou que os protões da Galactose do antigénio-TF governam o processo de reconhecimento da Gal-3.
Em iii), as experiências de 1H,15N-HSQC da proteína MUC1 na presença de GalNAc-T3,
mostraram que a enzima tem preferência na glicosilação do resíduo Thr de -GVTS-, seguido pelo resíduo Thr de -GSTA-. STD-RMN provou que o domínio lectina e catalítico da GalNAc-T3 têm um mecanismo cooperativo.
Palavras-chave: Interações açúcar-proteína; Espectroscopia de RMN; Galectinas; Anticorpos; GalNAc-Transferases; Mucina-1.
Table of Contents
Agradecimentos ... III Abstract ... V Resumo ... VII List of Figures ... XI List of Tables ... XVII List of Abbreviations ... XIX
1. Introduction ... 1
1.1. Carbohydrate-protein interactions ... 1
1.2. Glycosylation on proteins ... 4
1.3. Glycosylation and cancer ... 4
1.3.1. Mucin-1 (MUC1) ... 5
1.3.1.1. MUC1 and tumor-associated carbohydrate antigens (TACAs) ... 6
1.3.1.2. Interaction of TACAs with antibodies and lectins ... 7
1.4. GalNAc-Ts and the biosynthesis of O-glycans ... 9
1.5. Methodology ... 10
1.5.1. Protein-based Methods ... 11
1.5.2. Ligand-based methods ... 12
1.6. Objectives ... 14
2. Materials and Methods ... 17
2.1. Chapter i): Carbohydrate-antibodies interactions ... 17
2.2. Chapter ii): Gal-3/TF interactions ... 18
2.2.1. Expression and purification of 1H,15N-labelled Gal-3 CRD ... 18
2.2.2. NMR TF-antigen assignment ... 19
2.2.3. Gal-3/TF-antigen interactions monitored by 1H,15N-HSQC titrations ... 19
2.2.4. Gal-3/TF-antigen interactions studied by STD-RMN ... 20
2.2.5. Gal-3/TF-antigen interactions studied by line broadening analysis ... 20
2.3. Chapter iii): MUC1 O-Glycosylation by GalNAc-T3 ... 20
2.3.1. Expression and purification of 1H,15N-labelled MUC1-4TR ... 20
2.3.2. NMR spectroscopy studies of MUC1-4TR glycosylation by GalNAc-T3 ... 22
3. Results and Discussion ... 23
3.1. Carbohydrate-antibodies interactions... 23
3.1.1. Characterization of Tn-glycopeptide mimetic APD(Hnv)*RP by NMR Spectroscopy .... 24
3.1.2. STD-NMR binding studies of Tn-glycopeptide mimetic APD(Hnv)*RP ... 30
3.1.3. Principal conclusions and perspectives ... 37
3.2.1. Expression and purification of 1H,15N-labelled Gal-3 CRD ... 38
3.2.2. Gal-3/TF-antigen interactions monitored by 1H,15N-HSQC titrations ... 40
3.2.3. Gal-3/TF-glycopeptide interactions monitored by 1H,15N-HSQC titrations ... 45
3.2.4. Gal-3/TF-antigen interactions studied by STD-NMR ... 48
3.2.5. Gal-3/TF-antigen interactions studied by line broadening analysis ... 49
3.2.6. Principal conclusions and perspectives ... 51
3.3. Chapter iii): MUC1 O-Glycosylation by GalNAc-T3 ... 52
3.3.1. Expression and Purification of 1H,15N-labelled MUC1-4TR ... 52
3.3.2. Study of MUC1-4TR O-Glycosylation by GalNAc-T3 using NMR spectroscopy ... 56
3.3.3. Interaction studies of glycopeptide T3-Tn by GalNAc-T3 ... 60
3.3.4. Principal conclusions and perspectives ... 61
4. Conclusions ... 63
5. References ... 65
6. Appendix ... 71
6.1. Appendix 6.1- Table with the characteristic chemical shift pattern for each amino acid. ... 71
6.2. Appendix 6.2- Assignment of the 1H-NMR spectrum for the glycopeptide APD(Hnv)*RP (* corresponds to the site of Tn-glycosylation) ... 72
6.3. Appendix 6.3- Expression vector used for the expression of 15N labelled Gal-3 CRD ... 76
6.4. Appendix 6.4-Composition of the LB medium and M9 minimum medium used in the expression of Gal-3 CRD ... 77
6.5. Appendix 6.5- Assignment of the 1H-NMR spectrum for the TF-antigen ... 78
6.6. Appendix 6.6- Assignment of the 1H-NMR spectrum for the TF-glycopeptide PDT*RP (* corresponds to the site of TF-glycosylation) ... 79
6.7. Appendix 6.7- Expression vector used for the expression of 15N labelled MUC1-4TR ... 83
6.8. Appendix 6.8- Composition of the LB medium and M9 minimum medium used in the expression of MUC1-4TR ... 84
List of Figures
Figure 1.1: Examples of carbohydrate-protein interactions. GalNAc represents
N-acetylgalactosamine; GlcNAc: N-acetylglucosamine; Neu5Ac: N-Acetylneuraminic Acid; Gal: Galactose; Fuc: Fucose; Man: Manose and Glu: Glucose [1]. ... 1 Figure 1.2: Differences in the binding interactions between a monovalent interaction and a multivalent interaction. [14]. ... 3 Figure 1.3: Schematic representation of the structure of MUC1. The N-terminal constituted by the VNTR domain and the SEA domain, while the C-terminal composed by the Transmembrane domain, Cytoplasmic domain and some residues of the Extracellular domain [31]. ... 5 Figure 1.4: A- MUC1 in normal cells, normally glycosylated and expressed only at the cell surface; B- MUC1 in cancer cells, where it is overexpressed and aberrantly glycosylated. [37]... 6 Figure 1.5: Structure of TACAs... 7 Figure 1.6: Structure of galectin-3 monomer and its pentamer form. [50] ... 8 Figure 1.7: Representation of the X-Ray Crystallography structure obtained with the different types of interactions between Gal-3 and TF-antigen. [56] ... 9 Figure 1.8: Representation of the chemical shift perturbation induced by interaction of an unlabelled small ligand and a 15N-labelled protein detected in 1H,15N-HSQC spectrum. A- Example of slow
exchange interactions; B- Example of fast exchange interactions. [82] ... 12 Figure 1.9: Schematic representation of STD-NMR experiment. ... 14 Figure 3.1: Structure of the Tn-glycopeptide mimetic with sequence APD(Hnv)*RP and structure of the Tn-antigen numbered. ... 23 Figure 3.2: NH region of the TOCSY spectrum (80 ms of mixing time) of the Tn-glycopeptide APD(Hnv)*RP (* indicates the site of glycosylation). ... 25 Figure 3.3: Aliphatic region of TOCSY spectrum (80 ms of mixing time) of Tn-glycopeptide APD(Hnv)*RP (* indicates the site of glycosylation) with the attribution of the spin system of the amino acids. The green rectangle is the spin system of one of the prolines and the orange is the spin system of the other proline. ... 26 Figure 3.4: Superposition of the aliphatic region of TOCSY (blue) and NOESY (red) spectra of the Tn-glycopeptide APD(Hnv)*RP (* indicates the site of glycosylation). The black arrows represent the NOESY between the Hα of arginine with Hδ3 of proline at position 6 and the green arrows represent the NOESY between the Hα of alanine with Hδ2 of proline at position 2. ... 27 Figure 3.5: NH region TOCSY spectrum (30 ms of mixing time) of the Tn-glycopeptide APD(Hnv)*RP (* indicates the site of glycosylation), with the identification of the carbohydrate’s spin system (orange rectangle) and the attribution of the H2 and H3. ... 28 Figure 3.6: Superposition of the aliphatic region of TOCSY (blue) and NOESY (red) spectra of the Tn-glycopeptide APD(Hnv)*RP (* indicates the site of glycosylation). The green rectangle corresponds to the correlation between H5 and H6, while the blue dots arrow shows the spatial correlation between H5 and H3. ... 29 Figure 3.7: Superposition of the TOCSY (blue) and NOESY (red) spectra of the Tn-glycopeptide APD(Hnv)*RP (* indicates the site of glycosylation). The blue arrow represents the spatial correlation between the NH of the GalNAc and the -CH3 group of the GalNAc residue. ... 29
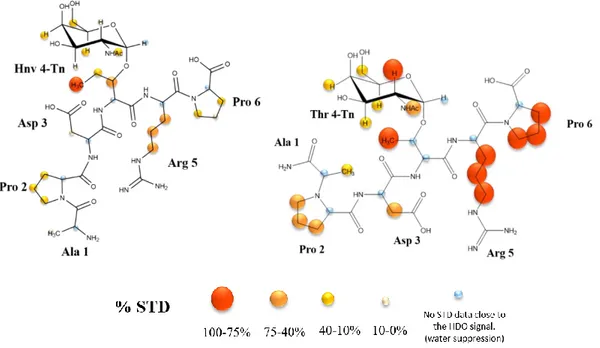
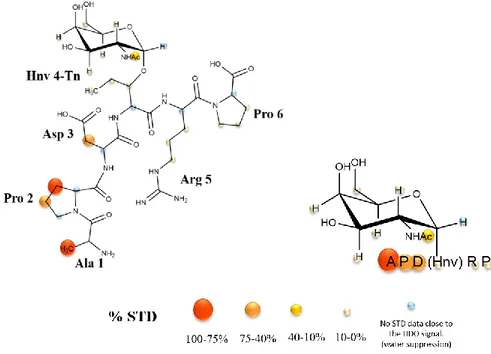
Figure 3.8: STD spectrum (blue) and the off-resonance spectrum (red) for the STD-NMR experiment of the Tn-glycopeptide APD(Hnv)*RP (* indicates the site of glycosylation) in presence of VU-3C6. ... 30
Figure 3.9: STD-derived epitope mapping of Tn-glycopeptide mimetic APD(Hnv)*RP (* indicates the site of glycoslation) in presence of mAb VU-3C6. ... 31 Figure 3.10: Comparison between the STD-derived epitope mapping of Tn-glycopeptide mimetic APD(Hnv)*RP with the one obtained for the Tn-glycopeptide APDT*RP (where * indicates the site of glycosylation) in presence of mAb VU-3C6. ... 32 Figure 3.11: Epitope mapping analysis of anti-MUC1 VU-3C6 mAb (50 µg/mL). Fluorescent image scan of natural Tn-glycopeptide (Thr*) and Tn-glycopeptide mimetic (Hnv*). Glycopeptides with natural Thr and non-natural Hnv were printed at 6 different concentrations (15.6, 31.2, 62.5, 125, 250, and 500 μM) onto an aminooxy-functionalized microarray in quadruplicate... 32 Figure 3.12: STD spectrum (blue) and the off-resonance spectrum (red) for the STD-NMR experiment of the Tn-glycopeptide APD(Hnv)*RP (* indicates the site of glycosylation) in presence of SM3 Fc. ... 33 Figure 3.13: STD-derived epitope mapping of Tn-glycopeptide mimetic APD(Hnv)*RP (* indicates the site of glycoslation) in presence of SM3 Fc. ... 33 Figure 3.14: A. Epitope mapping analysis of anti-MUC1 SM3 mAb (50 µg/mL). Fluorescent image scan of natural Tn-glycopeptide (Thr*) and Tn-glycopeptide mimetic (Hnv*). Glycopeptides with natural Thr and non-natural Hnv were printed at 6 different concentrations (15.6, 31.2, 62.5, 125, 250, and 500 μM) onto an aminooxy-functionalized microarray in quadruplicate. B. Graphical presentation of the Ka values (M-1) determined by BLI technique for peptides containing the natural Thr and
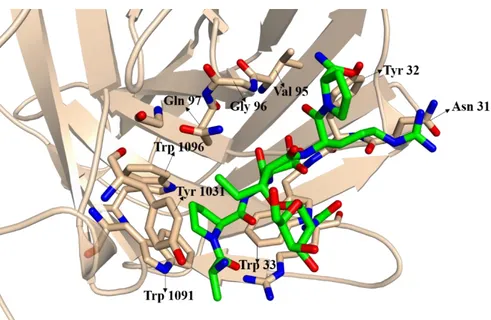
non-natural Hnv and their corresponding Tn-derivatives, Thr* and Hnv*. ... 34 Figure 3.15: X-ray Crystallography structure of SM3 with the peptide APD(Hnv)*RP in the binding site. The ligand is colored according the atom, carbon is green, oxygen red and nitrogen is blue. The residues important for the binding interaction are identified. Image obtained using the software PyMOL [94]. ... 35 Figure 3.16: STD spectrum (blue) and the off-resonance spectrum (red) for the STD-NMR experiment of the Tn-glycopeptide APD(Hnv)*RP (* indicates the site of glycosylation) in presence of 14D6. ... 36 Figure 3.17: STD-derived epitope mapping of Tn-glycopeptide mimetic APD(Hnv)*RP (* indicates the site of glycoslation) in presence of 14D6. ... 36 Figure 3.18: Chromatogram obtained in the purification step of Gal-3 CRD, by α-lactose-agarose column affinity chromatography. The blue line corresponds to the absorbance at 280 nm and the red line corresponds to the gradient % B, where B is the elution buffer. The washing buffer is composed by 25 mM PBS, 50 mM NaCl, 1 mM DTT and 0.1% sodium azide, pH 6.8 and the elution buffer contained 25 mM PBS, 50 mM NaCl, 1 mM DTT, 0.1% sodium azide and 150 mM lactose, pH 6.8. The numbers correspond to the fractions collected... 38 Figure 3.19: 10% polyacrylamide Gel Electrophoresis (SDS-PAGE). Well 1- NZYColour Protein Marker II; Well 2- Sample before induction; Well 3- Sample 2 h after induction; Well 4- Sample 4 h after induction; Well 5- Supernatant after sonication; Well 6- Affinity Chromatography fraction 1; Well 7- Affinity Chromatography fraction 3; Well 8- Affinity Chromatography fraction 2; Well 9- Affinity Chromatography fraction 4; Well 10- Affinity Chromatography fraction 5. ... 39 Figure 3.20: Structure of the TF-antigen. ... 40 Figure 3.21: Overlap of the six 1H, 15N-HSQC spectra from the titration of Gal-3 CRD with the
TF-antigen, with the identification of the peaks with more chemical shift. From left to right: the first black signal corresponds to 1:0, the first green signal corresponds to 1:0.5, the blue signal corresponds to 1:1, the red signal corresponds to the ratio 1:5, the second black signal corresponds to the ratio 1:15 and the second green signal corresponds to the ratio 1:30. ... 41 Figure 3.22: Overlap of the titration spectra for the residues His 158 and Thr 175. From left to right: the first black signal corresponds to 1:0, the first green signal corresponds to 1:0.5, the blue signal
corresponds to 1:1, the red signal corresponds to the ratio 1:5, the second black signal corresponds to the ratio 1:15 and the second green signal corresponds to the ratio 1:30... 41 Figure 3.23: Chart with the values of Δδcomb obtained for each amino acid of Gal-3 CRD. ... 42 Figure 3.24: Chart with the values of Δδcomb obtained for each amino acid of Gal-3 CRD. The blue line is the second cut-off, while the dark red line is the cut-off used for the determination of the residues participating in the interaction with the TF-antigen. ... 43 Figure 3.25: Representation of the binding site of the Gal-3 CRD for the TF-antigen (PDB code 3AYA [56]). The ligand is colored according the atom, carbon is white, oxygen red and nitrogen is blue, the binding site at dark blue and the amino acids adjacent to the binding site at cyan. The principal amino acids for the Gal-3/TF-antigen interaction were identified. Image obtained using the software PyMOL [94]. ... 43 Figure 3.26: Chart of the experimental values of Δδcomb for the residue of Arg 144. ... 44 Figure 3.27: Chart with the values of the experimental Δδcomb (blue) and the adjusted calculated Δδcomb (dark red) for Arg 144... 45 Figure 3.28: Structure of the TF-glycopeptide (PDT*RP where * indicates the site of glycosylation). ... 45 Figure 3.29: Overlap of the six 1H,15N-HSQC spectra from the titration of Gal-3 CRD with
TF-glycopeptide (PDT*RP, where * indicates the site of glycosylation) with the identification of the peaks with more chemical shift. From left to right: the first black signal corresponds to 1:0, the first green signal corresponds to 1:0.5, the blue signal corresponds to 1:1, the red signal corresponds to the ratio 1:5, the second black signal corresponds to the ratio 1:8 and the second green signal corresponds to the ratio 1:45. ... 46 Figure 3.30: Chart with the values of Δδcomb obtained for each amino acid of Gal-3 CRD. The orange line is the second cut-off, while the dark red line is the cut-off used for the determination of the residues participating in the interaction with the TF-glycopeptide (PDT*RP, where * indicates the site of glycosylation). ... 47 Figure 3.31: Representation of the binding site of the Gal-3 CRD for the TF-glycopeptide (PDT*RP) using X-ray crystallography structure of the complex (PDB code 3AYA [56]). The ligand is colored according the atom, carbon is white, oxygen red and nitrogen is blue, the binding site is represented with dark blue and the amino acids adjacent to the binding site with cyan. The principal amino acids in the Gal-3/TF-peptide interaction were identified in the figure. Image obtained using the software PyMOL [94]. ... 47 Figure 3.32: STD spectrum (blue) and the off-resonance spectrum (red) of TF-antigen in presence of Gal-3 FL ... 48 Figure 3.33: STD-derived epitope of TF-antigen in presence of Gal-3 FL. ... 49 Figure 3.34: Superimposition of TF-antigen 1H–NMR spectrum at 500 μM (selected the sugar proton
region in 1H-NMR) in presence of Gal-3 CRD (red) with 50 μM and in absence of Gal-3 CRD (blue).
... 50 Figure 3.35: Superimposition of TF-glycopeptide (PDT*RP where * indicates the site of glycosylation) 1H–NMR spectrum (from 2.5 to 4.5 ppm) at 400 μM in presence of Gal-3 CRD (red)
with 50 μM and in absence of Gal-3 CRD (blue). ... 51 Figure 3.36: Chromatogram obtained from the affinity chromatography, using a Ni column. The brown line corresponds to the absorbance at 280 nm and the blue line corresponds to the gradient of buffer B. Buffer B is the elution buffer containing PBS 10 mM, NaCl 150 mM, imidazole 1 M and β-mercaptoethanol 1 mM. The numbers on top of the chromatogram correspond to the fractions collected. ... 52 Figure 3.37: Chromatogram obtained from the desalting chromatography. The blue line corresponds to the absorbance at 280 nm and the red line to the elution gradient (%B). Buffer B is the elution
buffer composed by PBS 10 mM, NaCl 150 mM and β-mercaptoethanol 1 mM. Each peak is cycle (red rectangle) and each cycle has 3 fractions, like the example showed. ... 53 Figure 3.38: 10% Polyacrylamide Gel Electrophoresis. Well 1- NZYColour Protein Marker II; Well 2- Fraction 1 after desalting; Well 3- Fraction 3 after desalting; Well 4- Fraction 4 after desalting; Well 5- Fraction 5 after desalting. The red arrow indicates the MUC1-4TR construct. ... 54 Figure 3.39: 10% Polyacrylamide Gel Electrophoresis of TEV reaction. Well 1- NZYColour Protein Marker II; Well 2- Fraction 4 after centrifuging; Well 3- Fraction 5 after centrifuging; Well 4- Pellet diluted of fraction 4; Well 5- Pellet diluted of fraction 5; Well 6- Pellet fraction 4; Well 7- Pellet fraction 5. The bands assigned in the gel with A correspond to MUC1-4TR that remained undigested (MUC1-4TR+KSI). The bands assigned with B correspond to the TEV protease and the bands assigned with C correspond to the fusion protein KSI. ... 54 Figure 3.40: Chromatogram obtained from the reversed-phase chromatography. The peak marked with the black rectangle corresponds to the signal of MUC1-4TR. The blue line corresponds to the absorbance at 220 nm, the red line corresponds to the absorbance at 230 nm, the green line corresponds to the absorbance at 254 nm and the green line is the elution gradient (%B). Buffer B is the elution buffer containing 100% acetonitrile. ... 55 Figure 3.41: A MUC1-4TR sequence; B 1H,15N HSQC of MUC1-4TR with assignment of peptide
sequence; C MALDI-TOF spectrum of 15N-MUC1-4TR. ... 56
Figure 3.42: A.1H,15N-HSQC of the final product of GalNAc-T3 with corresponding assignment of
peptide sequence. B. MALDI-TOF spectrum of the final product of GalNAc-T3. ... 57 Figure 3.43: Overlap of the 1H,15N-HSQC spectrum of MUC1-4TR naked in black and the 1H,15
N-HSQC spectrum of MUC1 with T3 glycosylated in red. Arrows in green highlight new V2/T3/S4 signals due to glycosylation. ... 58 Figure 3.44: A. Overlap of the 1H,15N-HSQC spectrum of MUC1-4TR naked in black with the 1H,15N-HSQC spectrum of MUC1-4TR with T3 and T15 glycosylated in red. The shift of the signals
is represented by a green arrow (glycosylation of T3) and blue arrow (glycosylation of T15); B. Scheme of GalNAc-T3 orientation upon T15 glycosylation. ... 59 Figure 3.45: Overlap of the 1H,15N-HSQC spectrum of MUC1-4TR with T3 and T15 glycosylated in
red and the 1H,15N-HSQC spectrum of the final product tri-glycosylation product in green. The shift
of the signals is represented by green arrows (glycosylation T3), blue arrows (glycosylation of T15) and dark red arrow (glycosylation of S14). ... 60 Figure 3.46: Overlap of the STD spectrum (blue) and Off-resonance (red) of the spectrum T3-Tn with GalNAc-T3. The epitope obtained and the STD percentage scale used. ... 61 Figure 6.1: Structure of the Tn-glycopeptide mimetic with the sequence APD(Hnv)*RP (* indicates the site of Tn-glycosylation). ... 72 Figure 6.2: 1H-NMR spectrum assignment of the region NH (9 ppm to 7 ppm) for the glycopeptide
APD(Hnv)*RP (* indicates the site of Tn-glycosylation). ... 73 Figure 6.3: 1H-NMR spectrum assignment for the region 4.8 to 3.4 ppm for the glycopeptide
APD(Hnv)*RP (* indicates the site of Tn-gçycosylation). ... 74 Figure 6.4: 1H-NMR spectrum assignment for the region 3.3 ppm to 0.8 ppm for the glycopeptide
APD(Hnv)* RP (*indicates the site of Tn-glycosylation). ... 75 Figure 6.5: Scheme of the expression vector pET-21, obtained from NZYTech. This expression vector contains 5443 bp and Ampicillin resistance... 76 Figure 6.6: 1H-NMR spectrum assignment of the TF-Thr. ... 78
Figure 6.7: Structure for the TF-Thr. ... 78 Figure 6.8: Structure of the glycopeptide with the sequence PDT*RP (* indicates the site of TF-glycosylation). ... 79
Figure 6.9: 1H-NMR spectrum assignment for the NH region, corresponding to the region of 9.5 ppm
to 7.0 ppm, for the TF-glycopeptide PDT*RP (* indicates the site of TF-glycosylation). ... 80 Figure 6.10: 1H-NMR spectrum assignment for the region of 4.6 ppm to 3.2 ppm, for the
TF-glycopeptide PDT*RP (* indicates the site of TF-glycosylation). ... 81 Figure 6.11: 1H-NMR spectrum assignment for the region of 2.8 ppm to 1.2 ppm, for the
TF-glycopeptide PDT*RP (* indicates the site of TF-glycosylation). ... 82 Figure 6.12: Scheme of the expression vector pHTP-KSI, obtained from NZYTech. This expression vector contains 6354 bp and Kanamycin resistance. ... 83 Figure 6.13: 1H-NMR spectrum assignment for the glycopeptide T3-Tn... 85
List of Tables
Table 3.1: Values obtained of absorbance at 280 nm and 320 nm and concentration. ... 40
Table 6.1: Characteristic chemical shift pattern for each amino acid in 1H,1H-TOCSY. ... 71
Table 6.2: Composition of the LB Medium. ... 77
Table 6.3: Composition for the M9 Minimum Medium. ... 77
Table 6.4: Composition of LB Medium. ... 84
List of Abbreviations
Ala (A)- Alanine Arg (R)- Arginine Asn (N)- Asparagine Asp (D)- Aspartic acid
BLI- Bio-layer Interferometry technique BMRB- Biological Magnetic Resonance Bank CBP- Carbohydrate Binding Protein
Cys (C)- Cysteine
CRD- Carbohydrate Recognition Domain CSP- Chemical Shift Perturbation
Da- Dalton
DTT- Ditriothreitol
EDTA- Ethylenediaminetetraacetic Acid ER- Endoplasmatic Reticulum
FL- Full Length Gal- Galactose Gal-3- Galectin-3
GalNAc- Acetylgalactosamine
GalNAc-Ts- Uridine Diphosphate N-Acetylgalactosamine polypeptide N-Acetylgalactosaminyl-Transferases
Gln (Q)- Glutamine Glu (E)- Glutamic acid Gly (G)- Glycine His (H)- Histidine Hnv- Hydroxy-Norvaline
HSQC- Heteronuclear Single Quantum Coherence Ile (I)- Isoleucine
IPTG- Isopropyl β-D-1-Thiogalactopyranoside ITC- Isothermal Titration Calorimetry
K- Kelvin Ka- Association Constant KD- Dissociation Constant LB- Luria-Bertani Medium Leu (L)- Leucine Lys (K)- Lysine
mAb- Monoclonal Antibody
MALDI-TOF- Matrix-Assisted Laser Ionization- Time-of-flight Mass Spectrometer MGL- Macrophage Galactose-type Lectin
MUC1- Mucin-1
MUC1-4TR- A mucin-1 construct with 4 Tandem Repeats of 20 amino acids Neu5Ac- N-Acetylneuraminic Acid
NHAc- N-Acetyl group
NMR- Nuclear Magnetic Resonance NOE- Nuclear Overhauser Effect
NOESY- Nuclear Overhauser Effect Spectroscopy PBS- Phosphate Buffer Saline
PDB- Protein Data Bank Phe (F)- Phenylalanine ppm- part per million Pro (P)- Proline
PTS region- Proline, Threonine and Serine region rpm- revolutions per minute
SEA domain- sea urchin sperm protein, enterokinase and agrin domain of the glycoprotein MUC1 Ser (S)- Serine
STD- Saturation Transfer Difference STn- Sialyl Tn
STF- Sialyl TF
T1- Longitudinal Relaxation Time T2- Transversal Relaxation Time
TACAs- Tumor-Associated Carbohydrate Antigens TF or T-antigen- Thomsen-Friedenreich antigen Thr (T)- Threonine
Tn-antigen- Thomsen nouvelle antigen TOCSY-Total Correlation Spectroscopy TRIS-Tris(hydroxymethyl)aminomethane Trp (W)- Tryptophan
TSP- Trimethylsilylpropanoic acid Tyr (Y)- Tyrosine
UDP- GalNAc- Uridine Diphosphate N-Acetylgalactosamine Val (V)- Valine
1. Introduction
1.1. Carbohydrate-protein interactions
Carbohydrates coat every living cell on Earth. Furthermore, carbohydrate interactions with extracellular receptors, like lectins, antibodies, enzymes (Figure 1.1) play a key role in several biological processes, such as, cellular transport and adhesion, cell signaling processes, cell-cell communication, immune response, hyperacute rejection of tissue transplants of nonhuman sources, fertilization, tissue maturation, apoptosis, blood clotting, infection by bacterial and viral pathogens, tumor growth and metastasis [1]. Therefore, determination of the structural and conformational features that govern the molecular recognition of these biomolecules is of paramount importance [2-7]. So, understanding the structure and function of carbohydrates is crucial to realize their function in health and disease, as well as, to develop new glycan-based therapeutics.
Figure 1.1: Examples of carbohydrate-protein interactions. GalNAc represents N-acetylgalactosamine; GlcNAc: N-acetylglucosamine; Neu5Ac: N-Acetylneuraminic Acid; Gal: Galactose; Fuc: Fucose; Man: Manose and Glu: Glucose [1].
Carbohydrate-protein complexes can be achieved by different kinds of forces, due to the amphipathic character of oligosaccharides, in the recognition process [2,3]. Carbohydrate-protein interactions are more dynamic than other protein-ligand complexes and their affinity arises from several weak interactions. Carbohydrate-binding specificity results in the balance of electrostatic, hydrogen bonding and hydrophobic interactions between the protein, solvent and the carbohydrate, resulting in changes of enthalpy and entropy after binding [8].
The hydroxyl groups of oligosaccharides can make intermolecular hydrogen bonds to side chains of polar amino acids. The residues more frequently found in intermolecular hydrogen bonds with carbohydrates are Asp, Asn>Glu>Arg, His, Trp, Lys>Tyr, Gln>Ser, Thr [9]. Hydrogen bonds play a major role in protein-carbohydrate interactions. They convey stability, give specificity and control
Extracellular
Intracellular
GlcNAc
GalNAc Neu5Ac Gal Fuc Man Glu
Antibody Lectin Enzyme Virus Bacterium Dendritic Cell
dynamics. They are stable enough to contribute to the affinity and are highly directional, which gives them specificity. Furthermore, the characteristic stereochemical arrangement of hydroxyl groups plays a key role in protein specificity towards a given sugar type [10,11]. In addition, there are various characteristic phenomena in carbohydrate-protein interactions: i) cooperative hydrogen bonding, where the same hydroxyl group can act as the donor and acceptor of hydrogen bonds; ii) bidentate hydrogen bonds established between two adjacent hydroxyl groups of a sugar and both carboxylate oxygens of either aspartic or glutamic acids; iii) salt bonds between charged residues of some sugar units and protein residues of opposite charge; iv) some proteins require coordination of a divalent cation to connect certain sugar hydroxyls and negatively charged aspartates or glutamates [11].
In protein-carbohydrate complexes, it is also possible to observe van der Waals interactions between the carbohydrate and nonpolar aromatic or aliphatic residues, like Trp, Phe, Tyr, Leu, Val and Ala [9]. This interaction is very common in recognition sites of proteins and mediates the interaction between carbohydrates and the aromatic residues of the side chains of Trp, Tyr, Phe and His of the receptors. They have origin in dispersion forces, which have an impact on the enthalpy of the process. Depending on the stereochemistry of the saccharide the nonpolar C-H patch can interact with the aromatic residues of the protein side chains, by van der Waals, CH-π and hydrophobic interactions. These interactions have an entropic contribution, by protecting both apolar surfaces from the bulk water and an enthalpic contribution by formation of three non-conventional hydrogen bonds between the sugar hydrogens and the aromatic ring. The nature and structure of the solvent molecules and the way they behave (individual or bulk) are important to determine the specificity or lack of interaction between two different entities or between any entity and the solvent [2,3,11,12].
Besides, intermolecular interactions between carbohydrates and proteins, interactions with water molecules at the binding site also provide additional intra and intermolecular connections important to stabilize the complex. The water molecules occupy the sugar-binding site of free proteins, orienting the key residues, thus the binding site can be preorganized to accommodate the ligand, in a way that the entropy loss is minimized in the formation of the complex [9].
However, the level of importance of carbohydrate-protein interactions depends on the architecture of the binding site and chemical nature of the interacting sugar. The patterns of recognition for neutral, positively charged and negatively charged sugars are very distinct. Another factor is the number of valency used in the formation of these interactions[9].Normally, carbohydrate-protein interactions are very selective, but with very weak affinity. This affinity can be enhanced by multivalent interactions. These interactions are characterized by the binding of multiple ligands through noncovalent interactions on multiple receptors, simultaneously [13,14]. Multivalent interactions convert weak monovalent interactions into strong, highly specific and thermodynamic and kinetic stable recognition events [14]. A multivalent ligand has multiple copies of a recognition element in a central scaffold, in this case, multiple carbohydrates. (Figure 1.2) These types of interactions, with multivalent ligands can access receptor-binding modes inaccessible to monovalent compounds [15]. Therefore, are extremely important in various recognition processes, like the interactions between carbohydrate and lectins [16].
Receptors can also adopt multivalent presentation. In fact, multivalency of receptors is as important as, the multivalency of ligands. Multivalent recognition of substrates requires a large contact area and enough complementary recognition sites, which can be achieved by multiple interactions through a
combination of amino acids and nucleotides [17]. Multivalency of receptors is important in many biological phenomena, such as agglutination of carbohydrates by lectins and antigen-antibodies interactions [17,11].
Figure 1.2: Differences in the binding interactions between a monovalent interaction and a multivalent interaction.
[14].
In comparison to proteins, carbohydrates are flexible molecules containing several bounds with free rotation, so they often populate multiple conformational families, requiring both temporal and spatial descriptors to quantify their conformational properties [18,6].
X-ray crystallography is used to extract structural data (conformational features and intermolecular interactions) from crystalline molecules, but depends on the size of the molecule and its ability to form crystals. For small disaccharides or oligosaccharides crystallization in the unbound state may be very difficult. However, oligosaccharides can be crystallized covalently linked to the peptide chain or as ligands complexed with the macromolecular receptor. Noteworthy, the glycan moiety is often poorly resolved, with only one or two carbohydrate residues seen [19]. Furthermore, the Ka values of carbohydrate complexes are typically weak, ranging from 102 to 106 M-1, making the crystallization of the
complex sometimes very difficult [4].
Therefore, a multidisciplinary approach that combines distinct structural techniques like X-ray crystallography, NMR spectroscopy, molecular modeling protocols complemented with biophysical binding methods, are the best choice to achieve the binding and dynamics of the carbohydrate-protein recognition process.
1.2. Glycosylation on proteins
The addition of glycans can modulate the structure and function of the proteins where they are attached, by altering their 3D structure, making modifications on their surface and extending as large molecular masses away from them. By directly interacting with protein surfaces, they partially occlude regions of the protein surface and reduce the protein dynamics, due to their large mass and inertial resistance [8,20]. Hence, carbohydrates linked to the proteins can alter their properties and biological activity, by making them more soluble, influencing their stability and protecting them from proteolysis. They are inserted by a co or post-translational modification of proteins, called glycosylation. This modification is the most common and complex post-translational modification in proteins and is classified by the way the carbohydrate is bonded to the protein. The most common forms of glycosylation are the N-glycosylation and the O-N-glycosylation [7, 21].
While, both types of glycosylation have the same purpose, the covalent addition of carbohydrates to different biomolecules, they have different mechanisms. The N-glycosylation is initiated in the endoplasmatic reticulum (ER) with the transfer of preassembled blocks of lipid-linked carbohydrates, onto the N-atom of the side chain of an asparagine in forming proteins and terminates in the Golgi apparatus. It requires a sequon, a consensus sequence motif of Asn-Xaa-Ser/Thr, where Xaa can be any amino acid except Pro; whereas in O-glycosylation, there is no defined consensus sequence, but generally the residues glycosylated are Ser/Thr located in Pro-rich sequences, especially in the position -1 and +3 of the glycosylation site. These residues must be accessible and exposed, in finished and folded proteins. It’s initiated in the Golgi apparatus and starts with the addition of a GalNAc residue to the hydroxyl oxygen of a Ser/Thr. After this step, other monosaccharides are added in a complex and controlled stepwise enzymatic manner to build linear or branched structures, forming O-glycans smaller and less branched than N-glycans [22, 23, 20, 24].
Most glycoproteins exhibit both types of glycans, since both have distinct effects in their structure and properties. N-glycans are important during the folding process and in the detection of incorrectly folded proteins. They also decrease the conformational mobility of the peptide backbone. O-glycans increase the stability in helices [7].
1.3. Glycosylation and cancer
Alteration in the glycosylation pattern of proteins and lipids has a strong impact in the biology of the cell with strong impact in many neoplastic transformations, like cancer [25].
In cancer, the altered glycosylation of glycoproteins and glycolipids, affect both N- and O-glycans, during cancer progression. Some of the most common alterations are excessive sialylation and fucosylation of glycans, increased branching of N-glycans and incomplete biosynthesis, resulting in truncated glycans [25]. N-glycans, in cancer cells are associated with invasion and metastization. O-glycans are also highly overexpressed. The major carriers of O-O-glycans in cancer are mucins, glycoproteins with 50 to 90 % of their molecular mass as O-linked glycans [26,25], due to their repetitive sequences rich in serine and threonine (tandem repeats), known as the PTS region. Normally, they contribute to the protective mucous gel through O-glycosylated tandem repeats that form rod-like structures, extended from the cell surface [27]. However, when aberrant glycosylated, mucins facilitate cell adhesion during tumor metastasis and alter the function of proteins interacting with their carbohydrate
moieties [28]. In cancer cells, mucins are overexpressed and aberrantly expressed, in contrast to their restricted and tissue-specific expression in normal cells. These modifications of mucin expression sometimes are linked to modified glycosylation. Their overexpression amplifies cancer cells’ surface alterations and elevated concentrations are associated with elevated tumorigenesis and poor prognosis, making them good cancer biomarkers [25].
1.3.1. Mucin-1 (MUC1)
Mucin-1 (MUC1) was the first mucin to be cloned from mammary carcinomas and is also the best characterized to date [29]. MUC1 is a transmembrane glycoprotein of 500-1000-kDa heavily O-glycosylated expressed in the apical surfaces of ductal and glandular epithelial cells [30]. The full-length MUC1 encodes the N- and C-terminal subunits (Figure 1.3). The N-terminal subunit of MUC1 is composed by most of the extracellular domain and contains a variable number of 20-120 tandem repeats (VNTR) of a polymorphic sequence of 20 amino acids, with five potential sites for O-glycosylation in serine and threonine residues (HGVTSAPDTRPAPGSTAPPA, underlined the 5 potential sites of glycosylation) [31, 32, 33, 28]. The MUC1 extracellular domain extends 200-500 nm above the plasma membrane, beyond the 10 nm of glycocalyx [33]. The VNTR of MUC1 has three relevant regions: the GVTSA, a good substrate for GalNAc transferases; the PDTR the most immunogenic domain of MUC1 and a well-known epitope recognized by several anti-MUC1 antibodies and the GSTA which is recognized by different antibodies and represents a potential tool for diagnosis and therapeutic applications [34].
The C-terminal subunit is composed by 58 amino acid residues of an extracellular domain, a single hydrophobic spanning transmembrane domain (28 amino acids) and a cytoplasmatic tail of 72 amino acids with various tyrosine, serine and threonine phosphorylation sites that can bind to various signaling motifs (kinases and growth factor receptors) [31].The later interactions affect and regulate several cancer processes, like the proliferation, apoptosis and transcription of various genes [32, 33, 35, 28].
Figure 1.3: Schematic representation of the structure of MUC1. The N-terminal constituted by the VNTR domain and the SEA domain, while the C-terminal composed by the Transmembrane domain, Cytoplasmic domain and some residues of the Extracellular domain [31].
In normal cells (Figure 1.4 A), MUC1 is restricted to the luminal side of the cells [33]. The protein backbone is extensively O-glycosylated and characterized by complex sugar chains, usually branched core 2 O-glycans extending from an α-O-GalNAc unit directly linked to the hydroxyl group of either serine or threonine. Typically, core-2 can be elongated by several lactosamine units and usually terminate with fucose and/or sialic acid [30]. The clustering of O-linked negatively charged glycans leads to an extended protein core, long and with a rod-like molecule far above the plasma membrane. It has a protective role in the modulation and retention of secreted mucins, by providing a scaffold for the presentation of glycans for recognition of bacteria and viruses. MUC1 also lubricates the cell, keeps it hydrated and protects it from pathogen invasion [32, 36, 35, 30]. The peptide core is masked by the sugar moieties, which protects it from proteolytic cleavage by environmental enzymes and stabilizes mucins at the cell surface [31].
In tumor cells (Figure 1.4 B), the cell polarity is lost, resulting in MUC1 expression in the entire cell surface [33]. This overexpression contributes to an aggressive tumor phenotype where the extended peptide core inhibits the normal cell-cell and cell-matrix interactions. Furthermore short, truncated and prematurely O-glycans are now expressed acting as ligands for protein receptors on endothelial cells and strongly contributing to immune invasion and metastasis [35, 36, 31, 30].
Figure 1.4: A- MUC1 in normal cells, normally glycosylated and expressed only at the cell surface; B- MUC1 in
cancer cells, where it is overexpressed and aberrantly glycosylated. [37]
1.3.1.1.
MUC1 and tumor-associated carbohydrate antigens (TACAs)
These O-glycans dubbed tumor-associated carbohydrate antigens (TACAs) are absent in normal cells and commonly present in 90 % of the human carcinomas. The more common TACAs are the Tn (α-O-GalNAc-Ser/Thr), sialyl Tn (STn) (Neu5Acα2-6GalNAcα-O-Ser/Thr), TF (Galβ1-3GalNAc) and sialyl TF (STF) (NeuAcα2-3Galβ1-3GaNAc-O-Ser/Thr)-antigens (Figure 1.5). They are present not only in MUC1, but also in various secreted and membrane mucin proteins. Aberrant glycosylation of mucin glycoproteins is associated to a misregulation in the expression levels of glycosyltransferases, which may be caused by mutation, inactivation or lack of their functional chaperone proteins, the overexpression of sialyltransferases and disorganization of secretory pathway organelles in cancer cells [30, 38, 25].
Figure 1.5: Structure of TACAs.
1.3.1.2.
Interaction of TACAs with antibodies and lectins
TACAs are exposed to the immune system and have been used to design glycan-based cancer vaccines, including MUC1-based antitumor vaccines, with the main goal to educate the immune system to create antibodies [39]. In addition, several structural and recognition studies have been carried out to understand the minimal features that modulate glycan-antibody recognition [36, 30, 40]. In previous studies, this research group has already studied the interactions of Tn-antigen and two families of antibodies: anti-MUC1 and anti-Tn. The anti-MUC1 antibodies bind the MUC1 peptides in a strict peptide-sequence-dependent manner, with improved binding affinity, after the introduction of the GalNAc residue at the more immunogenic region of MUC1 sequence (PDTRP) [41]. The anti-Tn monoclonal antibodies only recognize Tn-glycopeptides. However, the type of residue glycosylated (Ser/Thr) modulates the binding. The anti-Tn antibodies used on the study have preference to the Tn linked to the serine residue[41].
TACAs can also be sensed by endogenous lectins, which translate the appearance of the new sugar signal into cellular activities [42, 43]. In this context, this research group studied the interactions between the Tn antigen and human macrophage galactose-type lectin (MGL) by STD-RMN experiments in tandem with molecular dynamic simulations [44].MGL is a C-type lectin expressed in the surface of monocyte-derived immature dendritic cells and macrophages and is proposed to act as an immune-modulatory receptor. This lectin binds the Tn antigen carried by MUC1 in colon cancer cells and activates dendritic cells to uptake these antigens in a MGL-mediated way [45, 46]. Structural studies demonstrate that MGL binds preferentially to Tn and sialyl-Tn antigens and recognition occurs mainly through the GalNAc moiety [44, 47, 48]. However, some protons of close amino acids also received saturation, which means that MGL also contacts with amino acids. MGL also binds galactose, however has a high degree of selectivity towards GalNAc. This is explained by the fact that the NHAc group of the GalNAc residue forms additional hydrogen bonds and CH-π interactions with MGL residues [44].
Another very studied and important lectin in cancer progression is galectin-3 (Gal-3), which is an animal lectin that belongs to the family of carbohydrate-binding proteins (CBPs) with affinity for β-galactosides commonly present in glycoproteins [49-51]. Gal-3 has approximately 31 kDa and is composed by a conserved sequence of approximately 130 amino acids, responsible for the carbohydrate-binding activity, the carbohydrate region domain (CRD) and a flexible non-lectin domain made of 7-14 tandem repeats of a short nine proline/glycine/tyrosine-rich consensus sequence with a total of 120 amino acid residues [52, 53, 49, 54]. Gal-3 is the only galectin classified as Chimera-type with the ability to form pentamers after binding to multivalent carbohydrates by self-association of the N-terminal non-lectin region (Figure 1.6) [50, 55].
Figure 1.6: Structure of galectin-3 monomer and its pentamer form. [50]
In cancer, Gal-3 is widely expressed by epithelial and immune cells and depending in the place, where it is expressed, its functions will be different [51]. Gal-3 exhibits specific affinity for the Thomsen-Friedenreich (T or TF) antigen. This antigen contains a galactose residue β1-3 linked to an α-N-acetylgalactosamine linked to a serine or threonine residue of a glycoprotein. As Tn-antigen, TF-antigen is normally occulted by further glycosylation, however in cancer cells is exposed to interact with Gal-3. These interactions are responsible for the enhancement of cancer cell-endothelial adhesion and promote metastasis [28]. The binding of TF-antigen by Gal-3 was previously explored [56, 57]. X-ray crystallography of the complex showed that the glycans bind in a concave surface of β-strands, especially the S4-S6 strands. The crystal structure showed that the Gal-moiety interacted with the residues His158, Asn160, Arg162, Asn174, Trp181 and Glu184 by hydrogen bonds or van der Waals contacts, while the GalNAc residue uses a hydrogen bond network of two water molecules, where one of them interacts with the residue Arg186 and the oxygen in the carbohydrate ring of GalNAc and the other interacts with the residue Glu165 and the NHAc group of GalNAc (Figure 1.7) [56, 57]. Recently isothermal titration calorimetry (ITC) studies showed that the presentation of the carbohydrate by the natural peptide backbone contributes to the enhanced affinity for Gal-3 [57].
Figure 1.7: Representation of the X-Ray Crystallography structure obtained with the different types of interactions between Gal-3 and TF-antigen. [56]
1.4. GalNAc-Ts and the biosynthesis of O-glycans
Mucin-type O-linked glycans constitute 80 % of all mammalian cancer antigens. The glycosylation pathway of mucins is initiated with the formation of the Tn antigen, by the transfer of GalNAc from UDP-GalNAc, a sugar donor, to the hydroxyl group in the side chain of a serine or threonine residue and is controlled by the large family of UDP-GalNAc-polypeptide N-acetylgalactosaminyl-transferases (GalNAc-Ts), localized in the Golgi apparatus [25, 58].
GalNAc-Ts family encodes 20 different isoforms that present different tissue expression and acceptor substrate specificities which provide them unique functions depending on the cell type and organ where they are expressed. GalNAc-Ts control the sites and density of O-glycan occupancy of the mucin tandem repeats. There are sites of proteins that can be glycosylated by more than one GalNAc-T enzyme (redundant sites). However, there are others that are restricted for one specific GalNAc-T.
From a structural perspective, GalNAc-Ts hold a catalytic domain attached via a flexible linker to a ricin-like lectin domain [59]. Both domains are essential for efficient O-GalNAc glycosylation. The lectin domain on the GalNAc-Ts may be mobile and its location relative to the catalytic domain varies among isoforms [60]. The recognition of O-glycosylation sites by GalNAc-Ts depends whether these enzymes interact with naked or previous glycosylated regions of the substrate. While naked peptides appear to be exclusively recognized by the catalytic domain, glycopeptides recognition relies on the cooperative mechanism between the catalytic and lectin domain [61]. Lectin domain mediates the GalNAc-peptide substrate specificity also increasing the efficiency of the enzymatic action [62].
Although some GalNAc-Ts structures have been reported, the structural features of the peptide substrates recognition by distinct GalNAc-Ts, as well as, the dynamic landscape between the lectin and catalytic domains upon glycosylation remain uncertain [59].
Misregulation in expression and activity of specific GalNAc-Ts has also a significant influence in cancer biology by affecting cell differentiation, adhesion, invasion and metastasis [63-65]. The altered
expression and activity of distinct GalNAc-Ts, namely GalNAc-T2, T3, T6 and T12, may be one of the mechanisms involved in changes in mucin O-glycosylation during malignant transformation [25].
In particular, GalNAc-T3 exhibits a high expression in several human cancers [63-65]. Overexpression of this enzyme strongly correlates with shorter survival rates, more aggressiveness, probability of metastasis and reoccurrence after operation [66, 63]. Inhibition of GalNAc-T3 expression in ovarian [67], renal [64], early stage squamous gastric [68, 69], esophageal [69], oral squamous [63] and pancreatic cancer cells inhibit their invasive capacities arguing GalNAc-T3 a potential target for developing new cancer therapies [66, 67, 63, 64, 58]. While, in colorectal [70], non-small lung and lung [71, 72], gallbladder [69], extrahepatic bile duct [69], gastric [73], hepatocellular [74], pancreatic cancer cells [65], the loss or decrease of expression of GalNAc-T3 shows the opposite effect, in poorly differentiated cancer cells. This shows that the correlation between GalNAc-T3 expression and prognosis depends on specific type of tumors [65] and that GalNAc-T3 can be a useful parameter for clinical management, especially in an early post-operative phase [63].
GalNAc-T3 glycosylates preferentially peptide sequences with valine in position -1 [24]. In the particular MUC1 sequence PDTRPAPGSTAPPAHGVTSA, the threonine residues in -TS- and -ST- are glycosylated and to a lesser degree the S in -ST-, while the isolated threonine in -DTR- is not. GalNAc-T3 shows preference in initiating MUC1 glycosylation at the T in -TS- and only after finishing, does it proceed to -ST- sites, the opposite of GalNAc-T2 [75].
Rationalizing at the molecular level the interactions between the lectin and catalytic domain of GalNAc-T3 and MUC1 peptides and glycopeptides will be of great value for the rational design of inhibitors that target the lectin or/and catalytic domain to regulate GalNAc-T3 activity in cancer.
1.5. Methodology
The study of carbohydrate-protein interactions has impact on medical research, namely in the field of cancer. Several antibodies are under clinical trials that target glycan-binding proteins or glycan-antigens expressed in cancer cells [76-80].
From this perspective is of paramount importance to understand the recognition process at a molecular and atomic level of carbohydrates by lectins, antibodies and enzymes. Structural, conformational and dynamic knowledge of the molecular recognition processes between carbohydrates and their macromolecular targets has the potential to explain binding and selectivity, as well as, to assist in the design of new molecular probes for diagnosis and novel sugar-based drugs and vaccines.
Structural information can be obtained by X-ray Crystallography or NMR Spectroscopy combined with computational methods [9]. X-ray Crystallography has been used to characterize various biomolecules complexes, however, the resulting structures are static pictures of the stabilized complexes. Indeed, the characteristic flexibility of carbohydrates can be critical in the recognition process and in most of the cases cannot be reflected in the crystal structure. In addition, the Ka values of carbohydrate-protein
complexes are weak, only improved by multivalence effects, making its crystallization difficult. Therefore, to complement X-Ray results, it can be also used a combined approach of NMR and computational studies, where each technique offers different features of the binding process [81, 4, 11, 9, 82].
NMR techniques can have a very wide range of utilities, which can go from identification of new ligands for carbohydrates-binding proteins, the determination of the ligands epitopes and protein groups which are involved in the recognition to the description of the dynamics and conformational features of the complexes. The application of a multidisciplinary strategy, combining the experimental data with molecular simulations and modelling is the best to characterize the main structural features that govern the recognition of saccharides by receptors [81, 4, 11].
In NMR, two different approaches can be employed to investigate ligand-receptor interactions: the receptor or ligand-based approach. The choice of the method depends on the problem and the required structural information, especially the off-rate of the dissociation process and the receptor’s size. If the exchange conditions between free and bound state are fast and the binding transient to weak, it’s more suitable to use ligand-based methods and follow the ligand’s parameters. However, if the receptor’s size allows, chemical shift and relaxation of protein resonances can be analyzed in free and bound states, using receptor-based methods. In these cases, the binding regime is slow to intermediate, meaning the binding is weak or irreversible [4, 82].
1.5.1. Protein-based Methods
In protein-based methods, the interaction studies between small CBPs and carbohydrates can be done, by monitoring the chemical shift or line-width variations of specific proton resonances of the CBP, during the binding event [11]. These methods require selective isotopically labelled receptors and specific resonance assignment of the protein NMR spectra [82].
However, these methods depend on the observation of the protein signal and are limited by the protein molecular weight, usually below 30 kDa, but this limit can be extended to 100 kDa by using methods involving deuteration of the protein or selective residue labelling. Furthermore, the advances in methodology and the access to high field magnets are increasing the limits of NMR spectroscopy and study of biomolecules with large molecular size and complexity is now possible [82].
Receptor-based methods give information on the residues directly involved in the recognition. However, for large proteins, it is essential isotope labeling with 13C or 15N, unless the binding process is
monitored by the ligand perspective. By adding another dimension with the isotope labeling it reduces the spectral overlap and helps in the resonance assignment. The most used spectrum for protein assignment is the heteronuclear correlation spectrum 1H,15N-HSQC. This spectrum is also considered as the fingerprint
of the protein, since it correlates the N-H pair, showing in the spectrum every backbone amide hydrogen peak. The dispersion of the peaks is a consequence of the different chemical environments generated by the three-dimensional structure of the protein [82].
Since the chemical shift is very sensitive to structural changes in the local environment binding of a ligand will produce a chemical shift perturbation (CSP) in the N-H pair. Experimentally successive
1H,15N-HSQC spectra are recorded, in a titration of the protein with the ligand. When ligand binds, the
chemical environment of the protein backbone changes due to the presence of the ligand and their chemical shift is altered. This happens usually to residues directly involved in the binding. The alteration in the 1H,15N-HSQC spectra of the protein will depend on the type of chemical exchange regime between
the free and bound protein and on the strength of the interaction with the ligand. In some of the cases it is also possible to estimate the dissociation constant, KD [82].
When a ligand binds reversibly to a receptor, this binding has an association constant, which normally range from 102 to 1012 𝑀−1. If the exchange between free and bound state is slow, in the spectrum it is observed two sets of signals, one corresponding to the resonances of the free protein and another for the complex. With the increase of the concentration of the ligand, the intensity of the signals corresponding to the free protein will be reduced with simultaneous increase in the intensity of the corresponding signals of the complex[82]. (Figure 1.8 A) The complex is formed instantly, so in those cases it is needed low ligand-to-protein ratios to make the identification of the perturbed residues in the interaction. From this type of experiment, it is possible to determine the apparent KD based on the intensities of the free and
bound signals of the protein. This method was used to study the binding of hexaacetyl chitohexaose to MoCVNH-LysM [83].
However, for complexes with carbohydrates these are weaker and range from 102 to 106 𝑀−1, due to
the association rate being rapid, limited only to molecular diffusion. The dissociation rates are also rapid, allowing a fast exchange between the free and bound states of the ligand [5]. In fast exchange, it’s only possible to observe one resonance, in the HSQC spectrum, with its position determined by the population of free and bound protein. The shift in the chemical shift observed in this type of experiment, is due to the decrease of the free population of the protein and the increase of the population in bound protein, with the increase of ligand concentration [82]. (Figure 1.8 B) In those cases, it is needed a large ligand to protein ratio to observe the shifts and it is also possible to estimate an apparent KD value. This method was used
to identify the binding cleft of the family 11 carbohydrate binding module from Clostridium
thermocellum through protein titrations with cellotetraose and cellohexaose [82].
Figure 1.8: Representation of the chemical shift perturbation induced by interaction of an unlabelled small ligand and a 15N-labelled protein detected in 1H,15N-HSQC spectrum. A- Example of slow exchange interactions; B-
Example of fast exchange interactions. [82]
1.5.2. Ligand-based methods
Ligand-based methods can also be used to deduce the ligand-protein binding, through changes in motion, orientation and diffusion properties of the ligands, when passing from the free state to being recognized by a large receptor [82]. They require very small amounts of receptor and do not require stable isotope labelling [81].