F
ACULDADE DEE
NGENHARIA DAU
NIVERSIDADE DOP
ORTOContinuous Biometric
Identification on the Steering Wheel
João Tiago Ribeiro Pinto
Mestrado Integrado em Bioengenharia
Internal Supervisor: Jaime dos Santos Cardoso, PhD External Supervisor: André Ribeiro Lourenço, PhD
Continuous Biometric
Identification on the Steering Wheel
João Tiago Ribeiro Pinto
Mestrado Integrado em Bioengenharia
Approved in public examination by the Jury:
President: José Alberto Peixoto Machado da Silva, PhD Opponent: Ana Filipa Pinheiro Sequeira, PhD
Referee: Jaime dos Santos Cardoso, PhD Referee: André Ribeiro Lourenço, PhD
Resumo
Devido à grande quantidade de tempo que as pessoas passam dentro deles, os automóveis têm evoluído de simples meios de transporte para enormes gadgets, recheados de tecnologia de ponta para garantir conforto, funcionalidade e segurança. A biometria tem o potencial para permitir a personalização automática de definições de segurança, conforto, e condução, tais como a posição dos bancos e espelhos, destinos favoritos no GPS, ou controlo de velocidade, segundo a identidade do condutor. A maior escala, também poderá servir grandes empresas nas tarefas de supervisão e gestão de frotas, reconhecendo continuamente os condutores, para evitar fadiga, e apurar respons-abilidades em caso de acidente ou condução perigosa.
Esta dissertação visou o estudo aprofundado de novos métodos e do estado-da-arte em recon-hecimento biométrico baseado em ECG, com o objetivo final de formular um sistema biométrico eficaz e fidedigno capaz de usar sinais ECG off-the-person altamente ruidosos, adquiridos no volante. Tal tarefa exigiu ultrapassar a evidente prevalência de ruído, incluindo frequentes períodos de saturação, que foi possível através da comparação de diversos métodos de pré-processamento, deteção de picos R, normalização, e deteção de outliers. De igual forma, vários conjuntos de car-acterísticas e métodos de reconhecimento do estado-da-arte foram explorados, de modo a garantir os melhores resultados possíveis.
Apesar dos evidentes desafios oferecidos por tais circunstâncias, descobriu-se que a aplicação de segmentação do sinal em 5s, pré-processamento com Savitzky-Golay e um filtro de média móvel, segmentação de batimentos após deteção de picos R com Trahanias, e remoção de outliers baseada em clustering e correlação cruzada, foi capaz de limpar de forma significativa o sinal. Tendo batimentos médios relativamente limpos, características extraídas por DCT, seguidas de classificação com SVM, possibilitaram a obtenção de 2.66% EER e 91.82% IDR com sinais do volante, assim como 0.60% EER e 97.23% IDR com sinais da coleção UofTDB.
Este método, com treino limitado aos primeiros trinta segundos de dados, auxiliado por uma técnica de ponderação de decisões passadas, permitiu obter 11.77% EER e 69.63% IDR com sinais do volante. Estes resultados provam que, com desenvolvimentos adicionais e a inclusão de técnicas de atualização de templates/modelos, será possível desenvolver um sistema biométrico fidedigno, baseado em sinais ECG adquiridos no volante.
Abstract
For the great amount of time people spend inside them, cars have been evolving from mere means of transport to supersized gadgets, filled with top-notch software technology to increase comfort, functionality, safety, and security. Biometric recognition can be the key to automatic customisa-tion of security, comfort, and driving settings, such as seat and mirror posicustomisa-tions, GPS favourite locations, or speed monitoring, according to the driver’s identity. At a greater scale, it can also serve big companies in their fleet management and supervision tasks, continuously recognizing drivers to avoid fatigue, and apportion blame in case of reckless driving or accidents.
This dissertation aimed to perform an extensive study on prior art and novel approaches in ECG-based recognition, with the final goal of formulating a effective and reliable continuous bio-metric system, able to work with highly noisy, off-the-person ECG signals acquired at the steering wheel. This required overcoming the noticeable noise corruption, including frequent periods of sensor saturation, achieved through the extensive comparison of several denoising methods, R-peak detection algorithms, normalisation techniques, and outlier detection approaches. Likewise, various feature sets and recognition methods from the prior art were explored, in order to ensure the best results possible.
Despite the evident challenges brought by such settings, it was found that a succession of five-second signal segmentation, denoising with Savitzky-Golay and a Moving Average Filter, heart-beat segmentation after Trahanias R-peak detection, and outlier removal based on cross-correlation clustering, was able to significantly clean the signal. Having relatively clean ensemble heartbeats, DCT features followed by SVM classification enabled the achievement of 2.66% EER and 91.82% IDR with driving signals, as well as 0.60% EER and 97.23% IDR with signals from the public UofTDB collection.
The same method, under train settings constrained to the first thirty seconds of data, aided by a novel past score weighting procedure, was able to achieve 11.77% EER and 69.63% IDR with driving signals. These results prove that, with further improvements and the inclusion of template/model update techniques, it will be possible to develop a reliable continuous biometric system with ECG signals acquired on the steering wheel.
Acknowledgments
Ao Professor Jaime, pela atenção, pelas opiniões, pelas críticas, por toda a disponibilidade, pelo vasto conhecimento que sempre esteve pronto a partilhar, e por ser o melhor professor que tive o prazer de conhecer, um exemplo pela sua inteligência, conhecimento, simpatia, e humildade.
Ao Doutor André Lourenço, à Priscila, ao Carlos, ao Roberto, e ao Borja, todos os membros da equipa da CardioID Technologies que tive o prazer de conhecer, e que me receberam com toda a disponibilidade e simpatia, que partilharam o seu conhecimento comigo, que estiveram sempre prontos a ajudar, a dar ideias, e a esclarecer dúvidas.
Aos meus amigos, e a todos os meus colegas que me receberam de braços abertos neste curso. A muitos com os quais tive o prazer de trabalhar em projetos, e a tantos outros que me acompanharam no EMBS e no NEB. Em especial aos mais próximos, que me apoiaram sempre, e ainda mais durante esta dissertação.
Acima de tudo, aos meus pais, por aceitarem a árdua tarefa de ser meus pais, por me ensinarem quem sou, o valor da humildade, da verdade, do trabalho, e da dedicação, por me guiarem no melhor caminho e, no entanto, por sempre me garantirem a liberdade para o escolher. Também à minha irmã, aos meus padrinhos, e ao meu tio, por estarem sempre aqui, e me ensinarem o que é uma verdadeira família.
Obrigado.
The author also wishes to acknowledge the access to the UofTDB ECG Database, gracefully granted by Dr. Hatzinakos and Mr. Komeili, of the University of Toronto, that truly improved the quality of the work performed throughout this dissertation.
“You ever feel like every time we get close to getting the answers, somebody changes the question?”
Peter Bishop
Contents
1 Introduction 1
1.1 Biometric Recognition . . . 1
1.2 Automotive Biometrics: Challenges and Opportunities . . . 2
1.3 Research Goals and Contributions . . . 2
1.4 Dissertation Outline . . . 3
2 Electrocardiographic Signal Characterisation 5 2.1 Anatomy and Physiology . . . 5
2.2 Variability . . . 7
2.3 Acquisition . . . 9
2.3.1 Standard Medical Acquisition Settings . . . 9
2.3.2 Common Biometric Acquisition Settings . . . 12
2.3.3 Specific Driver Monitoring Settings . . . 12
2.4 Noise Contamination . . . 14
2.4.1 Standard Noise Sources . . . 14
2.4.2 Noise Sources in Driving Settings . . . 15
2.5 Biometrics Application: Challenges and Opportunities . . . 16
3 Biometric Recognition: Fundamental Concepts 17 3.1 Biometric Systems: The Basics . . . 17
3.2 Biometric Modalities . . . 18
3.3 Qualities of a Biometric Modality . . . 19
3.4 Common Structure of a Biometric System . . . 21
3.4.1 System Modules . . . 21
3.4.2 Operation Modes . . . 22
3.4.3 Conventional vs. Continuous Biometrics . . . 23
3.5 Performance Evaluation in Biometric Recognition . . . 25
3.5.1 Conventional Biometrics . . . 25
3.5.2 Continuous Biometrics . . . 30
3.5.3 The Biometric Menagerie . . . 32
3.5.4 Ideal Conditions for a Thorough Performance Assessment . . . 34
3.6 System Design Considerations and Concerns . . . 35
3.7 Summary and Conclusions . . . 36
4 ECG Signal Collections 37 4.1 The Significance of a Well-Structured Signal Database . . . 37
4.2 Publicly Available ECG Databases . . . 39
4.3 The CardioID ECG Collection . . . 44 ix
4.4 Summary and Conclusions . . . 44
5 ECG Biometric Recognition: Prior Art 45 5.1 Brief History Overview . . . 45
5.2 Acquisition Settings . . . 47
5.2.1 Electrode Number and Placement . . . 47
5.2.2 Sampling Frequency . . . 47
5.2.3 Subject Posture and Activity . . . 50
5.2.4 Subject Health . . . 50
5.2.5 Number of Subjects . . . 51
5.2.6 Acquisition Sessions . . . 51
5.2.7 Data Origin . . . 51
5.3 Preprocessing Methods . . . 52
5.4 Signal Preparation Techniques . . . 55
5.4.1 Reference Point Detection . . . 55
5.4.2 Signal Segmentation . . . 58
5.4.3 Amplitude Normalisation . . . 58
5.4.4 Time Normalisation . . . 59
5.5 Feature Extraction Methods . . . 59
5.5.1 Approach Types . . . 59 5.5.2 Features’ Domain . . . 63 5.5.3 Dimensionality Reduction . . . 64 5.6 Recognition Approaches . . . 65 5.6.1 Matching Methods . . . 65 5.6.2 Decision Methods . . . 66
5.7 Conventional vs. Continuous Biometrics . . . 70
5.8 Performance Achievements . . . 70
5.9 Summary and Conclusions . . . 72
6 Experimental Settings 73 6.1 Introduction . . . 73
6.2 Software and Hardware . . . 73
6.3 Signal Databases and Datasets . . . 74
6.4 Performance Evaluation . . . 76
6.5 Summary and Conclusions . . . 77
7 Signal Preprocessing 79 7.1 Problem Statement . . . 79
7.2 Selected and Proposed Methods . . . 79
7.2.1 Filters . . . 79
7.2.2 Moving Average and Median Filters . . . 80
7.2.3 Savitzky-Golay . . . 80
7.2.4 DWT-based Denoising . . . 81
7.2.5 DCT-based Filtering . . . 83
7.2.6 Empirical Mode Decomposition . . . 84
7.3 Results and Discussion . . . 86
7.3.1 Objective Assessment with Simulated Signals . . . 86
7.3.2 Subjective Comparison using Real Signals . . . 90
CONTENTS xi
8 Signal Preparation 95
8.1 Problem Statement . . . 95
8.2 Proposed Approach . . . 95
8.2.1 General Overview . . . 95
8.2.2 Reference Point Detection . . . 96
8.2.3 Segmentation and Normalisation . . . 102
8.2.4 Outlier Detection and Removal . . . 103
8.2.5 Ensemble Heartbeats . . . 105
8.3 Results and Discussion . . . 107
8.3.1 Reference Peak Detection . . . 107
8.3.2 Outlier Detection and Removal . . . 107
8.3.3 Ensemble Heartbeats . . . 110
8.4 Summary and Conclusions . . . 114
9 Feature Extraction and Dimensionality Reduction 115 9.1 Problem Statement . . . 115
9.2 Feature Extraction . . . 115
9.2.1 Autocorrelation Coefficients . . . 116
9.2.2 Cardioid Plots . . . 117
9.2.3 DCT Coefficients . . . 117
9.2.4 Fuzzy Tunable 1D Local Binary Patterns . . . 119
9.2.5 Haar Wavelet Transform Coefficients . . . 121
9.3 Dimensionality Reduction . . . 122
9.3.1 Linear Discriminant Analysis . . . 122
9.3.2 Principal Component Analysis . . . 123
9.4 Results and Discussion . . . 123
9.5 Summary and Conclusion . . . 125
10 Recognition 127 10.1 Problem Statement . . . 127
10.2 Selected Prior Art Approaches . . . 127
10.2.1 Support Vector Machine . . . 127
10.2.2 Nearest Neighbours . . . 128
10.2.3 Multilayer Perceptron . . . 128
10.2.4 Gaussian Mixture Model . . . 129
10.2.5 Gaussian Mixture Model - Universal Background Model . . . 129
10.3 Proposed Methods . . . 131
10.3.1 Naïve Bayes . . . 131
10.3.2 Naïve Bayes - Universal Background Model . . . 132
10.4 Additional Recognition Procedures . . . 134
10.4.1 User-Tuned Authentication . . . 134
10.4.2 Past Score Weighting . . . 134
10.5 Results and Discussion . . . 135
10.5.1 Conventional Performance Assessment and Benchmarking . . . 135
10.5.2 Continuous Performance Assessment . . . 137
11 Conclusion 143 11.1 Summary and Final Remarks . . . 143 11.2 Future Work . . . 144
A Decision Methods’ Optimisation 145
B Prior Art Overview 147
List of Figures
2.1 The anatomy of the heart. . . 6
2.2 A single heartbeat in an electrocardiogram. . . 7
2.3 The sequence of electrical conduction events in the heart, and its relationship with different portions of a heartbeat in an ECG signal. . . 8
2.4 Leads and electrode placement of the standard 12-lead configuration. . . 11
2.5 Leads and electrode placement of the corrected orthogonal configuration. . . 11
2.6 Electrode configurations used on off-the-person acquisition settings. . . 13
2.7 Steering-wheel-based ECG acquisition configurations. . . 14
3.1 The world of biometrics: currently used biometric traits. . . 20
3.2 Share of the 2015 biometrics market by modality. . . 20
3.3 Schematic of the modules of a biometric system, their main functions, and the inter-actions between them. . . 22
3.4 Schematics of the functioning of the identification and authentication modes, and the enrollment phase, in a biometric system. . . 24
3.5 Illustration of the operation difference between conventional and continuous bio-metric systems. . . 25
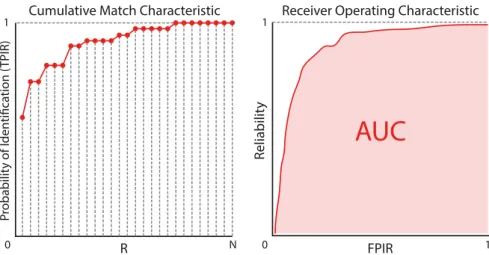
3.6 Examples of a Cumulative Match Characteristic (CMC) curve, and a Receiver Op-erating Characteristic (ROC) curve for an identification system. . . 28
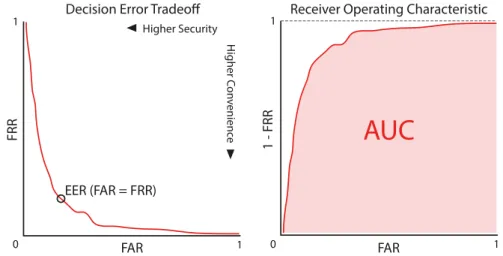
3.7 Examples of a Decision Error Tradeoff (DET) characteristic curve, and a Receiver Operating Characteristic (ROC) curve for an authentication system. . . 29
3.8 Evolution of False Acceptance Rate and False Rejection Rate with the threshold defined. . . 30
3.9 Example of a Usability-Security characteristic curve. . . 32
3.10 Illustration of the new classes of Biometric Menagerie. . . 34
5.1 Distribution per year of the surveyed publications about biometric recognition using the ECG. . . 46
5.2 Histogram showing the number of analysed research works in each range of number of subjects in the database used. . . 52
6.1 Structure of the driving dataset built from the continuous recordings of CardioID. . 74
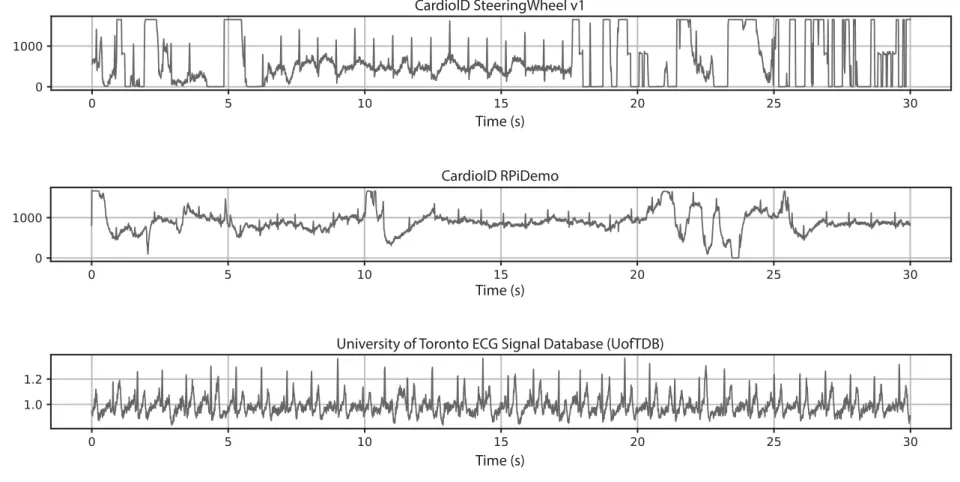
6.2 Example excerpts from the ECG databases used in this dissertation. . . 75
6.3 Illustration of the process of signal recording cropping into small, overlapping seg-ments. . . 76
7.1 Illustration of the DWT scales for four levels. . . 82
7.2 Scheme of DWT deconstruction for three levels. . . 82
7.3 Example of the EMD’s IMF set of an ECG signal excerpt. . . 85 xiii
7.4 Excerpt and frequency content of the noise-free signal generated with ECGSYN. . 87 7.5 Excerpt and frequency content of the simulated signal contaminated with noise from
standard off-the-person noise sources. . . 87 7.6 Excerpt and frequency content of the simulated signal contaminated with
driving-settings’ noise. . . 87 7.7 Average results of denoising using the explored methods on excerpts of various
lengths, contaminated with noise from standard off-the-person settings. . . 89 7.8 Average results of denoising using the explored methods on excerpts of various
lengths, contaminated with noise from driving settings. . . 90 7.9 Example of the results of the preprocessing methods on UofTDB signals (standard
off-the-person acquisition). . . 91 7.10 Example of the results of the preprocessing methods on real driving signals (from
CardioID SteeringWheel v1 collection). . . 92 8.1 General overview schema of the entire signal preparation process. . . 96 8.2 Example of the application and result of the Pan-Tompkins method for R-peak
de-tection on an ECG signal. . . 97 8.3 Structure of the Trahanias algorithm for R-peak detection. . . 99 8.4 Example of the application and result of the Trahanias method for R-peak detection
on an ECG signal. . . 100 8.5 Example of the application and result of the Engelse-Zeelenberg method for R-peak
detection on an ECG signal. . . 101 8.6 Outlier detection algorithm evaluation: number of templates marked as outliers
ver-sus the initial number of templates. . . 108 8.7 Outlier detection algorithm evaluation: comparison of the outlier detection
algo-rithms’ results, in sets with increasing number of templates. . . 109 8.8 Outlier detection algorithm evaluation: percentage of outliers detected versus initial
template set’s standard deviation. . . 110 8.9 Outlier detection algorithm evaluation: template set’s standard deviation before and
after outlier removal. . . 111 8.10 Outlier detection algorithm evaluation: evolution of time required with the total
number of templates in the set. . . 111 8.11 Ensemble heartbeats from each of the six subjects on the CardioID coach bus driving
database. . . 112 8.12 Ensemble heartbeats from each of the eight subjects on the Raspberry Pi simulated
database. . . 113 9.1 Autocorrelation and AC/DCT coefficients extracted from an example ensemble
heart-beat. . . 116 9.2 Cardioid plots and features from an example ensemble heartbeat. . . 118 9.3 Selected DCT coefficients extracted from one example ensemble heartbeat. . . 118 9.4 Illustration of one iteration of the application of the proposed Fuzzy Tunable 1D
LBPs feature extraction algorithm. . . 120 9.5 Illustration of the Haar Wavelet Transform coefficient features extracted from an
example heartbeat. . . 121 9.6 Average time required for the extraction of the explored feature sets from one
LIST OF FIGURES xv
10.1 Illustration of the UBM training and adaptation to a subject of the GMM/UBM method, on an example bidimensional feature space. . . 130 10.2 Illustration of the UBM training and adaptation to a subject of the Naïve Bayes UBM
method, on two dimensions of an example feature space. . . 132 10.3 Illustration of the past score weights relative to the samples’ distance to the current
sample. . . 135 10.4 Authentication EER and AUC results, for 70%-30% split on the driving dataset. . . 136 10.5 Authentication EER and AUC results, for 70%-30% split on the UofTDB dataset. . 136 10.6 Identification rate results, for 70%-30% split on the driving dataset. . . 138 10.7 Identification rate results, for 70%-30% split on the UofTDB dataset. . . 138 10.8 Authentication EER and AUC with 30 s train sets, when using posterior past score
weighting. . . 139 10.9 Authentication EER and AUC with 30 s train sets, without posterior past score
weighting. . . 139 10.10 Improvement brought by past score weighting to the authentication EER results. . . 139 10.11 Identification rate results, with 30 s train sets, on the driving dataset. . . 140
List of Tables
4.1 Summary of the technical specificities of the most commonly used publicly available ECG collections and the CardioID database. . . 41 5.1 Summary of the acquisition of the data used by the surveyed approaches. . . 48 5.2 Summary of preprocessing methods used on the surveyed approaches. . . 53 5.3 Summary of the use of signal preparation techniques by the surveyed approaches. . 56 5.4 Summary of the methods of feature extraction and dimensionality reduction used on
the surveyed approaches. . . 60 5.5 Summary of the matching and decision methods used on the surveyed approaches. . 68 5.6 Results of approaches evaluated with the PTB database. . . 71 5.7 Results of approaches evaluated with the MIT-BIH Normal Sinus Rhythm database. 71 5.8 Results of approaches evaluated with the MIT-BIH Arrhythmia database. . . 71 6.1 Status of the hundred subjects selected from the UofTDB collection. . . 76 7.1 Summary of the explored preprocessing methods. . . 86 7.2 Average run times of each preprocessing method explored, when applied to signal
segments of different durations. . . 94 8.1 R-peak detection results upon evaluation with segments of the UofTDB collection. 106 8.2 R-peak detection results upon evaluation with segments of the CardioID coach bus
driving database. . . 106 9.1 Feature sets separability evaluation: results of the conducted ten-fold cross-validation
task. . . 124 A.1 Optimised parameters of the various decision algorithms, for authentication using
the driving dataset. . . 145 A.2 Optimised parameters of the various decision algorithms, for identification using the
driving dataset. . . 146 A.3 Optimised parameters of the various decision algorithms, for identification and
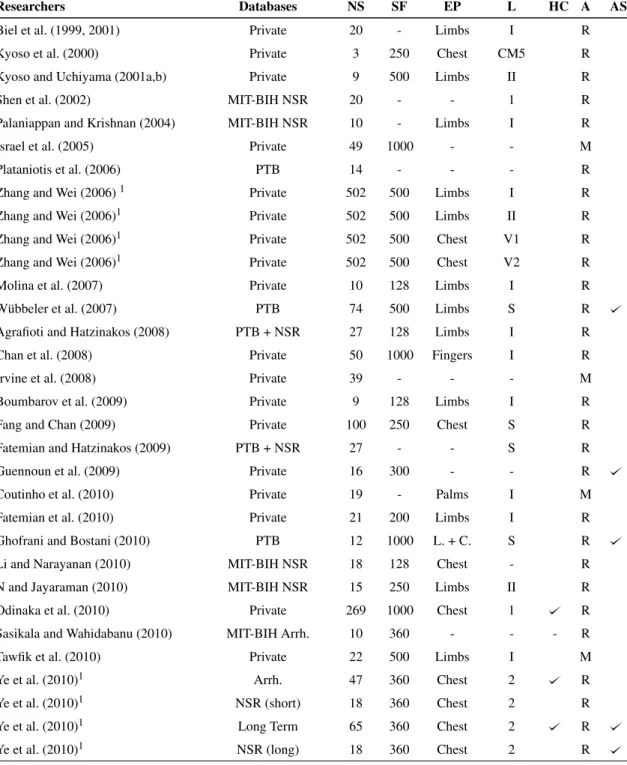
au-thentication, using the UofTDB dataset. . . 146 B.1 Summary of the surveyed prior art ECG-based biometric recognition approaches. . 148
Abbreviations
1D Unidimensional
1DMRLPB Unidimensional Multi-Resolution Local Binary Patterns
2D Bidimensional
3D Tridimensional
AC Autocorrelation Coefficients
AC/DCT Autocorrelation/Discrete Cosine Transform Coefficients AHA American Heart Association
AR Autoregressive AUC Area Under the Curve AV Atrioventricular (node) BPF Bandpass Filter
BVP Blood Volume Pressure BW Baseline Wander
cA Approximation coefficients cD Detail coefficients
CE Chaotic Encryption
CMC Cumulative Match Characteristic CNN Convolutional Neural Network CWT Continuous Wavelet Transform CYBHi Check Your Biosignals Here initiative DBNN Decision-based Neural Network DC Direct Current
DCT Discrete Cosine Transform DET Decision Error Tradeoff DNA Deoxyribonucleic Acid DTW Dynamic Time Warping DVD Digital Versatile Disc DWT Discrete Wavelet Transform ECG Electrocardiogram
ECU Electronic Control Unit EEG Electroencephalogram EER Equal Error Rate EH Ensemble Heartbeat
EMD Empirical Mode Decomposition EMG Electromyogram
FAR False Acceptance Rate FFT Fast Fourier Transform
FLDA Fisher Linear Discriminant Analysis
FMR False Match Rate
FNIR False Negative Identification Rate FNMR False Non-Match Rate
FOGD First-Order Gaussian Differentiator FPIR False Positive Identification Rate FRR False Rejection Rate
FT1DLBP Fuzzy Tunable Unidimensional Local Binary Patterns GBFS Greedy Best First Search
GBRT Gradient Boosted Regression Trees GMM Gaussian Mixture Model
GMM-UBM Gaussian Mixture Model/Universal Background Model GPS Global Positioning System
HLDA Heteroscedastic Linear Discriminant Analysis HMM Hidden Markov Model
HPE Hermite Polynomial Expansion HPF Highpass Filter
HRV Heart Rate Variability HTER Half-Total Error Rate
ICA Independent Component Analysis ID Identification
IDE Integrated Development Environment IDR Identification Rate
IMF Intrinsic Mode Function kNN k-Nearest Neighbours
KPCA Kernel Principal Component Analysis LBP Local Binary Patterns
LDA Linear Discriminant Analysis LLR Log-Likelihood Ratio
LMS Least Mean Squares
Log-STFT Log-Short-Time Fourier Transform LPF Lowpass Filter
LTST Long-Term ST (collection) MIDR Misidentification Rate
MIT-BIH Massachusetts Institute of Technnology - Beth Israel Hospital (collections) MLP Multilayer Perceptron
NB Naïve Bayes
NB-UBM Naïve Bayes/Universal Background Model NCC Normalised Cross-Correlation
NCCC Normalised Cross-Correlation Clustering NF Notch Filter
NLMS Normalised Least Mean Squares
NN Neural Network
NSR Normal Sinus Rhythm (MIT-BIH database) PAR Pulse Active Ratio
PCA Principal Component Analysis PCG Phonocardiogram
PE Peak Extraction
ABBREVIATIONS xxi
PLI Powerline Interference PNN Probabilistic Neural Network PPG Photoplethysmogram
PRD Percent Residual Difference PSD Power Spectral Density
PTB Physikalisch-Technische Bundesanstalt (collection) PTCD Probability of Time to Correct Decision
PVE Peak and Valley Extraction RAM Random Access Memory RBF Radial Basis Function
RBFNN Radial Basis Function Neural Network RMSE Root Mean Squared Error
RNN Recurrent Neural Network ROC Receiver Operating Characteristic
RR Reject Rate
SA Sinoatrial (node)
SBFS Sequential Backwards Floating Selection SBS Sequential Backwards Selection
SFA Simplified Fuzzy ARTMAP
SFFS Sequential Forward Floating Selection SFS Sequential Forward Selection
SG Savitzky-Golay
SIMCA Soft Independent Modelling of Class Analogy SLP Polysomnographic (MIT-BIH database) SNR Signal-to-Noise Ratio
SpO2 Arterial Oxygen Saturation
STC ST Change (MIT-BIH database) STFT Short-Time Fourier Transform ST-T European ST-T (database) SVM Support Vector Machine TCD Time to Correct Decision TPIR True Positive Identification Rate UBM Universal Background Model UofTDB University of Toronto ECG Database USC Usability-Security Characteristic VE Valley Extraction
WDIST Wavelet Distance WFDB Waveform Database
Chapter 1
Introduction
1.1
Biometric Recognition
Websites, smartphones, safes, cars, houses, buildings, banks, and airports are just a few of our society’s amenities that rely on identification or authentication systems to protect and guard our-selves, our information, or our belongings. Most of them still depend on traditional systems based on extrinsic entities or knowledge like cards, keys, or passwords (Agrafioti et al., 2011; Jain et al., 2011).
In the last decades, researchers have focused on avoiding the problems of traditional systems: they can be lost, stolen, discovered, or copied (Abo-Zahhad et al., 2014). Biometrics present the perfect opportunity to achieve that goal, as they are focused on intrinsic characteristics of the person, requiring their physical presence, and minimising the probability of success of possible impostors (Jain et al., 2011; Kaur et al., 2014).
Many human traits have been proposed and studied for the purpose of identity recognition, especially face, fingerprints, voice, and iris (Kaur et al., 2014; Akhter et al., 2016). With the increasing number of applications that rely on these, the methods to circumvent them become stronger, resorting to photographic, 3D model reproductions, or sound recordings of the traits (Belgacem et al., 2012; Fratini et al., 2015), and obliging biometric systems to include deeper security measures, such as liveness detection.
More recently, a new set of biometric traits, called medical biometrics, has gained momentum (Agrafioti et al., 2012; Abo-Zahhad et al., 2014; Akhter et al., 2016). The Electrocardiogram (ECG) has proven to be the most promising of them, excelling in most of the characteristics that define the quality of a biometric trait. Its nature makes it hard to capture and inject into the system for spoofing purposes, and the inherent liveness detection ensures the biometric system is not being attacked (Li and Narayanan, 2010).
Recent studies have proven the capabilities of ECG as a biometric, and its unidimensional nature places it as a more computationally efficient alternative to image or video-based systems, especially for continuous recognition systems, highly dependant on timely decisions.
1.2
Automotive Biometrics: Challenges and Opportunities
The automotive world has, in the last decades, promoted a burst of technology integration in cars, aiming for more comfort, ease of use, functionality, safety, and security. This has been especially fueled by the fact people generally use their cars for a great amount of time each day, and cars are one of the most widespread possessions in our society (Coppola and Morisio, 2016; Huang et al., 2016).
Cars today include an array of electronic control units (ECUs) that automatically control trac-tion, braking, stability, lane changing, lighting, collision avoidance, and many others (Coppola and Morisio, 2016; Huang et al., 2016). Besides these, other technologies for driver drowsiness, anger, and stress detection, have also been studied to avoid car crashes (Coppola and Morisio, 2016).
Biometric recognition, although less explored and studied than other technologies, also offers great advantages for the automotive world. Currently, car locks, start/stop systems, and on-loan monitoring and speed limitations are controlled by wireless key fobs, that can be lost or stolen. Biometric recognition could completely eliminate the need for such devices, and allow for auto-matic personalisation of car and driving settings according to the driver’s identity (Lourenço et al., 2015).
ECG-based recognition could, furthermore, be a reliable way to ease remote fleet supervision and management, and associated tasks such as driver swaps and break enforcement to avoid fatigue and stress-related accidents. Continuous biometrics on the steering wheel could also, in these settings, allow managers to more reliably assess responsibility and apportion blame in case of accident or reckless driving.
The electrocardiogram is, potentially, the best trait for driving settings. It is universal, always present, easy to acquire and process, hard to counterfeit, and includes enough personal information to allow for accurate recognition (Agrafioti et al., 2011; Kaur et al., 2014). Continuous contact need is a significant setback, but its inconveniences can be effectively minimised using the recent off-the-person acquisition techniques, with dry electrodes on the steering wheel (Lourenço et al., 2015), and software solutions able to deal with contact losses and low signal quality.
1.3
Research Goals and Contributions
Medical-grade electrocardiographic signals, as those used on the first ECG biometrics studies, or even the more recent off-the-person signals, acquired during exercise on the fingers or palms, are relatively easy to preprocess. On the other hand, the ECG signals acquired on the steering wheel while driving are much more contaminated by noise artifacts, with less contained and predictable frequency ranges.
Following the advantages of ECG-based biometric recognition on the steering wheel, this dis-sertation aimed to provide an extensive study of the behaviour of prior art and proposed approaches in these new and more challenging settings. The main goal was, thus, to find a framework that
1.4 Dissertation Outline 3
could recognise individuals, accurately and quickly, from the noisy signals acquired while driving, after evaluating and optimising, individually, each phase involved in the process.
This dissertation contributions begin with a complete review of the fundamentals of the elec-trocardiographic signal and biometric recognition, as well as a thorough survey of prior art ap-proaches that used the former as a biometric trait for the latter. This provided a strong theoretical foundation and state-of-the-art knowledge to prepare and guide the work performed throughout the dissertation.
On signal preprocessing, several prior art and proposed denoising methods were evaluated on their ability to denoise both standard off-the-person and driving ECG signals. Afterwards, on the step of signal preparation, the Pan-Tompkins, Engelse-Zeelenberg, and Trahanias R-peak detec-tion algorithms were explored and had their performance assessed in similar condidetec-tions. Besides this, a novel outlier detection algorithm, based on normalised cross-correlation, was devised and compared with DMEAN, one of the best prior art approaches.
Diverse prior art feature sets were extracted from ensemble heartbeats. Also, a more complete formulation of 1D Local Binary Patterns was conceived. These were compared in their ability to provide the conditions to attain high and consistent identification rates with simple classifiers, while LDA and PCA were explored for dimensionality reduction. The most promising sets were used with several decision methods, including the proposed Naïve Bayes and its UBM adapta-tion, and their continuous and conventional authentication and identification performances were measured and compared.
1.4
Dissertation Outline
Besides this introduction, this dissertation presents the anatomy and physiology fundamentals on the ECG signal, its variability and noise sources, and the acquisition settings, in Chapter 2. The basics on biometric recognition, its modalities and their qualities, its structure and performance evaluation metrics, as well as general system design considerations, are presented in Chapter 3.
Chapter 4 reviews some of the most commonly used ECG databases, and the CardioID col-lection used for this dissertation. A complete review of sixty-five prior art approaches and their acquisition, preprocessing, preparation, feature extraction, and recognition methods is presented in Chapter 5.
The experimental settings for this dissertation are defined in Chapter 6, and Chapter 7 presents several preprocessing methods and their evaluation with common off-the-person and driving ECG signals. Chapter 8 focuses on the detection of reference points, heartbeat segmentation and ampli-tude normalisation, outlier detection and removal, and ensemble heartbeat construction.
Chapter 9 describes various feature extraction and dimensionality reduction methods, and their evaluation with ECG signals, and Chapter 10 presents the recognition methods explored in this dissertation, and their performance in authentication and identification tasks. Finally, Chapter 11 draws some conclusions on the work performed and the results obtained, and discusses some paths to be explored in the future.
Chapter 2
Electrocardiographic
Signal Characterisation
2.1
Anatomy and Physiology
In every sense of the word, the heart is a pump. Tate (2009) defines three main functions of the heart: generating blood pressure, through the contraction of the myocardium, in order to keep blood moving; routing blood, by sending venous blood to the lungs, in the pulmonary circulation, and arterial blood to the whole body, in the systemic circulation; and regulating blood supply, by adapting its rate and force of contraction to the current metabolic demands of the body.
The heart is able to perform these functions due to its anatomy (cf. Fig. 2.1). The heart is enveloped by the pericardium, and its wall is composed by three layers: the epicardium (the outer layer), the myocardium (the middle layer), and the endocardium (the inner layer). While the endocardium and epicardium are thin endothelium and serous layers, respectively, most of the wall is occupied by the myocardium, composed by muscle cells disposed in spiral bundles across the heart wall to allow for potent contractions (Scanlon and Sanders, 2007; Tate, 2009; Marieb and Hoehn, 2013).
Inside, the heart is divided in four chambers: the left and right atria and ventricles. The left atrium receives arterial blood from the pulmonary veins, while the right atrium receives venous blood from the caval veins (superior and inferior). The blood received will pass, upon atrial con-traction, to the respective ventricle. Upon ventricle concon-traction, the blood on the left ventricle will be sent through the aorta, and the blood on the right ventricle will be sent through the pulmonary arteries (Scanlon and Sanders, 2007; Marieb and Hoehn, 2013).
The contraction of the heart is, thus, of the highest importance. The myocardial muscle cells contract in response to electrical currents, that cause the depolarisation of those tissues by trigger-ing action potentials. To control the contraction, and thus channel the blood flow in the correct direction, the heart controls the depolarisation according to a defined sequence of events (cf. Fig. 2.3) (Scanlon and Sanders, 2007; Tate, 2009):
RIGHT ATRIUM LEFT ATRIUM ENDOCARDIUM EPICARDIUM MYOCARDIUM PURKINJE FIBERS BUNDLE BRANCHES ATRIOVENTRICULAR BUNDLE
INFERIOR VENA CAVA
SUPERIOR VENA CAVA AORTA
ATRIOVENTRICULAR (AV) NODE SINOATRIAL (SA) NODE AORTIC SEMILUNAR VALVE MITRAL VALVE APEX PULMONARY VEINS TRICUSPID VALVE INTERVENTRICULAR SEPTUM PAPILLARY MUSCLES
Figure 2.1: The anatomy of the heart (based on Tate (2009) and Marieb and Hoehn (2013)).
1. Atrial depolarisation - The depolarisation begins in the sinoatrial (SA) node, the heart’s pacemaker that generates the impulse, and quickly spreads to both atria, also reaching the atrioventricular (AV) node;
2. Atrial depolarisation complete - The depolarisation reaches the whole atria and the atrial contraction begins. Thanks to the fibrous skeleton of the heart, a fibrous connective tissue that surrounds the four valves and insulates the ventricles from the atria, the depolarisation is unable to spread to the ventricles. The conduction to the ventricles can only be done via the AV node and the bundle branches. However, to avoid simultaneous ventricular and atrial contractions, the AV node delays the impulses for about 0.1 s before sending it down the bundle branches;
3. Ventricular depolarisation - The impulse delay at the AV node ends and it is sent down the bundle branches. When it reaches the apex, it starts to spread to the myocardium cells via the Purkinje fibers and begins the ventricular depolarisation. At the same time, after their contraction, the atria begin to repolarise;
4. Ventricular depolarisation complete - The ventricles myocardial cells contract almost im-mediately after being depolarised;
5. Ventricular repolarisation - After contraction, the ventricles begin to repolarise;
6. Ventricular repolarisation complete - The repolarisation of the ventricles completes, and the heart is ready to repeat the process.
These flows of depolarisation and repolarisation are nothing more than electrical currents be-ing generated and conducted through the heart. These electrical currents can be detected and
2.2 Variability 7
P
Q
S
T
R
PQ/PR (0.2 s) QT (0.4 s) QRS ComplexFigure 2.2: A single heartbeat in an electrocardiogram (based on Tate (2009)). The main waves P, Q, R, S, T, the QRS complex, and the important PQ/PR and QT intervals are presented. It is important to note that the presented durations of the intervals are only an example that can widely vary according to the subject and his/her condition.
measured, through electrodes placed in the body, in a process called electrocardiography. The resulting signal is called an electrocardiogram (ECG) and, in normal conditions, is a cyclic repe-tition of five easily recognisable waves or deflections: the P, Q, R, S, and T waves (cf. Fig. 2.2). The ECG signal is cyclic because each group of these deflections refers to a single heartbeat and, as shown in Fig. 2.3, each of these parts can be traced back to the phase that originated it (Scanlon and Sanders, 2007; Tate, 2009; Marieb and Hoehn, 2013).
2.2
Variability
As shown in the previous section, the electrocardiographic signal results of the detection and measurement of electrical current that is generated and conduced throughout the heart, to ensure its strong and timely contractions.
The ECG signal, although presenting, in normal conditions, the same deflections for all sub-jects at all times, is doted by a high degree of variability. Variability in the ECG can be designated as intrasubject, the variations between cycles (heartbeats) in the electrocardiogram of a single sub-ject, or intersubsub-ject, the variations between heartbeats of different subjects. Both these variability types can have origin in several factors, and the most important of these are:
• Heart Geometry - Heart size, cardiac muscle thickness, and the overall shape of the heart dictate the paths the electrical current will follow inside the heart, the number of muscle cells that will depolarise, and the time it takes to do it across the whole heart. Athletes, with their high physical training, commonly have larger hearts, with thicker myocardia, which affects
1
2
3
4
5
6
DEPOLARISATION DEPOLARISED REPOLARISATION
Figure 2.3: The sequence of electrical conduction events in the heart, and its relationship with different waves of a heartbeat in an ECG signal. (based on Marieb and Hoehn (2013)). The colors of the ECG trace refer to each phase 1-6.
the ECG with higher voltages in the QRS complex, and lower basal heart rates (Hoekema et al., 1999; van Oosterom et al., 2000; Hoekema et al., 2001);
• Individual Attributes - Age, weight, and pregnancy are some of the individual attributes that can cause shifts in the heart position and/or orientation. These shifts will change the orientation of the electrical current conduction vectors along the heart. This means that the electrodes will detect the signal in a different perspective and, thus, the ECG deflections will suffer variations both in voltage and in time (Schijvenaars, 2000);
• Physical Exercise or Meditation - The duration of, and intervals between the different de-flections of the heartbeats in an ECG signal, vary with the heart rate. These changes are especially visible on the interval between the QRS complex and the T wave in situations of tachycardia (higher heart rates) or bradycardia (lower heart rates). Changes in the heart rate caused by physical exercise or meditation do, effectively, affect the electrocardiogram (Agrafioti et al., 2012);
• Cardiac Conditions - Medical conditions of the heart can also interfere in the dynamics of the electrical pulse conduction and generate variability. In the scope of biometrics, one
2.3 Acquisition 9
of the most studied conditions is Arrhythmia, that causes wide variations in the heart rate across time and, as reported by several researchers, can consistently shrink the performance of ECG-based biometric systems (Ye et al., 2010; Agrafioti et al., 2011; Safie et al., 2011). • Posture - Postures like standing or laying down differ widely on the position and shape of
internal organs. The heart also suffers with this, changing its position in the thorax, and thus its position in reference with the electrode placement, which will cause variations in the collected ECG signal (Schijvenaars, 2000);
• Emotions - The sympathetic and parasympathetic systems, of the autonomous nervous sys-tem, work to, respectively, increase or reduce the heart rate. These systems are under direct influence of psychological states and thus, under stress, fear, or other strong emotions, the heart rate and the ECG signal can be affected (Agrafioti et al., 2012);
• Electrode characteristics and placement - The type and size of the electrodes, and whether they use gel or not, is a main origin of noise and, thus, variability. The mispositioning of electrodes, variant placements, reversal of leads, are also sources of variability, as they change the perspective of detection of the electrocardiographic signal (Hoekema et al., 1999; Schijvenaars, 2000).
All the previously presented factors reflect on the morphology of the electrocardiographic signals acquired from an individual. Thus, when considering the acquisition of ECG, both for medical and biometric recognition purposes, it is of the utmost importance to consider all of these and the way they can ease or difficult the task at hand. In the next section, the ways to measure electrocardiographic signals of an individual are presented.
2.3
Acquisition
Medical diagnostic and biometric recognition are very different tasks with very different purposes and requirements that, thus, differ on the most commonly used techniques to measure the ECG sig-nals. Besides that, common biometric systems also differ from the more specific settings that are studied in this dissertation - the driving environment. Hence, in this section, the electrocardiogram acquisition methods are presented in three groups: the standard medical acquisition settings, the common biometric acquisition settings, and the specific acquisition settings for driver monitoring.
2.3.1 Standard Medical Acquisition Settings
For medical purposes, there are a few defined and established configurations of electrodes for the measurement of electrocardiogram signals in standard, comparable formats that ease the diagnos-tic of cardiac conditions. Here, two of the most common are presented: the standard 12-lead configuration, and the corrected orthogonal ECG configuration.
2.3.1.1 Standard 12-Lead Configuration
The Standard 12-Lead Configuration, as the name suggests, allows the acquisition of an ECG signal in 12 leads (or channels). Each lead corresponds to a different electrical perspective of the heart, and can deliver important information for diagnostic. The 12 leads can be grouped in three categories: three bipolar limb leads, three monopolar limb leads, and six monopolar precordial leads (Biel et al., 2001).
The bipolar limb leads originated in the work of Willem Einthoven, the creator of the first electrocardiograph. These leads (cf. Fig. 2.4) compose the sides of a equilateral triangle, whose vertices are the left (LA) and right arm (RA) wrists and the left leg (LL) ankle (the position of the three electrodes), that serve to capture a projection of the cardiac dipole in each of these directions. The right leg serves as ground (N). The signals are obtained by measuring the electric potentials between RA and LA (Lead I), RA and LL (Lead II), and between LA and LL (Lead III) (Biel et al., 2001; MacLeod and Birchler, 2014)
The three limb electrodes also serve to capture the monopolar limb leads, that consist on the measurement of the cardiac dipole in the direction of each limb electrode. In the direction of LA we obtain the aVL lead, for RA we obtain aVR, and with LL we obtain aVF. Artificial references for all these are obtained with a combination of signals at various electrodes (Biel et al., 2001). Finally, the six monopolar precordial leads (V1 to V6) are placed on the chest, as shown on Fig. 2.4, and allow the collection of signals in directions on the axial plane, while the limb leads are for the frontal plane.
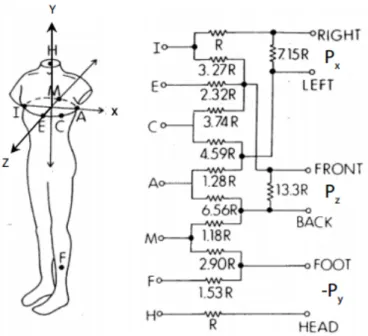
2.3.1.2 Corrected Orthogonal Configuration (Frank Leads)
Instead of aiming for the collection of signals on several directions in the axial and frontal anatom-ical planes (as the standard 12-lead configuration does), the commonly designated Frank Leads aim to acquire the electrocardiogram in just three channels, each corresponding to an orthogonal direction x, y, or z, thus capturing the heart dipole in three dimensions (MacLeod and Birchler, 2014).
The corrected orthogonal configuration involves the use of seven electrodes: I, E, C, A, M, F, and H (cf. Fig. 2.5). The first five electrodes are are on the same plane, the axial, with I and A below the right and left axillae, respectively. E and M on the intersection of the axial and sagittal planes, E is placed anterior to the subject and M is placed posterior. C is halfway between E and A, and makes a 45 degree angle with each, with center on the referential origin. F is placed on the left ankle, and H is placed on the back of the neck. Processing the signals obtained from all these electrodes, as shown in Fig. 2.5, allows the collection of the three orthogonal leads, Px, Py, and Pz
2.3 Acquisition 11
Figure 2.4: Leads and electrode placement of the standard 12-lead configuration (adapted from Moran and Fecowycz. Left: limb electrode placement; centre: precordial electrode placement; right: monopolar and bipolar limb leads).
Figure 2.5: Leads and electrode placement of the corrected orthogonal configuration (from MacLeod and Birchler (2014). Left: electrode placement; right: lead measurement computation).
2.3.2 Common Biometric Acquisition Settings
2.3.2.1 Adaptation of Medical Configurations
In ECG-based biometrics, researchers have commonly used recordings from standard 12-lead ECG configuration or Frank leads as basis for the development and evaluation of their biomet-ric systems (Plataniotis et al., 2006; Wübbeler et al., 2007; Ghofrani and Bostani, 2010). Even more common has been the selective use of certain leads of these configurations, especially the Lead I (Palaniappan and Krishnan, 2004; Zhang and Wei, 2006; Molina et al., 2007), because of its higher acceptability due to the electrode placement on the wrists, but also Lead II (Kyoso and Uchiyama, 2001a,b; N and Jayaraman, 2010; Pathoumvanh et al., 2014), and chest leads (Kyoso et al., 2000; Fang and Chan, 2009; Ye et al., 2010).
2.3.2.2 Off-the-Person Acquisition
More recently, biometrics researchers have been focusing on the so-called off-the-person ap-proaches. Unlike on-the-person approaches, that are characterised by somewhat invasive acqui-sition techniques, with gelled electrodes placed on the limbs and chest, off-the-person acquiacqui-sition focuses on minimally intrusive acquisition, closer to simple real biometric applications (Silva et al., 2013; Carreiras et al., 2016).
Off-the-person approaches have clear advantages on what concerns the acceptability, simplic-ity, and unobtrusiveness of the acquisition. However, the farther placement of the electrodes and the fact they are commonly ungelled makes the acquisition more vulnerable to contamination, de-creasing the signal-to-noise ratio (SNR), and thus deteriorating the quality of the signal (Belgacem et al., 2012; Silva et al., 2014).
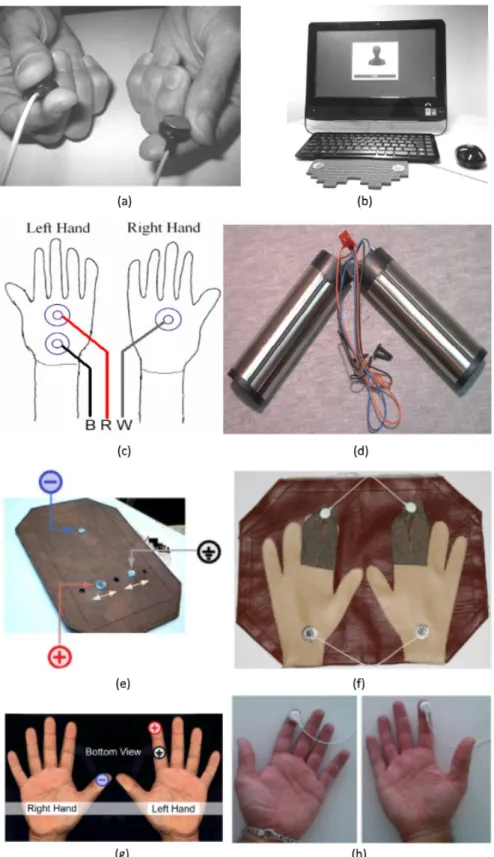
To the best of our knowledge, the first research work to focus on off-the-person acquisition was conducted by Chan et al. (2008), that collected the ECG signals using button Ag-AgCl electrodes held by the subjects (cf. Fig. 2.6). Coutinho et al. (2010, 2011) followed, acquiring signals at the palms during computer tasks (Silva et al. (2013) used a similar configuration).
Later on, Shen et al. (2011) recorded signals from both palms using two small metallic rods that were grabbed by the subjects during acquisition (Belgacem et al. (2012, 2013) and Lin et al. (2014) used similar electrodes). Lourenço et al. (2011b) mounted the three electrodes on a plaque, positioned to contact with the index finger of the left hand and the thumb of the right hand.
Silva et al. (2014) used four electrodes mounted on a cloth on a table, with one Ag-AgCl electrode in contact with each palm, and one electrolycra strip (conductive polymeric fabric) in the index and middle fingers of each hand. Lourenço et al. (2014) and Matos et al. (2014) used only two Ag-AgCl electrodes (with virtual ground) to acquire ECG at the index fingers.
2.3.3 Specific Driver Monitoring Settings
For the specific field of driver monitoring, be it for stress, attentiveness, fatigue detection, or biometric recognition, there are two ways to conduct the collection of the ECG signals. The first
2.3 Acquisition 13
Figure 2.6: Electrode configurations used on off-the-person acquisition settings (a - Chan et al. (2008); b Silva et al. (2013); c and d Shen et al. (2011); e and g Lourenço et al. (2011b); f -Silva et al. (2014); h - Matos et al. (2014)).
Figure 2.7: Steering-wheel-based ECG acquisition configurations (left: mock-up from Gomez-Clapers and Casanella (2012); center: CardioWheel mockup; right: CardioWheel integrated in car (Lourenço et al., 2015)).
consists in following configurations similar to other settings, as did Healey and Picard (2005), using adapted electrode placements fixed on the patient’s chest and limbs.
The second way is to fix the electrodes on the wheel. It allows for a complete fit with the off-the-person goals, minimising the obtrusiveness of the acquisition procedure, and eliminates the need for intervention when the driver enters or exits the car.
In 2012, Gomez-Clapers and Casanella (2010, 2012) studied a wireless steering wheel proto-type with embedded electrodes (cf. Fig. 2.7), that could be mimicked in real cars’ steering wheels, and found that the signals acquired had enough quality and stability to allow for the monitoring of the driver. Lourenço et al. (2015), of CardioID Technologies1, developed the CardioWheel (cf. Fig. 2.7) and, in a partnership with Ceiia2, got to adapt it and install it in real automobiles, allowing for acquisition and testing in real settings.
Besides the scientific research efforts, many car manufacturers (especially the largest ones) have already begun to invest in the development and exploration of steering wheel ECG-based monitoring technologies, aiming for higher competitiveness, as stated by Choi et al. (2016). D’Angelo et al. (2010), in partnership with BMW, integrated ECG electrodes on the steering wheel, gear selector, and armrest, to monitor the heart rate of the driver. Along with ECG, Daim-ler AG’s Mercedes-Benz also installed skin conductivity, SpO2, and peripheral temperature
sen-sors on the steering wheel (Heuer et al., 2010). Ford and Denso opted to acquire ECG using seat-mounted electrodes (Wartzek et al., 2011; Sakai et al., 2013).
2.4
Noise Contamination
2.4.1 Standard Noise Sources
The acquisition of electrocardiographic signals is highly susceptible to be corrupted by noise. De-pending on the electrode characteristics and placement, the amplitude of the waveforms obtained can vary but, in ideal conditions (chest leads in medical settings), the QRS complex only reaches
1CardioID Technologies:https://www.cardio-id.com/(visited on 30/01/2017). 2Ceiia:https://www.ceiia.com/(visited on 30/01/2017).
2.4 Noise Contamination 15
2 − 3mV, the largest amplitude of the whole cyclic beat (Fatemian and Hatzinakos, 2009). This means that the farthest the location of the electrodes, the weaker the signal and the more dominant the noise.
Denoising is a key aspect in both diagnostic and biometric systems, and constitutes the focus of the signal preprocessing block. ECG noise can originate in many sources, most commonly:
• Powerline inteference (PLI) - Powerline interference is the designation given to the noise generated by the sinusoidal alternating current, used as energy source by the acquisition equipment. It reflects on the acquired signal as a high-frequency noise, with frequency equal to that of the current (60 Hz in the United States and other American countries, and 50 Hz in Europe, Asia, and most other countries) (Singh et al., 2015; Fatemian and Hatzinakos, 2009);
• Baseline wander (BW) - Baseline wander is caused by breathing movements. Thus, it re-flects on the acquired signal as a low-frequency ondulation of the signal’s baseline, normally below 1 Hz (Singh et al., 2015; Fatemian and Hatzinakos, 2009);
• Elecromyographic (EMG) interference - Just like the cardiac muscle, the other muscles in the body also use electric impulses to contract. While capturing ECG, it is easy to also cap-ture the electromyographic signals of the contraction of nearby muscles, that will reflect in the signal as high-frequency, high-amplitude, short-term bursts (Singh et al., 2015; Fatemian and Hatzinakos, 2009);
• Electrode movement - These artifacts result from skin impedance changes around the elec-trode, caused by movements of the subject, and reflect as high amplitude waveforms in the signal (Fatemian and Hatzinakos, 2009);
• Lead reversal - The reversal of leads will cause the incorrect measurement of potentials. The acquired signal heartbeats will, thus, normally present some or all of its characteristic waveforms reversed in amplitude (Singh et al., 2015);
• Pacemaker interference - The signals from artificial pacemakers, installed in individuals with heart conditions, can be captured along with the ECG signal. These interferences appear as short spikes before the S wave (Singh et al., 2015).
When we consider off-the-person approaches, using ungelled electrodes in the palms or fin-gers, it is reasonable to expect a considerable increase in the noise influence, with lower SNR. The ability to capture the ECG signal weakens, so the amplitude of the ECG components is smaller, when compared with chest leads, and movement artifacts are much more frequent and dominant (Lourenço et al., 2014; Matos et al., 2014; Silva et al., 2014).
2.4.2 Noise Sources in Driving Settings
If, as said, noise is more influential on the acquired signal when we use off-the-person approaches, when using steering wheel acquisition in driving settings this influence becomes even higher.
Driving requires frequent movement, and drivers should be expected to move on their seat and move their hands, to respond to noises and the surroundings, to steer the car, to brake and to accelerate (Healey and Picard, 2005). The electrocardiographic signals acquired are, thus, much more prone to be contaminated with both electromyographic and movement artifacts (Gomez-Clapers and Casanella, 2012). The way the drivers hold the wheel, the frequency with which they take their hands off to change gears or steer, will also deteriorate the quality of the obtained signals, as both hands are required to be placed on the wheel to acquire the signals (Gomez-Clapers and Casanella, 2012; Lourenço et al., 2015; Choi et al., 2016).
The only source of noise that is not expected in a driving environment, when compared with common acquisition settings, is the powerline interference, as the equipments will not use alter-nating current energy. Despite this, the many other sources and their enhanced contaminations of the signals must be addressed properly with effective preprocessing techniques.
2.5
Biometrics Application: Challenges and Opportunities
The electrocardiogram is a cyclic signal that varies according to many factors, including heart ge-ometry and individual attributes, that confer to it information about the person. The way cardiac conditions model the ECG has been extensively studied and used for diagnostic, including auto-matic tools. However, as shown, the acquisition techniques widely used for medical diagnostic can also be adapted or reformulated to allow for the compliance with real usable biometric systems, using the trending off-the-person acquisition approaches.
The off-the-person approaches, despite the great challenges it has to overcome, pave the way for a great new opportunity. For a highly dynamic environment such as driving, where movement is almost always present, but driver monitoring would still render very beneficial information, off-the-person ECG acquisition (such as on the steering wheel) poses itself as the way to easily, unobtrusively, and effectively monitor the driver. This monitoring would be advantageous not only for stress, fatigue, or attentiveness measurement, but also for identity recognition.
In the next chapter, the fundamental concepts on biometric recognition are presented. It cludes a description and comparison of the most commonly explored biometric modalities, in-cluding the electrocardiogram and the characteristics that make it stand out on the task of identity recognition.
Chapter 3
Biometric Recognition:
Fundamental Concepts
3.1
Biometric Systems: The Basics
Identification and authentication systems are, nowadays, nearly ubiquitous. Such systems are used almost everywhere, in an effort to more effectively and completely protect people, their identities, their information, and their possessions. Many of these systems use the so-called entity-based/token-based or knowledge-based methods, that are based, respectively, in something the user has (such as keys or identification cards) or something the user knows (such as passwords or PIN codes) (Agrafioti et al., 2011; Jain et al., 2011; Abo-Zahhad et al., 2014).
However, these traditional systems have fundamental flaws that put in risk everything they were built to protect. A password or PIN code can easily be lost, stolen, shared, forgotten, or discovered by a third-party (Abo-Zahhad et al., 2014). Keys or cards are also easily forgotten, and can be copied or counterfeit.
All these breaches originate in the fact that these methods evaluate the identity of a person based on extrinsic entities, and so anyone can, in possession of such entities, assume the identity of another person. This is not true for biometric traits, that require the physical presence of the person, in order to proceed with the identification (Jain et al., 2011; Kaur et al., 2014).
Biometric traits can be defined as human characteristics, whether anatomical, physiological, or behavioural, that include enough personal information to reliably serve as means of recognition of a certain individual (Agrafioti et al., 2011; Kaur et al., 2014). Physiological biometric traits are those that originate from direct measurements of a part of the human body, while behavioural biometric traits originate from the measurement of a person’s actions (Abo-Zahhad et al., 2014).
Biometric recognition systems are, thus, systems that use statistical methods based on these biometric traits in order to identify or validate the identity of a human being, effectively using its intrinsical features as input (Sufi et al., 2010; Kaur et al., 2014; Fratini et al., 2015).
Biometric systems, just like traditional identification systems, are most needed for access con-trol in critical, sensitive, and private settings, including civil contexts like research laboratories,
medical restricted areas, airport security, or entrepreneurial environments; military or police con-texts such as the protection of crime evidences, witnesses information, and control of prison en-trances and exits (Dar et al., 2015b); or even personal security settings like the control of access to a house, a car, or even a personal laptop or smartphone.
Biometric traits present the great advantages of providing high levels of security in all of these applications (Belgacem et al., 2012), being difficult to counterfeit or steal when compared with traditional credentials, and providing more ease of use and accessibility, as they do not require the use or transport of anything other than our bodies (Agrafioti et al., 2011).
3.2
Biometric Modalities
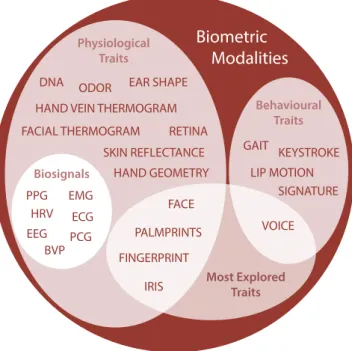
Various biometric modalities have been proposed over the last decades, following research findings proving certain human characteristics include, in fact, enough unique personal information (cf. Fig. 3.1).
Bolle et al. (2004), Sufi et al. (2010), Abo-Zahhad et al. (2014), and Kaur et al. (2014) listed several physiological biometric modalities already explored, like DNA, ear shape, face, facial thermogram, fingerprints, skin reflectance, hand geometry, hand vein thermogram, iris, odor, palm print, and retina, as well as behavioural traits like gait, keystroke, signature, voice, and lip motion. Some of these are still under-developed for biometric purposes (mostly behavioural traits like gait or keystroke), and do not present enough recognition accuracy yet (Belgacem et al., 2012). On the other hand, face, fingerprints, iris, and voice have been the most studied and are currently the most used traits (cf. Fig. 3.2) (Kaur et al., 2014; Akhter et al., 2016). However, these have recently seen a growth of successful spoofing methods (methods of counterfeiting a certain person’s feature to gain access through biometric systems).
Faces can usually be replicated by printing, in 2D or 3D, a replica of the person’s face, shot by any medium to high-quality camera. Fingerprints can be easily copied using latex, silicone, or playdough. Voice can be recorded for posterior use, and iris and retina systems can be spoofed using contact lenses (Belgacem et al., 2012; Fratini et al., 2015).
To increase resistance to spoofing methods, it has become more and more common for bio-metric systems to integrate liveness detection (Prabhakar et al., 2003; Irvine et al., 2008). If, when acquiring an image of the subject’s face, the system requires him to mimic a certain expression or movement, it will be easier to verify if the acquisition is from a living person or from a photo or pre-recording.
To overcome these difficulties, the so-called medical biometric traits have gained momen-tum. They are mainly biosignals such as the electrocardiogram (ECG), the electroencephalogram (EEG), electromyography (EMG), and other signals and features like phonocardiogram (PCG), photoplethysmogram (PPG), heart rate variability (HRV), blood volume pressure (BVP), or the brain response to stimuli (Agrafioti et al., 2012; Abo-Zahhad et al., 2014; Akhter et al., 2016). Due to their “hidden” nature, unlike face, fingerprints, or voice, these traits are harder to capture
3.3 Qualities of a Biometric Modality 19
or collect for spoofing purposes and, as they are linked to critical physiological mechanisms like the heart beat or the blood flow, they provide inherent liveness detection (Li and Narayanan, 2010). Despite all advantages that human traits bring to biometric systems, the main disadvantage is their fuzzy nature. While traditional ID cards and keys either grant access or not, and passwords and PIN codes either are correct or wrong, and neither presents a third option, biometric traits are so variable, due to anatomical, physiological, and environmental factors, that no instance is equal to another (Agrafioti et al., 2011), and thus there is never a certainty of identification, only a fuzzy degree of confidence.
To achieve better performance, biometric systems can be developed to work with more than one biometric trait (e.g. face and fingerprint), being thus designated multimodal biometric systems. Another common option is to include both biometric traits and traditional credentials (e.g. face and PIN code), forming the so-called hybrid systems.
3.3
Qualities of a Biometric Modality
In order to consider a certain physiological or behavioural trait as fitting to be used as foundation for a biometric system, a few conditions are desirable (or even required), in order to guarantee the performance and reliability of the feature for human identification or verification.
Jain et al. (1999) defined seven desirable qualities that, when verified for a certain feature, attest its potential as a biometric modality. These qualities are:
1. Universality: the trait should be present in all subjects using the system;
2. Uniqueness: the trait should include enough personal information in order to present differ-ences between all subjects, and thus allow their identification;
3. Permanence: despite the inter-subject variability desired (uniqueness), the trait should be sufficiently stable over time (reduced intra-subject variability) so as to allow the identifica-tion through the comparison of measurements in different instances;
4. Measurability: the trait should be easily and comfortably acquired and digitised, and its representation should allow easy processing and measurement;
5. Performance: a system based on such a trait should meet or exceed the recognition accuracy requirements, set by the context in which it will be applied;
6. Acceptability: there should be no foreseeable reservations that could make the subjects un-willing to allow the trait acquisition;
7. Circumvention: the trait should be as hard as possible to mimic or counterfeit, in any way, in order to prevent spoofing of the biometric system.
As stated before, these qualities are desirable but not compulsory. In fact, most of the biometric features used today do not fulfill all these requirements, at least completely. This originates in the
Biometric Modalities Physiological Traits Behavioural Traits GAIT LIP MOTION SIGNATURE VOICE Most Explored Traits FACE IRIS PALMPRINTS DNA EAR SHAPE
FACIAL THERMOGRAM RETINA
FINGERPRINT HAND GEOMETRY HAND VEIN THERMOGRAM
ODOR ECG PCG EMG EEG HRV PPG BVP Biosignals KEYSTROKE SKIN REFLECTANCE
Figure 3.1: The world of biometrics: currently used traits for biometric recognition (based on information from Bolle et al. (2004); Sufi et al. (2010); Agrafioti et al. (2012); Kaur et al. (2014); Abo-Zahhad et al. (2014); and Akhter et al. (2016)).
Figure 3.2: Share of the 2015 biometrics market by modality (adapted from Mani and Nadeski (2015)).
3.4 Common Structure of a Biometric System 21
fact that each trait has a different nature, and so presents unique characteristics, that makes each trait more adapted for some application settings, and less for others (Agrafioti et al., 2011).
Faced with the seven qualities proposed by Jain et al. (1999), and considering this diversity between features, Abo-Zahhad et al. (2014) compiled two tables comparing 16 physiological and behavioural traits, according to the completeness with which they verify each quality (L - low, M - medium, and H - high).
In those tables, it is possible to verify that, generally, the lowest overall quality traits are the behavioural ones (gait, keystroke, signature, and voice) and phonocardiogram (heart sounds), with almost all of these presenting low performance, permanence, and distinctiveness. For the behavioural traits, the circumvention and universality are also downsides.
The traits with reported highest overall quality are the DNA, facial thermogram, fingerprint, iris, palm print, and ECG. DNA has the best results in universality, distinctiveness, permanence, performance, and circumvention. However, DNA performs very badly in collectability and ac-ceptability. Facial thermogram is highly universal, distinctive, collectable, acceptable, and hard to circumvent, however, its permanence is low. Fingerprint performs very well in terms of distinc-tiveness, permanence, and performance, however it is only average in universality, collectability, acceptability, and circumvention avoidance. Iris presents very good scores in universality, perma-nence, distinctiveness, and performance, but lacks in acceptability and circumention. Palm print is average in all qualities but distinctiveness, permanence, and performance, where it excels. At last, ECG, the trait used in this work, excels in all qualities, with the exception of the average scores in collectability and acceptability.
3.4
Common Structure of a Biometric System
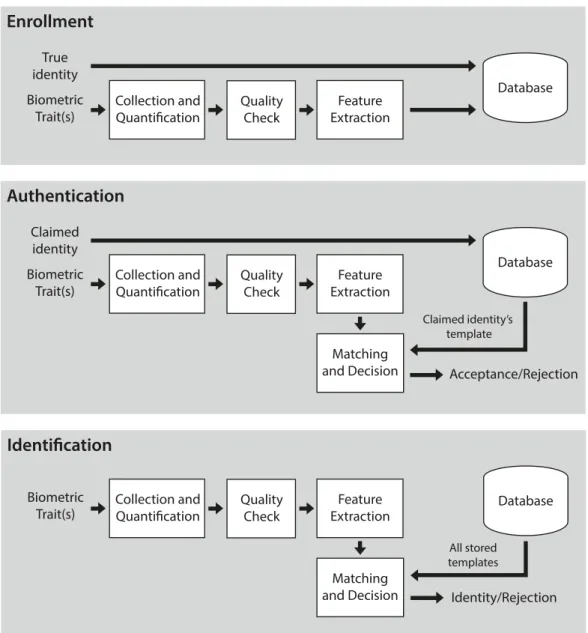
Biometric systems, independently of the trait considered, are tools that use pattern recognition al-gorithms to evaluate the similarity between biometric data acquired in the moment and biometric data previously stored (designated as templates) (Prabhakar et al., 2003; Jain et al., 2011). Ac-cording to the result of such evaluations, the system then decides on executing (or not) an action, similar to the actions performed by traditional non-biometric identification systems, usually con-sisting in granting access to information, restricted areas, among others. To achieve this goal, biometric systems are composed by an array of modules with defined purposes, and are able to operate on different modes, both of which will be described in detail below.
3.4.1 System Modules
To ensure the proper functioning of the recognition system, a biometric system is composed by four modules (cf. Fig. 3.3) (Bolle et al., 2004; Jain et al., 2011), specifically:
• Sensor - The sensor constitutes the interface between the system and the subject and, thus, has an important role in the correct capture of the biometric trait data. The sensor must be designed in order to not only fit the specific requirements of the context on which the system