M
ASTER
FINANCE
MASTER
’
S FINAL PAPER
DISSERTATION
THE DIVIDEND PAYOUT POLICY IN PROJECT
FINANCE: THE CASE OF THE PORTUGUESE PPP
ROADS BETWEEN 2003 AND 2011
TELMA FILIPA ANTUNES DOMINGOS
M
ASTER
FINANCE
MASTER
’
S FINAL PAPER
DISSERTATION
THE DIVIDEND PAYOUT POLICY IN PROJECT
FINANCE: THE CASE OF THE PORTUGUESE PPP
ROADS BETWEEN 2003 AND 2011
TELMA FILIPA ANTUNES DOMINGOS
ORIENTATION:
MESTRE JOAQUIM MIRANDA SARMENTO
THE DIVIDEND PAYOUT POLICY IN PROJECT
FINANCE: THE CASE OF THE PORTUGUESE PPP
ROADS BETWEEN 2003 AND 2011
By Telma Filipa Antunes Domingos
Abstract
This Master dissertation has as main objective to analyze the level of Dividends paid by road PPP’s in Portugal, by comparing the level of Dividends paid in percentage of the Net Profit in road PPP’s and the main Portuguese and Spanish construction companies. This study is justified by the fact that PPP’s are constituted by only one project, and consequently they do not present a significant need to reinvest. Then, it is relevant to investigate if the treatment of Net Profits is similar to the one made to common companies (in this case, large Portuguese and Spanish construction companies), in which there is need of reinvestment because the companies are involved in many projects or in a project that does not present a limited period of time. The question of this dissertation is then the following: the PPP’s in analysis distribute a higher level of Dividends in percentage of Net Profits than the construction companies in analysis? In order to provide a response to this question it was collected data, and then it was made a statistical analysis of the data. The sample is constituted by 12 PPP’s and 7 construction companies. The conclusion reached is that road PPP’s have a policy of dividends distribution stronger and more significant than construction companies.
Keywords: Public Private Partnerships, Dividend Policy, Dividend Pay-out, Portugal.
JEL Classification G35; JEL Classification H54.
Resumo
Esta dissertação tem como objectivo analisar o nível de Dividendos pagos pelas PPP’s rodoviárias em Portugal, comparando o nível de dividendos pagos em percentagem do Resultado Líquido das PPP’s rodoviárias e das principais empresas de construção Portuguesas e Espanholas. Este estudo justifica-se pelo facto de as PPP’s serem constituídas por um único projecto, e consequentemente não apresentarem necessidade significativa de reinvestir, pelo que é pertinente averiguar se o tratamento dos Resultados Líquidos é semelhante ao das empresas com características vulgares (neste caso grandes empresas de construção Portuguesas e Espanholas), em que existe necessidade de reinvestimento por não estarem associadas a um único projecto com um período de tempo limitado. Coloca-se a seguinte questão: as PPP’s em análise distribuem um maior nível de Dividendos em percentagem do Resultado Líquido do que as empresas de construção em análise? Para responder a esta questão, foi efetuada a recolha de dados, seguida da análise estatística dos mesmos. A amostra é constituída por 12 PPP’s e 7 empresas de construção. A conclusão que foi possível obter é que as PPP’s rodoviárias têm uma política de distribuição de Dividendos mais forte e significativa do que as empresas de construção.
Palavras-chave: Parcerias Público Privadas, Política de Dividendos, Pagamento de
Dividendos, Portugal.
JEL Classification G35; JEL Classification H54.
Acknowledgements
In this section, I would like to give thanks to the ones who supported me during the execution of my Master Dissertation.
Firstly, to Master Teacher Joaquim Miranda Sarmento, the person responsible for the orientation of my Dissertation. Thank you very much for your guidance, support and dedication.
Thanks for my Parents, Cesaltina and Fernando, to my Brother, Tiago, to my
Grandparents, Maria José and Fernando, for the unconditional motivation and support.
I give my thanks also to Amélia, for the help on the finalization of collecting the data and for the support and motivation to continue.
Thanks to Daniela, to remember me not to give up of what is important, in this case my Master Dissertation.
I thank all my family and friends for the support.
List of Acronyms
PPP – Public Private Partnership.VFM – Value for Money. SPV – Special Purpose Vehicle.
CMVM – Comissão do Mercado de Valores Mobiliários (Comission of the Securities
Market).
CNMV – Comisión Nacional del Mercado de Valores (National Comission on the
Securities Market).
EIB – European Investment Bank.
SCUT – Sem Custos para o Utilizador (Without costs to the user). GDP – Gross Domestic Product.
Table of Contents
Abstract ...I Resumo ...II Acknowledgements ...III List of Acronyms ... IV Index of Figures ... VI Index of Tables ... VI Chapter 1 -Introduction ...1Chapter 2- Literature Review ...3
2.1 Definition of PPP...3
2.2 PPP’s structure and characteristics ...7
2.3 A Comparison between Project Finance and Corporate Finance ...8
2.4 Dividend Payout in Finance ...9
2.5 Main Findings ...13
Chapter 3- Methodology and Data ...15
Chapter 4- The Portuguese Case ...17
Chapter 5-Statistical Results ...20
Chapter 6- Results ...26
6.1 Results ...26
6.2 Comparing Results for PPP’s and Construction Companies...31
Chapter 7 – Conclusions and Future Investigation ...32
Index of Figures
Figure 1. SCUTS Payments 2003-2031……….18 Figure 2. Dividends/ Net Profit of PPP’s – Analysis by PPP (2003-2011)………...26 Figure 3. Dividends/ Net Profit of PPP’s – Analysis by year (2003-2011)………...27 Figure 4. Total Dividends/ Total Net Profits of PPP’s (2003-2011)………..…28 Figure 5. Dividends/ Net Profits of construction companies- Analysis by company
(2003-2011)………..29
Figure 6. Dividends/ Net Profit of construction companies – Analysis by year
(2003-2011)……….30
Figure 7. Total Dividends/ Total Net Profits of construction companies
(2003-2011)……….…….31
Index of Tables
Table I. Dividends/Net Profit of PPP’s – Analysis by year (2003-2011)…………....21 Table II. Dividends/Net Profit of PPP’s – Analysis by PPP (2003-2011)………22 Table III. Dividends/Net Profit of Construction Companies – Analysis by year
(2003-2011)………..24
Table IV. Dividends/Net Profit of Construction Companies – Analysis by company
Chapter 1 -Introduction
In finance there are 3 main decisions that firms have to consider: financing, investment and dividends distribution (Damodaram, 2001). Putting the focus on dividends distribution, a pertinent and present question is to know if policy dividends is similar in Corporate Finance and in Project Finance (for example, PPP’s). Presently, Public Private Partnerships (PPP’s) as an alternative to traditional procurement of public services is more and more common. Portugal is not an exception to this trend. Like the other countries, it is motivated by the budget restrictions and need to offer public goods/ services with quality.
The objective of this dissertation is to make a comparison of dividend pay-out between two groups of companies:
1. The road PPP’s in Portugal (Project Finance);
2. Portuguese and Spanish listed companies in the sector of construction (Corporate Finance).
The time period considered in the analysis includes years between 2003 and 2011. According to the Literature Review, the hypothesis of study that was formulated is the following:
Dividend payout ratio is higher to the Road PPP’s.
On one hand, there is the payments of dividends made by firms that work in the basis of Project Finance (and consequently do not allow reinvestment, because of the scope of their project. It is the case of PPP’s.) On the other hand, “market companies”, subject to
the need of reinvestments (firms that have many ways to use the net profits generated in each year, issue that, in theory, reduces the distribution of dividends). The difference in the type of company brings the reason of this comparison and the goal to conclude what kind of these firms present a higher dividend pay-out ratio.
The choice of road PPP’s, instead of PPP’s in other sector, is based on the large percentage that road PPP’s occupy in total PPP’s in Portugal: three quarters of the budget effort on PPP’s in Portugal is to road PPP’s (Sarmento & Reis, 2013). The choice of the construction firms was motivated by the fact that the construction sector and road PPP’s have some common characteristics. Construction firms usually have capital participation in road PPP’s.
The first stage of the work consisted in collect the data: Dividends, Net Profits, Revenues, Dividends of Minority Interests, Dividends in the form of previous years Reserves, Acquisition of Own Shares, Anticipated Dividends, Net Profit to Shareholders and Net Profit to Minority Interests of all the companies in analysis, in the years between 2003 and 2011. After the data was collected, statistical analysis were made about the proportion of Dividends in Net Profit to the companies at the years referred previously, in the form of descriptive statistics and graphs.
The main conclusion reached was that Dividend Payout ratio in PPP’s is higher than in construction companies.
In Chapter 2, it will be presented the Literature Review, where the main facts about PPP’s, Project Finance versus Corporate Finance, and Dividend Payout are presented. In Chapter 3, the Methodology and Data used are presented. In Chapter 4, it is presented the
Portuguese Case of PPP’s, with some important facts about the importance of PPP’s in Portugal. In Chapter 5, Statistical Results are presented, in the form of Statistical Tables and their interpretation. In Chapter 6, it is presented the Results, in the form of figures that shows in an easy way the Results reached. Finally, in Chapter 7, the Conclusion and suggestions to future research are presented.
Chapter 2- Literature Review
2.1 Definition of PPPPPP´s were introduced in early 1990’s (OECD, 2008). It is difficult to find a universal definition of PPP, as the definition is not well established (Greve & Hodge, 2010). OECD (2008) defines PPP’s as an agreement in which the objective of an efficient delivery of the service is aligned with the profit objective of the private entity. The quality of the alignment depends on a correct risk sharing between the parties. According to Santos (2006), PPP’s are the result of two needs: the public sector has to provide better services and, on the other hand, it has several budget limitations. According to European Bank of Investment (2004), PPP’s are “relationships formed between the private sector and public bodies often with the aim of introducing private sector resources and/or expertise in order to help provide and deliver public sector assets and services” (EIB, 2004). European Commission defined PPP’s as “the transference of investment projects that have been traditionally executed or funded by the public sector to the private sector” (European Commission, 2003).
PPP’s are different from privatization, outsourcing or public traditional procurement. Privatization exists when a public company is bought by a private entity; outsourcing consists in to hire a private company to provide some specific service that constitutes an activity; public traditional procurement is defined by the total responsibility of the Government in the project. The decision on which a service should be provided by the mean of a PPP is based on three questions: if it is, or not, a service that government should provide to the citizens, if the PPP is the model that delivers the best Value for Money (VFM) and if the model satisfies the public interest (Grimsey & Lewis, 2004).
Santos (2006) considers that a PPP project has 3 main characteristics: 1) there is a contract between a public entity and a private entity; 2) the risk should be allocated to the more capable entity to manage it and 3) the private entity, in addition to fund the project, participates in the management. In a PPP, the private entity is usually responsible for the management, financing, design, construction and operation (Akintoye, 2009). Ham & Koppenjan (2001) consider that PPP’s are contracts where risks, costs and resources are shared between the two parts. A significant part of the risk of PPP’s is related with the complexity of the arrangement in terms of documentation, financing, taxation, sub agreements and technical details. According to Browne (2003), the factors that permits growth in PPP’s are efficiency (reducing duplication achieves a better use of resources), integration and accountability. This fact has been defended for a long time by many authors. PPP’s permits to the services provided by Government to achieve larger markets (Browne, 2003).
According to PricewaterhouseCoopers (2004), the sectors where PPP’s are more frequent in Europe are road sector, rail sector and water sector. According to Santos (2006), there are still other types of PPP’s: wealth, security, energy, port sector, technology and prisons.
Public Private Partnerships are expressed in the Portuguese Law. PPP definition can be read on article 2º of the Decree Law number 86/2003 (date of 26th April), and at the Decree-Law number 141/2006 (27th July). According to article 2nd of Decree Law 86/2003, PPP is a contract or a union of contracts, in which private entities are obliged to a public partner, in a lasting period of time, to ensure the development of a project that will satisfy a collective need. The private partner is responsible for the financing, investment and exploitation (it can do that by itself or along with the public partner). The risks are shared. Decree Law 86/2003 establishes the rules on the intervention on the Public estate on PPP’s.
According to Akintoye (2003), the main types of PPP are:
- Joint Venture: Public partner and private partner share all types of responsibilities and the public entity is the regulator.
- Exploration concession of a public service: A private entity is hired to guarantee the providing of a public service.
- Exploration concession of a public infrastructure: In this type of PPP, the private partner is responsible for the exploitation and maintenance of the infrastructure; In this case, private entity can define a price to finance this investment.
- Privatization: Public entity sells a infrastructure to a private entity, without a defined temporal limit on the responsibility of the private entity to explore it. - “BOT” concessions: An infrastructure is created to satisfy a public need; a private
entity constructs and explores it and it is its proprietary. However, in the end of the period of concession, the infrastructure becomes public.
Boardman & Vining (1989) analyzed 54 studies about the performance of public sector and private entities, and concluded that most of them referred that the performance is
better on private entities. Bennett & Johnson (1979) and Borcherding et al (1982) concluded also that private performance is better than the public performance.
PPP’s present advantages and disadvantages, the reason why they are applied and, on the other hand, criticized. One of the advantages of PPP’s is the economies of scale, which arises from the contract between the public sector and the private entity (Santos, 2006). This author refers also the celerity of the constructions of infra structures and implementation of projects, better quality of the service provided, better allocation of risk, additional revenues that can be the result of the surplus of supply. Some of the disadvantages cited by Santos (2006) are the possibility of an inadequate allocation of risks, the misuse of PPP’s and the need to monitor the PPP frequently because of its complexity. Another disadvantage of PPP’s is that the cost of funding in private projects is more expensive than the cost of funding that the Government supports on traditional procurement (Grimsey & Lewis, 2004).
Now it is presented some findings about PPP’s that involve infrastructures. In a way concerning road PPP’s, Savas (2000) considers that PPP’s are an alternative way to build infrastructures. Grimsey & Lewis (2004) concluded that the construction of infrastructures requires the discipline of the private sector, in what concerns deadlines and budget. PPP’s that involve infrastructures involve a long term project (25 to 35 years). During this time the services associated with the infrastructure must be provided (Grimsey & Lewis, 2004). The World Bank in 1994 confirmed that the role of infrastructures in the growth is crucial.
In terms of compliance, we have that PPP projects are supervised by public entities (“Direção Geral do Tesouro e Finanças” website). Article 2nd of Decree Law 86/2003 expresses that to ensure the compliance with the contract, there exist instruments of
jurisdictional regulation.Despite of the supervision and advantages presented by PPP’s, they raise some controversy, for example on how to ensure accountability, cost effectiveness, transparency and efficiency (Akintoye, 2009). PPP’s allow for the absence of competitors, which can lead to unreasonable profits to the private sector with reduced benefits to the public sector (Akintoye, 2009).
According to Akintoye (2009), the length of the period of the PPP contract is crucial to a sustainable project. If the concession period is too long, the return can get unreasonable. Browne (2003) concluded that PPP’s take long time to establish and to present results. At the end of the PPP period, the private party transfers the facility to the public sector (Grimsey & Lewis, 2004).
2.2 PPP’s structure and characteristics
PPP structure sometimes becomes too complex because of the many entities it involves, as public entity, private entity, funders, customers, suppliers etc. In order to decrease this problem, it can be created an independent commercial entity, designated Special Purpose Vehicle, SPV (Freitas, 2008). SPV’s are created specifically to one project, which implies a finite lifetime. All the contracts are negotiated between the SPV and the entities involved (UNESCAP, 2007). For example, SPV is responsible by the communication between the clients and the intervenient. In general, it is responsible by the project. The project sponsor creates a SPV to be responsible for the project and construct him (Slivker, 2011). According to OECD (2008), SPV’s are usually composed by financial institutions and private entities.
One of the characteristics of SPV is its low capitalization (low number of shareholders), which implies that there is a need of direct revenues to cover the costs (operating costs,
capital costs and debt provided), Grimsey & Lewis (2000). SPV’s are financed essentially by debt and are dependent on the financial flows of their only project (Akintoye, 2009). This leads to the fact that the level of debt in SPV’s is elevated. SPV’s are used in PPP projects to maintain the assets and liabilities of the project out of sponsors’ balance sheets (none of the sponsors owns more than 50% of the SPV shares) and avoid to the PPP project to be associated with possible bankruptcy of one of the sponsors (Grimsey & Lewis, 2004). According to Grimsey & Lewis (2004), PPP´s have a disadvantage comparing with traditional procurement: the contracting costs.
Infrastructure investment in PPP’s is generally in the form of SPV (Grimsey & Lewis, 2004). According to the same paper, generally large PPP’s involve SPV’s.
2.3 A Comparison between Project Finance and Corporate Finance
Project finance is a form of financing high risk projects (Comer, 1996). The objective of Project Finance is to divide risk between various shareholders, in projects where the required investment and the risks are too large (Borges, 2002). With project finance, the sponsors of the project don’t have to give extra capital to the project (Slivker, 2011). The question of reinvestment does not exist at Project Finance (there is a single project, and since the initial investment is finished, there is no need to new funds) and there is a fixed dividend policy with an immediate payout (Comer, 1996). This leads to an almost total distribution of net profit in the form of dividends. At Corporate Finance, the dividends policy is strictly controlled (Comer, 1996). At Project Finance, dividend policy is not so restricted.
According to Borges (2002), Project Finance is maintained with the cash flows of a single project. According to him, the guarantee of these cash flows is the expected receipts
during the project. The guarantees to the lenders are the expected revenues of the project (Slivker, 2011). To sponsors of a project, Project finance is advantageous compared with corporate finance, since with project finance, the lender is not allowed to pursue the assets of the project in the case of default, because the guarantee does not include the assets (Slivker, 2011). Other advantage of Project Finance is the fact that the debt stays “out of the balance” of the sponsors because financing is made by the SPV and not by the sponsors. Another advantage is its high level of leverage, Azeredo (1999). PPP’s are essentially project financing (Grimsey & Lewis, 2000; Slivker, 2011). At project finance, the entity responsible by the project is a SPV (Slivker, 2011).
2.4 Dividend Payout in Finance
Dividend payout ratio is a measure of the dividend strategy of a firm. It measures the percentage that dividends represent in Net Profit. The dividend payout ratio varies considerably among companies. The reasons for which companies decide their dividend payout ratio are numerous. Agency costs are one of these arguments. Lloyd et al (1985). Rozeff (1982) concluded that dividends can reduce the agency costs. Al-Malkawi (2005) found empirical evidence for this argument of agency costs (theory that dividends can reduce the agency costs) in a study made for companies of an emergent market named Amman Stock Exchange in the time period 1989-2000.
The other arguments that influence companies’ dividend payout ratio are then presented. The effect that dividend payout policy has on firms is not linear. Many times companies take their decision on dividend payout ratio based on the effect that they expect to exist in company (in many variables) after the distribution of these dividends, Lloyd et al (1985).
One of the main theories about dividend payout ratio comes from Modigliani & Miller (1961), who concluded that, assuming perfect markets exist (no taxes), dividend payout ratio has a null effect on firm value (and on shares valuation). This theory is commonly agreed. These authors refer also that in perfect capital markets, firms take their investment decisions irrespectively of the type of financing that the firm adopts. This implies that investment decisions should not be taken based on dividends distribution. Inversely, Dhrymes & Kurz (1967) referred that, under imperfect markets, dividends and investments compete for the use of internal funds because they are considered to be cheaper than the external ones. Consequently, they conclude that investment decisions are influenced by dividends distribution.
McCabe (1979) also concluded that dividends, investment and financing (new debt) are interdependent, which means that managers decide about the level of investment and dividends according to the proportion of each other and according to the level of profits. Firms’ need for funds is also a variable that is influenced by dividend payout decision (Higgins, 1972), who has shown that there is a negative relationship between the variables. The higher the need for funds, the lower the dividends distributed. There are many authors that share this conclusion. This negative relationship is explained by Rozeff (1982) by the fact that high beta firms probably require costly external financing and consequently pays lower dividends in order to have funds to invest. Fama (1974) concluded that investment has the expected negative effect on dividend in 60% of the cases and, on the other hand, that dividends have the expected negative effect in investment in 40% of the cases. When perfect markets do not exist, the effect of dividends in equity value is not clear (Higgins, 1972).
McCabe (1979) presented the conclusion that new long-term debt has a negative influence on the amount of dividends paid by firms. Dividends policy can also have effect on taxes. The conclusions about these effects are nonlinear. On one hand, Black & Scholes (1974) refer not to exist effect on taxes, while Litzenberger & Ramaswamy (1979) concluded that there is a positive effect between the two variables. Rozeff (1982) concluded in his study that, if tax avoidance in dividends is less than complete, the percentage of stock held by insiders has a negative relationship with the dividend payout ratio. In the same study, this author concluded also that the dividend payout ratio is a negative function of the firms’ past and expected future growth rate of sales and a positive function of the firm’s number of common stockholders.
According to Divecha & Morse (1983), an announcement of an increase in dividends gives abnormal returns to firms. On the other hand, they defend that firms that both increase dividends and have a decrease in payout ratio tend to have higher abnormal returns than those that presents an increase in dividends and an increase in payout ratio. The idea that the announcement of an increase in dividends gives abnormal returns to firms is also shared by Aharony & Swary (1980). Litzenberger & Ramaswamy (1979) argued that if a firm reduces (increases) its dividend yield, a lower (higher) expected return would be required and consequently the price of the firm’s security increase (decrease). Higgins (1972) concluded that the value of the firm is increased when the firm adopts a dividend policy that minimizes the costs of excess liquidity and external equity financing. Watts (1973) and Gonedes (1978) have shown that dividends do not permit on a significant way to anticipate future earnings.
Transaction costs are also affected by the dividend policy of the firms. According to Bishop et al (2000), some investors prefer low dividend payout because of the transaction costs required by the reinvestment of dividends obtained.
A change in dividend payout ratio has to be preceded by strong motivations to firm’s managers. The reasons of the change should be understood by stockholders and the financial community. According to Lintner (1956), current net earnings are the best variable that helps understanding the change in the rate of dividends, also because it is a variable that is frequently presented to public. Management considers that dividends should be paid in accordance with earnings, so that when earnings decline, the payment of dividends is restricted and shareholders would understand that, Lintner (1956). Lintner (1956) concluded that dividends sometimes increase even when there is a decrease in profits and when the target ratio has not been already achieved. The contrary also happens but it is more unlikely because there is always reluctance in cutting dividends. The relationship between the dividend rate observed and the dividend rate forecasted is a more relevant variable in determining dividend decisions than the change in profits, Lintner (1956).
Lintner (1956) considers that the most important factors that determine the target payout ratio and the factor of adjustment of dividends are: the expected growth of the industry, the expected growth and earnings of the company, the average cyclical movement of investment opportunities, internal fund flows and working capital needs. Earnings are more important as a determinant factor of dividends than, for example, indenture provisions, debts to be paid at specific dates, or liquidity positions, Lintner (1956).
Lloyd et al (1985) concluded that the larger the firms are, the larger the dividend payout ratio. Dhrymes & Kurz (1967) defend that the industry influences the amount of dividends paid. Divecha & Morse (1983) have concluded that dividends distribution is a source of firms’ information. In a study developed by Lintner (1956), the target payout ratios of the companies analyzed was between 20 and 80 percent, in which 50 percent is the most common ratio.
2.5 Main Findings
In this section, it will be presented a summary of the Literature Review of this dissertation.
The phenomenon of PPP’s is more and more common. Many countries in the world have already adopted PPP’s. Portugal is one of these countries. Some authors defend that in PPP’s, the responsibilities (financing, construction, management etc.) are shared between the two parties. Inversely, other authors concluded that only the private entity is responsible for the financing and management of the project. There exist, also, PPP’s in which public entity assumes all the responsibilities.
The need to provide public services with better quality (and the conclusion that private
sector has a better performance than public sector) and budget limitations of public sector lead to the existence of PPP’s. In terms of PPP characteristics, it was concluded that PPP’s involve long term contracts and large investment. Many authors concluded that the factors that contribute to the growth in PPP’s are efficiency, integration and accountability. Some advantages of PPP’s are economies of scale, rapidity of the construction of infrastructures, better quality of the service supplied and the possibility of a better
inadequate allocation of risks, the frequent need to monitor the project because of its complexity and the high cost of funding.
Infrastructures are commonly constructed and exploited by Public Private Partnerships, since the construction of infrastructures requires discipline. After the end of the PPP period, the facility is transferred from the private entity to the public entity. With their advantages and disadvantages, PPP’s are not a consensual topic and induce some controversy, namely in what concerns transparency, accountability, efficiency and cost effectiveness.
PPP’s are complex projects. In order to reduce this complexity, it can be created a commercial independent entity, named Special Purpose Vehicle. This entity is created to only one project, which implies a finite lifetime. Generally, large PPP’s involve SPV’s, which imply that infrastructure PPP’s constitute SPV’s. SPV is responsible for the project in all of its strands. SPV is owned by the sponsors of the PPP’s and permits to maintain the assets and liabilities of the project out of sponsors’ balance sheets, because each sponsor has a little percentage of the SPV shares. SPV’s also avoid the possibility of the PPP project to be associated with a possible bankruptcy of one of its sponsors.
SPV’s are project financing; consequently, PPP’s are usually Project Financing. In the Project Financing, the question of reinvestment doesn’t exist and there is a fixed dividend policy with immediate payout. Inversely, in Corporate Finance, the dividends paid are strictly controlled.
Under imperfect markets, dividends, investment and financing compete for the use of internal funds. One of the factors that influence the dividend payout ratio of firms is the
agency costs, since dividends can reduce the agency costs. Other explanatory factor is the size of the firm. Larger firms present a higher dividends payout ratio. The firms’ past and expected future growth rate of sales have a negative relationship with dividend payout ratio. On the other hand, dividend payout ratio presents a positive function of the firm’s number of common stockholders. The announcement of distribution of dividends leads to abnormal returns to the firm. If a firm reduces its dividend yield, the price of the firm’s securities increases. Earnings are a strong explanatory variable of dividend payout ratio. Indenture provisions, debts to be paid at specific dates and liquidity positions are also explanatory variables of dividend yield.
Chapter 3- Methodology and Data
In this chapter, it is presented the methodology used in the study and the data collected. The objective of this dissertation is to know which of this group of companies presents a higher dividend pay-out ratio: road PPP’s in Portugal or Portuguese and Spanish listed companies in the sector of construction. In the Literature Review, it is clear that PPP’s have distinctive characteristics comparing with other companies. Literature Review permitted to conclude that PPP’s are considered as Project Finance, characterized by only one project and absence of reinvestment, which leads to a particular dividends distribution policy. Given this deductions, it was formulated a hypothesis of study:
Dividend payout ratio is higher to the Road PPP’s.
The variables whose value was collected are “Net Income” and “Total Dividends”. The data collected corresponds to years between 2003 and 2011, 9 years in total.
The sample (objects of study) is composed by the Portuguese Road PPP’s in exploitation in the present, and listed construction firms in Euronext Lisbon and in IBEX 35, 24 companies in total. Brisa is not included because of the discrepancy of values comparing with the other road PPP’s (the levels of Net Profits of Brisa are considerably higher than the other PPPs’. Brisa has existed for longer than road PPP’s and is already in “Cruising Speed”). Furthermore, other reason for not to include Brisa is the fact that it is a concession and not a PPP, which means that it has proper Revenues. The choice of the construction firms was motivated by the fact that the construction sector and road PPP’s have some common characteristics. Construction firms usually have capital participation in road concessions.
The companies analyzed are the following:
- PPP’s: Euroscut Algarve, Ascendi Norte, Ascendi Beiras Litoral e Alta, Brisal, Ascendi Costa de Prata, Auto-Estradas do Douro Litoral, Euroscut Algarve, Ascendi Grande Lisboa, Ascendi Porto, Lusoponte, Norscut Interior Norte and Auto-Estradas Norte. - Construction companies: Martifer SGPS SA, Mota Engil SGPS SA, Sacyr Vallehermoso SA, Soares da Costa SGPS SA (Portugal) and ACS SA, Arcelormittal, FCC SA (Spain).
Data was collected on the firms’ Annual Reports, on Bloomberg data base, on Amadeus data base, CMVM website and CNMV website. After the data is collected, statistical analysis were made about the proportion of Dividends in Net Profit to the companies at the years referred previously. A comparison was made between the results to PPP’s and to construction companies.
Chapter 4- The Portuguese Case
In this chapter, it will be discussed the specific Portuguese case in what concerns PPP’s, and more precisely, road PPP’s.
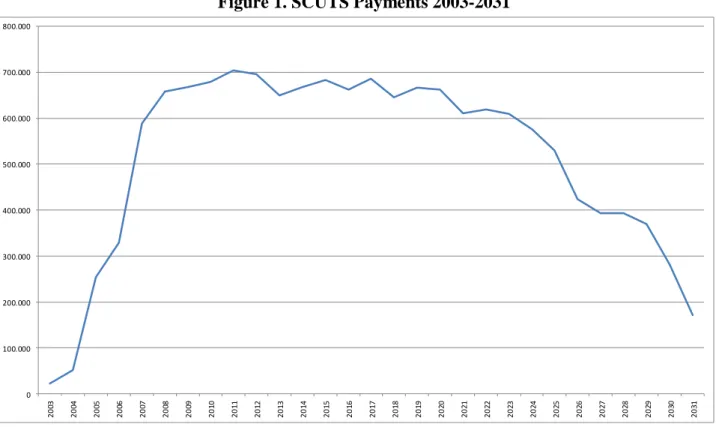
Portugal is one of the leading countries in the market of PPP’s. (Sarmento & Reis, 2013). The beginning of PPP’s in Portugal was in 1993 and road PPP’s were the first type of PPP developed in the country (Sarmento & Reis, 2013). According to these authors, in the past 15 years the private investment in PPP’s was large (above 17 billion of EUR), materialized in 36 PPP’s contracted. In the same way, the financial effort of the Government is high, representing per year above 0.5% of the Gross Domestic Product (GDP) until almost 2030, and per year about 1% of the GDP between 2014 and 2020, as we can see in Figure 1. Sarmento & Reis (2013) concluded that the Government sees PPP projects as a way to put the public investment outside of the consolidation of Public accounts.
Figure 1. SCUTS Payments 2003-2031
Unit: Thousands of Euros.
This figure presents large variations of the amounts of SCUT payments. Between 2003 and 2006, the payments have a large increase, ranging from around zero to 700 Thousands of Euros. These are the years where the Revenues do not exist or are insignificant. For this reason, the payments required were very high, and the distribution of Dividends is inexistent. From 2007 to 2011, SCUT’s presented higher level of Revenues, and consequently positive Profits, which led to a stabilization of the payments and also to the existence of distribution of Dividends.
A recent study of the EIB (European Investment Bank) concluded that Portugal is the leader country among the European Countries in what concerns Capital Expenditure in PPP projects proportionally to the GDP (Sarmento & Reis, 2013). According to PricewaterhouseCoopers (2005), Portugal is the country with the highest value of Public
0 100.000 200.000 300.000 400.000 500.000 600.000 700.000 800.000 2 0 03 2 0 04 2 0 05 2 0 06 2 0 07 2 0 08 2 0 09 2 0 10 2 0 11 2 0 12 2 0 13 2 0 14 2 0 15 2 0 16 2 0 17 2 0 18 2 0 19 2 0 20 2 0 21 2 0 22 2 0 23 2 0 24 2 0 25 2 0 26 2 0 27 2 0 28 2 0 29 2 0 30 2 0 31
Private Partnerships per capita, even about the double of the same value registered at United Kingdom.
In Portugal, doubts have been raised about the affordability and efficiency of PPP’s, according to the trend already verified in other countries. (Sarmento & Reis, 2013). This doubts have risen especially in road PPP’s (in the case of Portugal), that brings many doubts about Value for Money (VFM) achieved by road concessions. In addition to the high level of costs, it is necessary to take in account also the revenues that will come to the Government because of PPP’s. However, the forecasts of expected Revenues (traffic) have revealed to be optimistic, in terms of Government Revenues (and not private Revenues), Sarmento & Reis, 2013. That is one of the reasons why the VFM of these PPP projects raise doubts. Other reason is the fact that, in the case of SCUT’s, the risk transfer to the private sector was low. Furthermore, the negotiations of SCUT Public Private Partnerships was not efficient, there were no public sector comparator (Sarmento, 2010). The 2003 audit on Public Private Partnerships, made by the Court of Audit of Portugal has concluded that the decision of the use of Public Private Partnerships in the SCUT’s (“Sem Custos para o Utilizador”, Without Costs to the User) was not based in any study on the efficiency, economy and effectiveness of these PPP’s. In fact, Sarmento (2010) concluded in a study that Public Private Partnerships in Portugal, in the conditions that they have been processed, do not create Value for Money to the public sector. They concluded also that, in this case, the use of traditional procurement would be less expensive than the public private partnerships. Sarmento (2010) argue indeed that Public Private Partnerships can be more efficient than the traditional procurement, only if they
satisfy the condition that the earnings of efficiency exceed the higher cost of finance (due to higher interest rates that are required to private entities).
Sarmento (2010) do not argue that PPP’s are not a good option to make public investments; He argues instead that the lack of planning in the Portuguese case of PPP’s in the sector of SCUTS was adverse. International publications show that the opinions on which the Public Private Partnerships create Value for Money are not consensual. The required level of payments that Government has to expend to PPP’s is high. This fact, along with the bad political moment in Portugal because of the financial crisis, and specifically the intervention of the “Troika”, has required a renegotiation of PPP contracts. Following the requirement imposed by the “Troika” to renegotiate the contracts, the Government has renegotiated some conditions to reduce and postpone the payments. These renegotiations were successful but transferred to the Government more risk, ending worse in the long run (Sarmento & Reis, 2013).
Chapter 5-Statistical Results
In this chapter, the Descriptive Statistics will be presented through some statistical variables that explain Dividend payout of the companies in analysis. First, graphs concerning PPP’s are presented and afterwards the graphs of construction companies. In Table I, formulated based on the data collected, we observe the Descriptive Statistics of the ratio Dividends/ Net Profit (Dividend Payout ratio), to the PPP’s in analysis in years between 2003 and 2011. The Mean presents a trend to increase between 2003 and 2011; in 2003 and 2004 we observe a null Mean, in 2005 24% and in 2011, 37%. The Dividend Payout ratio increases in mean 13% between 2005 and 2011. Median is always
null, except in 2008 (value: 17%). This means that the Dividend Payout ratio presents many observations equal to zero. Standard Deviation, from 2005 to 2011 presents values around 40%, which means that observations present some dispersion around the Mean. In all years there existed at least one PPP with null Dividend Payout ratio (the Minimum is zero in all years). The Maximum reached 1 in 2008 and 2010 and 95% during 5 years. As conclusions, we have that in 2003 and 2004 dividend payout ratio was zero to all PPP’s. Dividend payout ratio increased between 2005 and 2011. From 2007 onwards, a significant part of PPP’s have distributed almost 100% of their Net Profits, because of the existence of Revenues from the referred year. However, there are some PPP’s that make the Mean to be lower than 50% in all years. As it will be shown in Table 2, PPP’s that are not SCUT’s (Oeste, Norte, Douro Litoral, Grande Lisboa, Lusoponte and Brisal) distributed a lower level of dividends. All of them, except Lusoponte, present a Mean of 0%.
Table I. Dividends/Net Profit of PPP’s – Analysis by year (2003-2011)
Source: Figure formulated based on the data collected
Note: The number of observations varies year to year because there are years in which do not exist data to some PPP because of its posterior creation and also because in some situations the Net Profit was null.
Year Mean Median Standard Deviation Minimum Maximum N
2003 0% 0% 0% 0% 0% 9 2004 0% 0% 0% 0% 0% 9 2005 24% 0% 41% 0% 95% 9 2006 28% 0% 46% 0% 95% 10 2007 31% 0% 43% 0% 95% 11 2008 38% 17% 46% 0% 100% 12 2009 23% 0% 38% 0% 95% 13 2010 42% 0% 47% 0% 100% 13 2011 37% 0% 44% 0% 95% 13
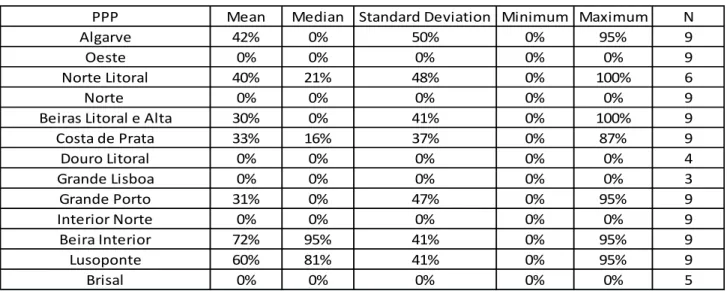
In Table II, formulated based on the data collected, we observe the Descriptive Statistics of the ratio Dividends/ Net Profit (Dividend Payout ratio), to the PPP’s in analysis in years between 2003 and 2011. This is an analysis by PPP. To the PPP’s which Mean is not zero, the Mean of the Dividend Payout Ratio varies between 30% (Beira Litoral e Alta) and 72% (Beira Interior). To six PPP’s, the Mean is null. Median varies between zero and 95%. Standard Deviation is zero to the PPP’s that has Mean equal to zero; to the other PPP’s, the Standard Deviation varies from 37% and 50%, which means that observations present some dispersion around the Mean. To all PPP’s, the Minimum Dividend Payout ratio observed is zero. The Maximum is zero to the same PPP’s which Mean is zero and reached 1 in Norte Litoral and Beira Litoral e Alta, 87% at Costa de Prata and 95% at Algarve, Grande Porto, Beira Interior and Lusoponte.
Table II. Dividends/Net Profit of PPP’s – Analysis by PPP (2003-2011)
Source: Figure formulated based on the data collected
Note: The number of observations varies year to year because there are years in which do not exist data to some PPP because of its posterior creation and also because in some situations the Net Profit was null.
PPP Mean Median Standard Deviation Minimum Maximum N
Algarve 42% 0% 50% 0% 95% 9
Oeste 0% 0% 0% 0% 0% 9
Norte Litoral 40% 21% 48% 0% 100% 6
Norte 0% 0% 0% 0% 0% 9
Beiras Litoral e Alta 30% 0% 41% 0% 100% 9
Costa de Prata 33% 16% 37% 0% 87% 9 Douro Litoral 0% 0% 0% 0% 0% 4 Grande Lisboa 0% 0% 0% 0% 0% 3 Grande Porto 31% 0% 47% 0% 95% 9 Interior Norte 0% 0% 0% 0% 0% 9 Beira Interior 72% 95% 41% 0% 95% 9 Lusoponte 60% 81% 41% 0% 95% 9 Brisal 0% 0% 0% 0% 0% 5
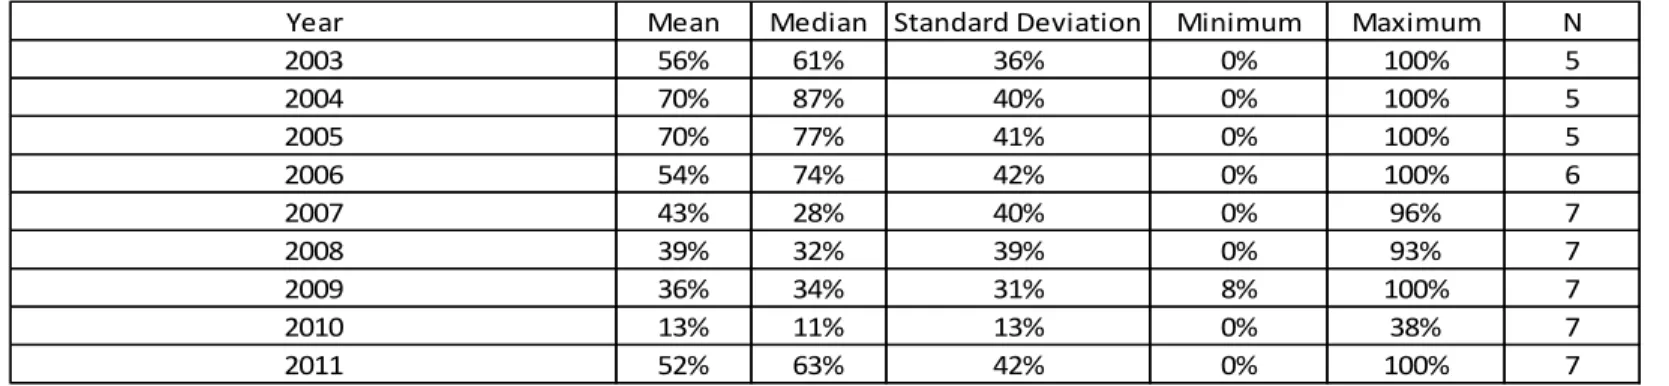
In Table III, formulated based on the data collected, we observe the Descriptive Statistics of the ratio Dividends/ Net Profit (Dividend Payout Ratio), to the construction companies in analysis in years between 2003 and 2011. The Mean of the Dividend Payout Ratio varies between 13%, in 2010, and 70% (2004 and 2005). Median of Dividend Payout Ratio presents values between 11% and 87%. Standard Deviation, from 2003 and 2011 presents values between 13% and 42%, which means that observations present some dispersion around the Mean. In almost all years existed at least one company with null Dividend Payout (The Minimum is zero in all years, except 2009). The Maximum is 100% in 2003-2006 and in 2009 and 2011, 96% in 2007, 93% in 2008 and 38% in 2010, which means that in almost all years, at least one construction company distributed all its Net Profits in the form of dividends.
The construction companies that most contributes to the high Means are ACS SA, Sacyr Vallehermoso SA, FCC SA and Mota Engil SGPS SA. A particular note that we can refer is that in 2009 and 2010 the Mean of Dividend Payout Ratio was lower because of the financial crisis.
Comparing with the correspondent table of PPP’s (table 1), it can be concluded that Mean by year is, in general terms, higher to construction companies than to PPP’s. The Median is also higher to the construction companies than to PPP’s. The Standard Deviation is similar to PPP’s and construction companies. In terms of Maximum, the values are similar to PPP’s and construction companies. Both types of organization present Maximum of 100% in some years. PPP’s present some Maximum values of 0%, but for construction companies this doesn’t happen.
Table III. Dividends/Net Profit of Construction Companies – Analysis by year (2003-2011)
Source: Figure formulated based on the data collected
Note: The number of observations varies year to year because there are years in which do not exist data to some company because of its posterior creation.
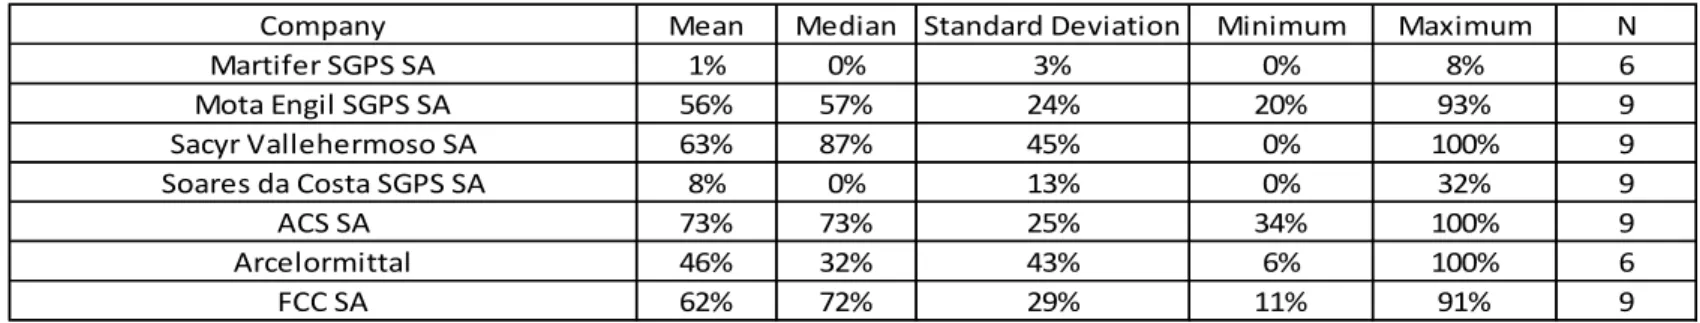
In Table IV, formulated based on the data collected, we observe the Descriptive Statistics of the ratio Dividends/ Net Profit (Dividend Payout Ratio), to the construction companies in analysis in years between 2003 and 2011. The Mean of the Dividend Payout Ratio varies between 1% (Martifer SGPS SA) and 73% (ACS SA). Median varies between zero and 87%. Standard Deviation presents low values, which means that observations present low dispersion around the Mean. The Minimum Dividend Payout ratio varies between zero and 34%. The Maximum reached 100% in three companies. In terms of conclusions, the Mean observed is in general higher to construction companies than to PPP’s. Concerning Standard Deviation, the situation is similar to PPP’s and to construction companies. Unlike PPP’s, in which Minimum is always zero, to construction companies Minimum varies between 0% and 34%. The years that most contributed to high levels of dividends are from 2003 to 2006.
Year Mean Median Standard Deviation Minimum Maximum N
2003 56% 61% 36% 0% 100% 5 2004 70% 87% 40% 0% 100% 5 2005 70% 77% 41% 0% 100% 5 2006 54% 74% 42% 0% 100% 6 2007 43% 28% 40% 0% 96% 7 2008 39% 32% 39% 0% 93% 7 2009 36% 34% 31% 8% 100% 7 2010 13% 11% 13% 0% 38% 7 2011 52% 63% 42% 0% 100% 7
Table IV. Dividends/Net Profit of Construction Companies – Analysis by company (2003-2011)
Source: Figure formulated based on the data collected
Note: The number of observations varies year to year because there are years in which do not exist data to some company because of its posterior creation.
The tables presented shows different characteristics of PPP’s and construction companies, in what concerns Dividend Payout ratio. It was made an interrelation between the analysis by year and by PPP/construction company. This helped to understand the values obtained. Some explanations to the values were presented. In the following chapter, it will be presented a complementary analysis to tables presented, and it will permit to reach final conclusions.
Company Mean Median Standard Deviation Minimum Maximum N
Martifer SGPS SA 1% 0% 3% 0% 8% 6 Mota Engil SGPS SA 56% 57% 24% 20% 93% 9 Sacyr Vallehermoso SA 63% 87% 45% 0% 100% 9 Soares da Costa SGPS SA 8% 0% 13% 0% 32% 9 ACS SA 73% 73% 25% 34% 100% 9 Arcelormittal 46% 32% 43% 6% 100% 6 FCC SA 62% 72% 29% 11% 91% 9
Chapter 6- Results
6.1 ResultsThe objective of the study is to conclude if PPP’s distribute a higher level of Dividend Payout Ratio than construction companies.
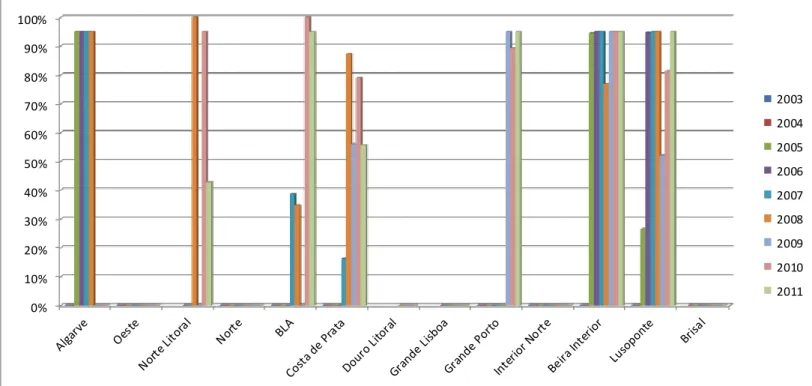
Figure 2. Dividends/ Net Profit of PPP’s – Analysis by PPP (2003-2011)
Source: Figure formulated based on the data collected
As we can see in Figure 2 (formulated based on the data collected) in the years in analysis, PPP’s of Oeste, Norte, Douro Litoral, Grande Lisboa, Interior Norte and Brisal have not distributed any dividends. This is explained by the fact that in this period, the Net Profit to all of this PPP’s was negative or null in most of years. In some cases, this is due to the beginning of this PPP’s few years ago, time not sufficient to have positive Net Profits. This is the case of Douro Litoral and Grande Lisboa, which began its activity in 2007. For example, the SCUT’s (Algarve, Norte Litoral, Beiras Litoral e Alta, Interior Norte, 0% 10% 20% 30% 40% 50% 60% 70% 80% 90% 100% 2003 2004 2005 2006 2007 2008 2009 2010 2011
Beira Interior, Grande Porto and Costa de Prata), that only presented dividends from 2007 onwards, are examples of PPP’s that did not present a high level of Dividend Payout Ratio. Beira Interior and Lusoponte were the PPP’s with the higher frequency in dividends distribution: they distributed dividends between 2005 and 2011.
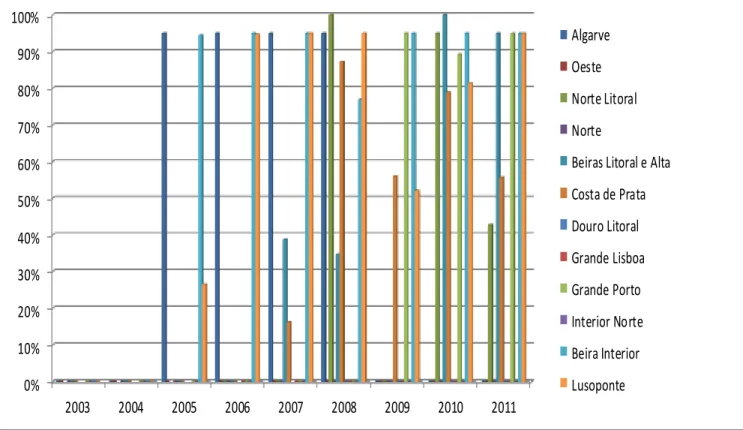
Figure 3. Dividends/ Net Profit of PPP’s – Analysis by year (2003-2011)
Source: Figure formulated based on the data collected
The main conclusion on figure 3 (formulated based on the data collected) is that between 2003 and 2011, the number of PPP’s that distributed dividends has gradually increased. In 2003 and 2004, none of the 12 PPP’s in the graph distributed dividends. The years in which a larger number of PPP’s has distributed dividends were 2010 and 2011: in these years, 6 of the 12 PPP’s in analysis distributed dividends. We can conclude that in 2008,
0% 10% 20% 30% 40% 50% 60% 70% 80% 90% 100% 2003 2004 2005 2006 2007 2008 2009 2010 2011 Algarve Oeste Norte Litoral Norte
Beiras Litoral e Alta Costa de Prata Douro Litoral Grande Lisboa Grande Porto Interior Norte Beira Interior Lusoponte
some PPP’s began to distribute the total amount of its net profits, which means a Dividend Payout Ratio of 100% (Norte Litoral in 2008 and Beiras Litoral e Alta in 2010).
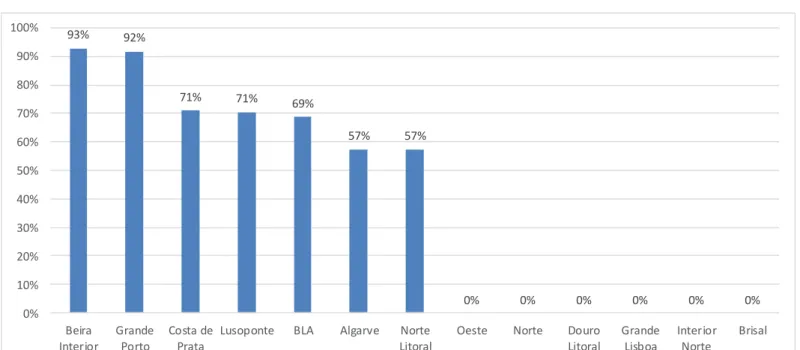
Figure 4. Total Dividends/ Total Net Profits of PPP’s (2003-2011)
Source: Figure formulated based on the data collected
According to Figure 4 (formulated based on the data collected), Beira Interior and Grande Porto have distributed more than 90% of their total Net Profits in the period in analysis (around 93% and 92% respectively). Lusoponte and Costa de Prata paid dividends around 71%, Beiras Litoral e Alta 69%, Norte Litoral and Algarve 57%. In fact, each one of the PPP’s that distributed dividends have distributed in total more than half of the Total Net Profits it generated. This reveals a strong policy of dividends distribution.
93% 92% 71% 71% 69% 57% 57% 0% 0% 0% 0% 0% 0% 0% 10% 20% 30% 40% 50% 60% 70% 80% 90% 100% Beira Interior Grande Porto Costa de Prata
Lusoponte BLA Algarve Norte Litoral
Oeste Norte Douro Litoral Grande Lisboa Interior Norte Brisal
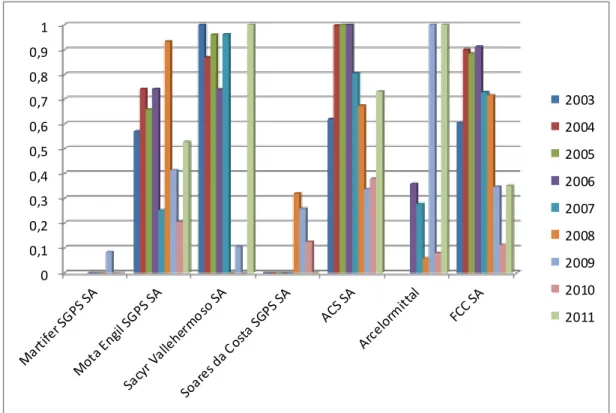
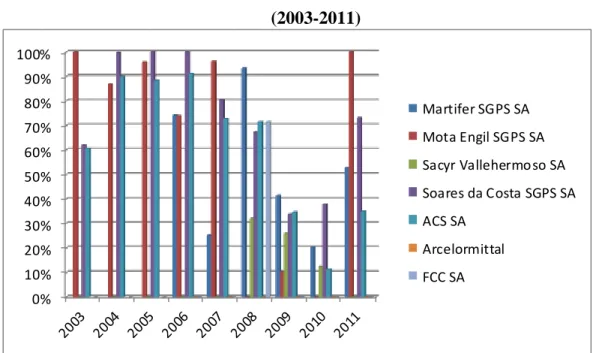
Figure 5. Dividends/ Net Profits of construction companies- Analysis by company (2003-2011)
Source: Figure formulated based on the data collected
According to Figure 5 (formulated based on the data collected), Martifer distributed dividends only in 2009. Except Martifer, 4 was the minimum number of years in which Construction Companies distributed dividends. Mota Engil, ACS and FCC distributed dividends in all years in analysis.
0 0,1 0,2 0,3 0,4 0,5 0,6 0,7 0,8 0,9 1 2003 2004 2005 2006 2007 2008 2009 2010 2011
Figure 6. Dividends/ Net Profit of construction companies – Analysis by year (2003-2011)
Source: Figure formulated based on the data collected
According to Figure 6 (formulated based on the data collected), 2003, 2004 and 2005 were the years in which the number of companies that distributed dividends was lower: only three companies per year. However, in the following years, this number increased. In 2008, 6 of the 7 companies in analysis have distributed dividends.
0% 10% 20% 30% 40% 50% 60% 70% 80% 90% 100% Martifer SGPS SA Mota Engil SGPS SA Sacyr Vallehermoso SA Soares da Costa SGPS SA ACS SA Arcelormittal FCC SA
Figure 7. Total Dividends/ Total Net Profits of construction companies (2003-2011)
Source: Figure formulated based on the data collected
As we see in Figure 7 (formulated based on the data collected), ACS has a dividend payout ratio of 75%, Sacyr 67% and FCC 64%. Mota Engil has a dividend payout ratio significantly lower, 44%. In the group of the lower dividend payout ratio, we find Soares da Costa, Arcellormittal and Martifer (25%, 19% and 15%, respectively).
6.2 Comparing Results for PPP’s and Construction Companies
According to the Literature Review, PPP’s and construction companies are different in several points. The fact that PPP’s are based in Project Finance distinguishes them from common companies, namely in terms of application of Net Profits. Then, and according to expected, the results obtained to PPP’s and to construction companies are different. The main differences are the following:
75% 67% 64% 44% 25% 19% 15% 0% 10% 20% 30% 40% 50% 60% 70% 80% 90% 100% ACS SA Sacyr Vallehermoso SA FCC SA Mota Engil SGPS SA Soares da Costa SGPS SA Arcelormittal Martifer SGPS SA
Six PPP’s (Oeste, Norte, Douro Litoral, Grande Lisboa, Interior Norte and Brisal) have not distributed any dividends in any years between 2003-2011, while in construction companies, all of them distributed dividends in some years. This can be explained by the fact that many PPP’s had negative Net Profits in some years, because of the beginning of its activity in recent years, especially SCUT’s, in which Revenues began to exist only in 2007. In Figure 3, we concluded that in 2003 and 2004 no PPP distributed any dividends. In what concerns PPP’s, to all of them that distributed dividends, the dividend payout ratio was equal or above 57%. Inversely, to the Construction Companies, four of them presented a dividend payout ratio equal or lower than 44%.
Although the mean of the dividend payout ratio is higher to the Construction companies than to the PPP’s, this is due to the fact that a considerable number of PPP’s did not distribute dividends (because of negative Net Profits). In PPP’s, the distribution of dividends have increased in the period in analysis. Inversely, in construction companies, the distribution of dividends tends to be constant (except in 2009-2011, because of the financial crisis).
Chapter 7 – Conclusions and Future Investigation
In this section, it will be presented the conclusion of this dissertation and the suggestions to future investigation on this topic. The Research Question of this dissertation (formulated according to the Literature Review) is: Dividend Payout is higher to PPP’s than to construction companies? The objective is then to find the response to this question.
In aggregated terms (dividing the total dividends distributed by all PPP’s in the period in analysis by the total net profits obtained by all PPP’s in the period in analysis, and doing the same to construction companies), we obtain a percentage of 64% to PPP’s and 24% for construction companies. This means that during these 9 years PPP’s have distributed 64% of their total Net Profits, and construction companies have distributed 24% of their total Net Profits. We can conclude then that in years 2003-2011 the Dividend Payout Ratio is significantly higher to PPP’s than to construction companies. It is important to refer that these percentages were computed considering Dividends and correspondent Net Profits only to years in which existed Positive Net Profits.
The conclusion referred in the previous paragraph is explained by the Literature Review: the fact that PPP’s are considered Project Finance (PPP’s have only one project with a finite lifetime), which implies that the need to reinvest is low, and consequently the Net Profits are generally available to pay dividends to shareholders. Inversely, construction companies are included in Corporate Finance, and need to reinvest; consequently, they use their Net Profits to invest, which reduces the amount of Net Profits available to distribute dividends.
PPP’s are characterized by its contractual clauses. Some of these clauses can be related to dividend payout, which means that contractual clauses are also possible explanatory variables of the conclusion reached in this dissertation.
After 2007, most PPP’s presented a dividend payout ratio of almost 100%. This fact has two explanations. The first is that from 2007, SCUT payments reached about 700 Million of Euros, and this level of payments is expected to maintain stable during about 20 years of the concessions. The second explanation is related with the first one. Revenues
generally follows a set of priorities in what concerns allocation of resources: first, Revenues are used to pay Operating and maintenance costs, second, they are used to pay costs with Tax, third, Revenues pay costs with debt (debt service and debt interest), fourth Revenues serve to pay shareholders returns – dividends. From 2007, with the maintenance of costs, that precede distribution of dividends, the level of dividends paid was expected to increase.
All PPP’s that distributed dividends presented a Dividend Payout ratio equal or above 57% during the entire period. Inversely, in Construction Companies, four of them presented a dividend payout ratio equal or lower than 44% during all period. Individually, which means by PPP or by year, although the mean of the dividend payout ratio is higher to the Construction companies than to the PPP’s, this is due to the fact that a considerable number of PPP’s didn’t distributed dividends (because of the negative Net Profits caused by its recent existence, namely the SCUT’s that began to have Revenues in 2007). According to these facts, the hypothesis defined to this study is proved to be true: We can conclude that Dividend Payout ratio is higher to the Road PPP’s than to the construction companies.
In what concerns the limitations of the study, the number of years used in the study is low and presents the disadvantage that, in the case of PPP’s, some of the years present a low level of Revenues. The second limitation is the low number of companies in analysis. In what concerns future research, we suggest that, in a few years, a study similar to this to be made, in order to reduce the effect of the first years of PPP’s life. Maintaining the number of years in study (9 years), but beginning at 2007 would allow to eliminate the
null dividends observed in 2003-2006 in some PPP’s (which was due to the fact that, in most cases, the majority of PPP’s presented negative net profits, because of its implementation few years ago). We suggest also the realization of studies about this issue including a higher number of companies and PPP’s, PPP’s of other sectors and also PPP’s and companies of other countries.
Chapter 8 – References
Aharony, J. and Swary, I. (1980), “Quarterly dividend and earnings announcements and stockholders’ returns: an empirical analysis”, The Journal of Finance, p. 1-12.
Al-Malkawi, Husam-Aldin Nizar (2005), “Dividend Policy of Publicly Quoted Companies in Emerging Markets: The Case of Jordan”, Doctoral Thesis, School of
Economies and Finance (University of Western Sidney).
Akintoye, A. and Beck, M. (2009), “Policy, Management and Finance of Public – Private Partnerships”, Blackwell Publishing Ltd.
Azeredo, A. (1999), “Financiamento de Longo Prazo no Brasil: Project Finance como alternativa para a Infra- Estrutura”, Master Paper, Universidade Federal do Rio de
Janeiro.
Bennet, J. and Johnson, M. (1979), “Public versus Private Provision of Collective Goods and Services: Garbage Collection Revisited”, Public Choice, 34 (1), p. 55-63. Bishop, Steven R. et al (2000), “Corporate Finance”, Prentice Hall Inc., Sidney. Black, F. and Scholes, M. (1974), “The effects of Dividend-Yield and Dividend Policy on Common Stock Prices and Returns”, Journal of Financial Economies, 1(1), p. 1-22. Boardman, A. and Vinning, A. (1989), “Ownership and Performance in Competitive Environments: A Comparison of the Performance of Private, Mixed and State Owned Enterprises”, Journal of Law and Economics, 32, p.1-33.
Borcherding, T.; Pommerehne, W.; Schneider, F. (1982), “Comparing the Efficiency of Private and Public Production: A Survey of the Evidence from Five Federal States”,
Journal of Economic Theory: Public Production, Suppl. 2: p. 27-56.
Borges, L. (2002), “Project Finance e Infra-Estrutura: Descrição e Críticas”, Working Paper.
Browne, M. (2003), “Urban Freight Movements and Public-Private Partnerships”, Third International Conference on City Logistics 25th-27th June 2003, Madeira.
Comer, B. (1996), “Project Finance Teaching Note”, The Wharton School, p. 2-7. Damodaran, Aswath (2001), “Corporate Finance: Theory and Practice”, Hardcover. Dhrymes, P. and Kurz, M. (1967), “Investment, Dividends, and external finance behavior of firms”, Determinants of investment behavior, edited by Robert Ferber New York: Columbia University Press.
Diário da República (2003), Decree Law number 86/2003.
Divecha, A. and Morse, D. (1983), “Market responses to dividend increases and changes in payout ratios”, Journal of Financial and Quantitative analysis, vol 18, nº 2. European Bank of Investment (2004), “The EIB´s role in Public-Private Partnerships”, p. 2.
European Commission (2003), “Guidelines for Successful Public-Private-Partnerships”. Fama, E. (1974), “The empirical relationships between the dividend and investment decisions of firms”, American Economic Review, 64, p. 304-318.
Freitas, C. (2008), “Análise de Risco e Definição de Critérios de Avaliação e
Monitorização em empreendimentos do tipo PPP (Public-Private Partnerships)”, Master Paper, Faculdade de Economia da Universidade do Porto.
Gonedes, M. (1978), “Corporate Signaling, External Accounting, and Capital Market Equilibrium: Evidence on Dividends, Income, and Extraordinary items”, Journal of
Accounting Research, Vol 16, No 1, p. 26-79.
Greve C. and Hodge, H. (2007), “Public- Private Partnerships: An International Performance Review”, Public Administration Review, vol 67,n.3.
Grimsey, D. and Lewis, M. (2004), “The Worldwide Revolution in Infrastructure Provision and Project Finance”, 1st Ed. United Kingdom: Edward Elgar Publishing Limited, p. 32-220.
Ham, V.; Hans; Koppenjan, J. (2001): “Building Public-Private Partnerships:
Assessing and Managing Risk in Port Development” I Public Management Review vol. 3., no. 4.
Higgins, R. (1972), “The corporate dividend saving decision”, Journal of Financial and
quantitative analysis, 7, p.1527-1541.
Lintner, J. (1956), “Distribution of incomes of corporations among dividends, retained earnings and taxes”, American Economic Review, 46, p. 97-113.
Litzenberger, R. and Ramaswamy, K. (1979), “The effects of personal taxes and Dividends on Capital Asset Prices: Theory and Empirical Evidence”, Journal of
Financial Economics 7(2), p. 163-195.
Lloyd, W.; Jahera, J.; Page, D. (1985), “Agency costs and dividend payout ratios”,
McCabe, G. (1979), “The empirical relationship between investment and financing: a new look.” Journal of Financial and Quantitative Analysis, 14, p. 119-135.
Miller, M. and F. Modigliani (1961), “Dividend Policy Growth and the Valuation of shares”, Journal of business, p. 411-433.
OECD (2008), “Public-Private Partnerships: In Pursuit of Risk Sharing and Value for Money”, OECD Publishing.
PricewaterhouseCoopers (2004), “Developing Public Private Partnerships in New Europe”, p. 11.
Rozeff, M. (1982), “Growth, Beta and agency costs as determinants of dividend payout ratios”, Journal of Financial Research, p. 249-259.
Santos, T. (2006), “A Transferencia de Risco em PPP”, Master Paper, Universidade Técnica de Lisboa, p. 6-56.
Sarmento, J. (2010), “Do public-private partnerships create value for money for the public sector? The Portuguese experience”, OECD Journal on Budgeting, 2010, p. 3-25. Sarmento, J. and Reis, R. (2013), “Buy back PPPs – An arbitrage opportunity”, OECD
Journal on Budgeting, 2013, p. 2-6.
Savas, E. (2000), “Privatization and Public-Private Partnerships”, CQ Press.
Slivker, A. (2011), “What is Project Finance and hoe does it work?”, Working Paper. UNESCAP (2007), “Public – Private Partnerships in Infrastructure Development: An introduction to issues from different perspective”, UNESCAP, Transport and Tourism
Division, Bangkok.
Websites:
Direção Geral do Tesouro e Finanças. Available at:
http://www.dgtf.pt/Parcerias-Publico-Privadas/As-PPP-em-7-questoes (Access at Jun 15, 2013).