0
The Future of Smartwatches
– A case on the current status and expected
category evolution on the Portuguese market
Sara Cristina Nunes de Melo
Dissertation written under the supervision of Prof. Nuno Crispim
Dissertation submitted in partial fulfilment of requirements for the
International MSc in Management with Major in Marketing, at the
Católica-Lisbon School of Business and Economics
August 2017
1
“They always say time changes things, but you actually have to
change them yourself.”
2
ABSTRACT
Title: The Future of Smartwatches – A case on the current status and expected category
evolution on the Portuguese market
Author: Sara Cristina Nunes de Melo
The introduction of new technologies and development of tools that facilitate everyday consumers’ life is part of the reality we are living. And whereas some innovations might be of slighter importance and distinctiveness, others might imply a significant change in the consumer behaviour, totally redefining the marketplace expectations. On the latter, and considering its high level of uncertainty, consumer acceptance plays a key role that companies must be aware of and consider in their strategy, in order to mitigate any barriers it might bring. The aim of this dissertation is to provide insights on how is the smartwatches category evolving in the Portuguese market and how is it possible to leverage its growth, by assessing in detail the current status of the market globally and locally, as well as retrieving insightful quantitative data on Portuguese consumer preferences towards this category.
The methodology used concerns qualitative data retrieved from group interviews to 3 smartwatch owners and 4 non-owners, as well as quantitative data obtained through a survey conveyed to 258 valid respondents. All supported with an extensive literature review on both diffusion of innovation theory, as well as smartwatch definition, update on current status and foreseen evolution.
The main findings suggest that, currently, smartwatches are at the chasm stage of the product lifecycle with a need of developing strategies to cross from the early adopter to the mainstream market. These same strategies are proposed in this dissertation, taking as base both literature insights as well as consumer quantitative contribution.
Keywords: Smartwatch; Wearables; Innovation Acceptance; Adopter Category; Product Life
3
RESUMO
Título: O Futuro dos Smartwatches – Caso sobre o estado atual e evolução esperada da
categoria no mercado português.
Autor: Sara Cristina Nunes de Melo
A introdução de novas tecnologias e desenvolvimento de ferramentas facilitadoras do dia-a-dia do consumidor fazem parte da realidade atual. E enquanto algumas inovações podem ser de menor importância ou distinção, outras implicam uma mudança significativa do comportamento do consumidor, redefinindo totalmente as expectativas do mercado. No último caso, e considerando o seu alto nível de incerteza, a aceitação do consumidor desempenha um papel-chave para as empresas, devendo considerá-la na sua estratégia e mitigar potenciais barreiras que possa trazer.
O objetivo desta dissertação é assim, proporcionar conhecimento na evolução da categoria de smartwatches em Portugal assim como entender de que forma alavancar o seu crescimento, ao analisar em detalhe o estado atual do mercado global e local, recolhendo dados quantitativos relevantes das preferências do consumidor Português relativas à categoria.
A metodologia utilizada inclui dados qualitativos recolhidos através de entrevistas de grupo a 3 detentores de smartwatch e 4 não-detentores, assim como dados quantitativos recolhidos num inquérito distribuído a 258 inquiridos válidos. Suportado por uma extensiva revisão bibliográfica sobre teoria da difusão de inovação, assim como na definição e descrição do estado atual do mercado de smartwatches e sua expectável evolução.
As principais conclusões sugerem que atualmente os smartwatches se encontram na fase de chasm do ciclo de vida do produto, com necessidade de desenvolver estratégias que os passem do mercado de pioneiros para o comercial. Estas mesmas estratégias são propostas nesta dissertação, tomando como base os conhecimentos retirados da revisão literária assim como da contribuição de dados quantitativos de consumidor.
Palavras-Chave: Smartwatch; Wearables; Aceitação de Inovação; Categorias de Adotantes;
4
ACKNOWLEDGEMENTS
Firstly, I would like to express my sincere gratitude to my advisor, Professor Nuno Crispim, who throughout the whole process has demonstrated continuous support and availability to teach me, guide me and encourage me to finish this stage of my academic path. His experience on the industry and valuable insights helped me in all the time of research and writing of this thesis.
I would also like to thank to all those who took the time to help me directly in the development of this research – to both the fellows who participated in the group interviews, as well as all those who had the opportunity to answer the online survey. Without their invaluable insights, this study would not have been possible. Moreover, I couldn’t forget to mention my friend Rita, who has gone through the same process side-by-side with me, and whose support was crucial. Finally, I must express my most profound gratitude to my parents, Cristina and Sérgio, my whole family and to my greatest friends Carlota and Joana, for providing me with unfailing support and unceasing encouragement throughout my years of study and through the process of researching and writing this thesis. This is the end of a cycle. Thank you!
5 CONTENTS ABSTRACT ... 2 RESUMO ... 3 ACKNOWLEDGEMENTS ... 4 CONTENTS ... 5 LIST OF FIGURES ... 7 CHAPTER 1 – INTRODUCTION ... 8 1.1. Background ... 8 1.2. Problem Statement ... 8
1.3. Aim of the Research ... 8
1.4. Research Method ... 9
1.5. Academic and Managerial Relevance ... 9
1.6. Dissertation Outline ... 10
CHAPTER 2 – LITERATURE REVIEW ... 11
2.1. INNOVATION ... 11
2.1.1. Types of Innovation ... 11
2.1.2. Diffusion of Innovation ... 11
2.1.3. Innovation-Decision Process ... 12
2.1.4. Innovation Acceptance Determinants ... 13
2.1.5. Technology Acceptance Life Cycle and Adopter Categories ... 14
2.2. WEARABLES ... 17
2.2.1. Smartwatches ... 18
2.2.2. The Wearables Market Worldwide ... 19
2.2.3. Smartwatches Market in Portugal ... 24
CHAPTER 3 – METHODOLOGY ... 25
3.1. Research Approach and Design ... 25
3.1.1. Literature Review: Exploratory Research ... 26
3.1.2. Group Interviews: Exploratory and Descriptive Research ... 26
3.1.3. Online Survey: Descriptive and Explanatory Research ... 26
CHAPTER 4 – RESULT ANALYSIS ... 29
4.1. Qualitative Research – Interviews ... 29
4.2. Quantitative Research ... 29
4.2.1. Preliminary Analysis ... 29
4.2.2. In-depth Analysis ... 34
6
5.1. Summary of Conclusions... 42
5.2. Recommendation Plan ... 43
5.3. Limitations and Future Research ... 45
CHAPTER 6 – APPENDICES ... 47
APPENDIX I – Adopter Categories ... 47
APPENDIX II - History of Smartwatches ... 47
APPENDIX III – Main Players Detailed ... 48
- Fitbit ... 48
- Xiaomi ... 49
- Apple ... 49
- Garmin ... 50
- Samsung ... 50
- Other Players: Luxury&Designer Brands & Hybrids ... 51
APPENDIX IV – Interviews ... 52
- Group Interview Script ... 52
- Group Interview Main Conclusions ... 54
APPENDIX V – Questionnaire ... 59
APPENDIX VI – Measures ... 69
APPENDIX VII – Result Analysis ... 71
- K-Mean Cluster Analysis ... 71
- Principal Component Analysis ... 73
7
LIST OF FIGURES
Figure 1 - Unified Theory of Acceptance and Use of Technology - Research Model ... 13
Figure 2 - The Technology Adoption Life Cycle ... 15
Figure 3 - The Dual-Model Case: The Saddle ... 16
Figure 4 - Wearables Worldwide Shipments from 2014 to 1Q17 (in million units) ... 21
Figure 5 - Smartwatch (Watch+Wristband) Shipments and Forecast until 2020 ... 23
Figure 6 - Methodology Framework ... 25
Figure 7 - Smartphone Worldwide Sales 2007 - 2016 ... 35
LIST OF TABLES Table 1 - Types of Smartwatches ... 19
Table 2 - Wearable Shipments Worldwide Evolution ... 20
Table 3 - Top Wearable Products with Shipments, Market Share and 5-Year CAGR (shipments in millions) ... 20
Table 4 - Total Watches Market vs. Smartwatches and Swiss Watches ... 20
Table 5 - Wearables Worldwide Main Players' Shipments and Market Shares ... 22
Table 6 - Data Reliability Test ... 32
Table 7 - Average Market Price vs. Consumer Average WTP ... 41
Table 8 - Rogers (1962) Summary of the Research Evidence Supporting and Not Supporting Generalizations about the Characteristics of Adopter Categories ... 69
Table 9 - Determinants of Intention and Behaviour Constructs and Scales (Adapted from Venkatesh et al., 2003) ... 70
Table 10 - Characterization of Early Adopters Scales (Adapted from Rogers, 1962) ... 70
Table 11 - Final Cluster Centers ... 71
Table 12 - Number of Cases in each Cluster ... 71
Table 13 - ANOVA Cluster Analysis ... 71
Table 14 - Cluster Descriptives ... 72
Table 15 - KMO and Bartlett's Test (Smartwatch Owners) ... 73
Table 16 - Total Variance Explained (Smartwatch Owners) ... 74
Table 17 - Rotated Component Matrix (Smartwatch Owners) ... 74
Table 18 - KMO and Bartlett's Test (Smartwatch Non-Owners) ... 73
Table 19 - Total Variance Explained (Smartwatch Non-Owners) ... 74
8
CHAPTER 1 – INTRODUCTION 1.1.Background
Back in the 15th century, when watches were introduced, they served as a portable device to tell time. As years went by, this role evolved and watches started becoming pieces of jewellery and a symbol of status. And in the 21st century, when almost everybody owns a cell phone that
displays time digitally, wristwatches are increasingly at stake to lose its utilitarian function. In the beginning of the century, a new innovation arose, the smartwatch – a new type of device that combines the functionalities and capabilities of a smartphone, in the form of a wristwatch. And just as the introduction of wristwatches in the market led to the almost disappearance of pocket watches in the 20th century, could the smartwatch soon replace a traditional wristwatch?
In fact, in its first years, the smartwatch appeared to be succeeding and growing steadily, especially in 2015, with the launch of the Apple watch, that the category awareness and sales have rocketed (about 205% sales increase vs. previous year). However since 2016, that smartwatch category growth has been decelerating (in 1Q17, YoY growth was only 14%), which is particularly curious to a new innovation to lose traction after a well succeeded launch.
1.2.Problem Statement
Thus, this thesis starting point problem is on the deceleration of the smartwatches category over time, and it strives to understand the reasons behind this deceleration and how to revamp it. This will be possible by analysing and extensively describing the actual context of the smartwatches category in the Portuguese market, as well as its expected evolution, taking in consideration literature and theory on diffusion of innovation.
Hence, I was able to define the problem statement of this research as:
“What is the current status and expected evolution of the smartwatches category in the Portuguese market?”
1.3.Aim of the Research
The ultimate goal of this thesis is to provide insights on how is the smartwatches category evolving and how is it possible to leverage its growth, both through the conceptions of academics with previous experiences in launching innovation, but also, taking into account consumer preferences. Thus, the research questions to be addressed by this study are the following:
9
RQ1: What type of innovation are smartwatches?
RQ2: At what stage of the product lifecycle are smartwatches?
RQ3: Which drivers better explain consumer purchase intention of smartwatches?
RQ4: Which drivers better explain consumer satisfaction with smartwatches?
RQ5: What are the areas of development for smartwatches to meet consumers’ needs? 1.4.Research Method
This thesis’ methodology was led by three purposes: exploratory, descriptive and explanatory. Primary data was retrieved from qualitative group interviews of two groups of people – smartwatch owners and non-owners –, and from quantitative online survey, administered to a sample of Portuguese population.
In order to support the primary data, secondary data was collected for the literature review, comprising two central topics – a theoretical framework on diffusion of innovation, as well as general and detailed information on the wearables (particularly smartwatches) market.
1.5.Academic and Managerial Relevance
To the best of my knowledge, there hasn’t been any study that actually looked at the market status and expected evolution of smartwatches in the future, taking in consideration consumer preferences.
Despite its validity and necessity, several studies have looked at very particular scenarios, not considering everyday use. Bieber, Haescher, & Vahl (2013) studied software and hardware improvement of smartwatches, particularly within activity sensor recognition. Migicovsky, Durumeric, Ringenberg, & Halderman (2014) looked into privacy and security issues of smartwatches applied to the academic context, whereas Giang, Hoekstra-Atwood, & Donmez (2014) explored the implications of its usage while driving. Lastly, Bernaerts, Druwé, Steensels, Vermeulen, & Schöning (2014) studied the application of these devices to the business environment. The closest research found – of Cecchinato, Bird, & Cox (2015) – report’s findings on why and how people use smartwatches in real life, though conducting it via exploratory interviews, and not taking in consideration quantitative data. Moreover, it doesn’t explore a particular market, as this study whose scope relies on the Portuguese market.
10
Thus, this research expects to further develop the study of smartwatches applied to the everyday use, in the particular context of the Portuguese market, providing insightful conclusions both for the academic context – regarding diffusion of innovation literature – as well as the business context, by contributing to the knowledge on consumer behaviour towards these devices and by proposing a series of recommendations on how to leverage this new category in the market.
1.6.Dissertation Outline
This thesis presents five main chapters. The first one provides an overview of the research topic as well as its relevance for the study, comprising the problem statement and respective research questions. The second chapter regards to a literary review on the theoretical and practical topics associated to this research, such as Innovation and Smartwatches market. In chapter 3, there is an extensive description of the methodology used in this research as well as followed procedures for sample selection, data collection and used measures. Chapter 4 includes the discussion of results obtained from the research, concerning both primary as secondary data, supported by statistical analysis. Lastly, chapter 5 closes the dissertation by presenting main conclusions, recommendations, as well as limitations and suggestions for further research.
11
CHAPTER 2 – LITERATURE REVIEW 2.1. INNOVATION
While many authors broadly define innovation as technology, Bass (1969) refers to it as a “broad range of distinctive new generic classes of products”. Rogers (1962), though, considers it as an “idea, practice, or object that is perceived as new by an individual”. Thus, for the later, it doesn’t matter whether or not this idea/practice/object is “objectively” new, but rather if it is perceived as new – this perceived newness is what determines an individual’s reaction to the innovation.
2.1.1. Types of Innovation
Two types of innovation have been defined by Bower & Christensen (1995): sustaining (or continuous) and disruptive (or discontinuous).
The first – sustaining innovation – tends to maintain a rate of improvement, providing the customer with improvements or new functionalities in the attributes they already value. Most product and service innovations as we know are sustaining (Bower & Christensen, 1995; Christensen, Bauman, Ruggles, & Sadtler, 2006)
Contrastingly, disruptive innovation introduces a very different set of attributes that customers typically value, often underperforming in one or two dimensions that are particularly important to those customers (Bower & Christensen, 1995). Backed on this theory, Nagy, Schuessler, & Dubinsky (2016) then redefine this concept as “an innovation with radical functionality, discontinuous technical standards, and/or new forms of ownership that redefine marketplace expectations”
In short, Moore (1991) describes disruptive innovation as a product that requires a change in the behaviour of the consumer (For example: a new car that requires electricity instead of gasoline). Reason why he also defends that people’s attitude toward technology adoption becomes significant when a discontinuous innovation product is introduced.
2.1.2. Diffusion of Innovation
According to Rogers (1962), diffusion is “the process by which an innovation is communicated through certain channels over time among the members of a social system”. This author highlights that this is a special type of communication, as the messages are concerned with new ideas.
However, innovation is not diffused equally, nor adopted simultaneously by all members of a social system. Instead, since the establishment of the first innovation diffusion models in the
12
70’s, that a pattern was described, suffering minor developments over time in what regards introduction of variables or generalization to different areas (Meade & Islam, 2006).
Hence, the cumulative number of innovation adopters over time is modelled as an S-shaped curve. With only few adopters in the launching stage, soon beginning to climb as more individuals adopt it, and lastly beginning to level off.
Bass (1969) suggests that the reason for innovation diffusion to take this S-shaped curve is explained by the fact that individuals’ purchase of new products are influenced by the desire of innovating (coefficient of innovation p) and the desire of imitating (coefficient of imitation q). Hence, the model describes that the probability of purchase depends linearly on the number of previous buyers.
2.1.3. Innovation-Decision Process
Yet, no diffusion of innovation occurs if there isn’t an individual or a decision-making unit to allow it. Thus, it implies a decision-making process, in this case the so called Innovation-Decision Process – which distinguishes itself from other types of decision-making processes by “the perceived newness of the innovation and the uncertainty associated with this newness” (Rogers, 1962).
Hence, the Innovation-Decision Process is described as “a series of actions and choices over time through which an individual or organization evaluates a new idea and decides whether or not to incorporate the new idea into ongoing practice” (Rogers, 1962). According to Rogers (1962), this process implies different stages:
1) Knowledge – when an individual is exposed to the innovation’s existence and gains some understanding of how it functions. Here, the mental activity is mainly cognitive (knowing).
2) Persuasion – when an individual forms a favourable/unfavourable attitude toward the innovation. At this stage, the type of thinking plays a more affective (feeling) role. Also, it entails the active search of information about the new idea, as well as the need for social reinforcement of the individual’s attitude toward it.
3) Decision – when an individual engages in activities that lead to a choice to adopt/reject the innovation.
13
5) Confirmation – when an individual seeks reinforcement of an innovation-decision already made, but he or she may reverse this previous decision if exposed to conflicting messages about the innovation.
2.1.4. Innovation Acceptance Determinants
In the previous section we’ve seen how individuals act when deciding whether or not to adopt a certain innovation. Now, we will understand why these individuals intend to accept and thus, adopt these new ideas.
Venkatesh, Morris, Davis & Davis (2003) have reviewed and discussed literature on eight prominent models on information technology acceptance, then formulated a unified model integrating elements from the eight models – Unified Theory of Acceptance and Use of Technology (UTAUT) – and subsequently, have empirically validated this unified model.
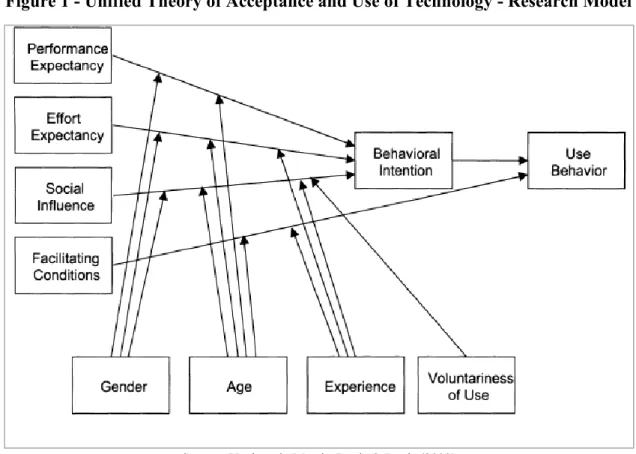
Figure 1 - Unified Theory of Acceptance and Use of Technology - Research Model
Source: Venkatesh, Morris, Davis & Davis (2003)
The UTAUT explains as much as 70 percent of the variance in intention, and within their research (Figure 1), Venkatesh et al. (2003) construe four determinants of user intention and behaviour – 1) performance expectancy, 2) effort expectancy, 3) social influence and 4) facilitating conditions –, as well as four key moderators of these same determinants – 1) gender, 2) age, 3) experience and 4) voluntariness of use – which will be described below:
14 Determinants of Intention and Behaviour:
1) Performance Expectancy – “the degree to which an individual believes that using the system will help him or her attain gains in job performance” (Venkatesh et al., 2003). This is described by the authors as the strongest determinants of intention. Nonetheless, it is expected to be moderated by gender and age, such that the effect will be more significant for men and young workers.
2) Effort Expectancy – is defined as “the degree of ease associated with the use of the system” (Venkatesh et al., 2003). This element is moderated by gender, age and experience, such that it has a stronger effect on women and older workers, whose effects decrease with experience.
3) Social Influence – is “the degree to which an individual perceives that important others believe he or she should use the new system” (Venkatesh et al., 2003). On this construct lies an explicit notion on how the individual’s behaviour is influenced by others. Hence, it is moderated across all variables (gender, age, experience and voluntariness of use) in such manner that the authors found “social influence” to be insignificant without the inclusion of the moderators.
4) Facilitating Conditions – “the degree to which and individual believes that an organizational and technical infrastructure exists to support use of the system” (Venkatesh et al., 2003). This determinant was only found significant with the moderating effects of age and experience, such that it is only salient for older workers in later stages of experience.
2.1.5. Technology Acceptance Life Cycle and Adopter Categories
While in most industries discontinuous innovations are only introduced occasionally, in high-tech industries these introductions are a constant. Thus, the Technology Acceptance Life Cycle (TALC) model becomes key to the entire sector’s approach to marketing. This model described by Moore (1991) illustrates the market penetration progress of any new technology product, throughout its useful life, as well as the types of individuals it attracts – Figure 2.
Each group differentiates from another by their unique profile defined by psychological and demographic criteria, which influences their distinctive response to a discontinuous innovation product, supports Moore (1991). And while certain authors have only distinguished two groups of early adopters (or innovators) and late adopters (or imitators) (Bass, 1969; Peres, Muller, & Mahajan, 2010), Rogers (1962) and Moore (1991) conceptualize five types of individuals.
15
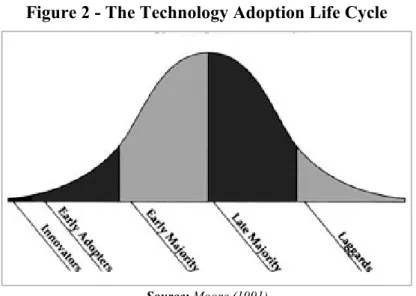
Figure 2 - The Technology Adoption Life Cycle
Source: Moore (1991)
The adopters’ curve follows a normal distribution, and it is composed by Innovators (2.5%), Early Adopters (13.5%), Early Majority (34%), Late Majority (34%), and Laggards (16%). The first two groups compose the Early Market (16%) and the remaining three constitute the Mainstream Market. (84%).
These adopter groups’ detailed descriptions can be found on Appendix I. 3.1.5.1. The High-Tech Marketing Model
The TALC comes as the very foundation of the High-Tech Marketing Model that states that the way to develop a high-tech market is to work the curve left to right (Moore, 1991), starting by the development and growth of the market, stage by stage, i.e. Innovators, then Early Adopters, and so on. This same author advocates that the endorsement of the previous group is key to develop a credible pitch and “capture” the following group of adopters, within a smooth process unfolding through all stages of TALC. Reason why it is important to keep the momentum, in order to keep a bandwagon effect that makes it natural for the next group to want to buy in (Moore, 1991).
Once a company keeps the momentum, it may also be leveraging an advantage towards the competition. By “catching the curve” first then its competition and “conquering” the Early Majority, there is a promise of virtual monopoly of the category and the “ownership” of a highly profitable market for a very long time.
3.1.5.2.The Chasm or Saddle
However, there might be some barriers to the smooth progression over the High-Tech Marketing Model. These handicaps rely on virtual gaps between groups of adopters. Moore (1991) defends these gaps as symbols for dissociation between groups, i.e. the difficulty any
16
group will have in accepting a new product if presented in the same way as it was to the group to its immediate left. Hence, the gaps may represent a chance for either winning or losing the momentum and earn or win the transition to the following stage (Moore, 1991).
Goldenberg, Libai, and Muller (2002) also build on this theory, mentioning a very common phenomenon within electronic durable goods called saddle, which they define as pattern wherein “an initial peak predates a trough of sufficient depth and duration, followed by sales that eventually exceed the initial peak”. According to them, this saddle could be explained by stockpiling, changes in technology, industry performance or macroeconomic events. However, considering the average saddle time of 5,1 years reported in this paper – based on a data set compiled by Consumer Electronics Association of 32 innovations –, it is questionable to what degree these causes explain this phenomenon.
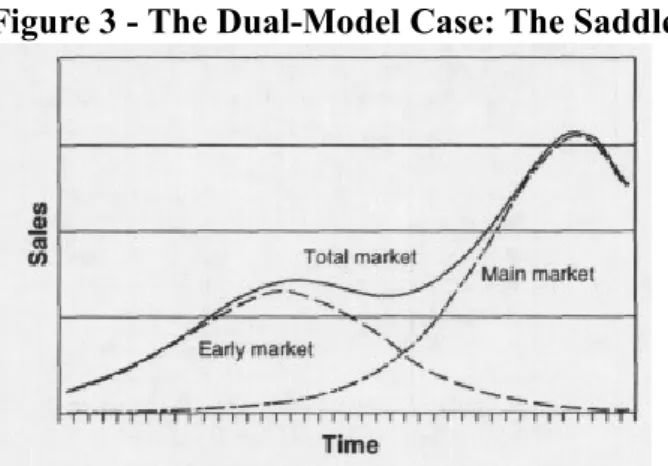
Hence, Goldenberg et al. (2002)’s model highlights that the main reason behind this event can be better explained by the dual-market phenomenon that differentiates the early market adopter from the main market adopter – that adopt at different rates. If the difference between this rates is pronounced, then a visible temporary decline of sales is exhibited at the intermediate stage between them – Figure 3.
Consistent with this theory, Moore (1991) refers a critical crack in the TALC as the chasm – between the Early Adopters and the Early Majority – that represents the major transition of a business, as it dictates whether an innovation will be playing on a mainstream market and thus, leverage the most profit out of it.
Figure 3 - The Dual-Model Case: The Saddle
Source: Goldenberg, Libai, and Muller (2002)
3.1.5.3.Crossing the Chasm
The chasm is a very distressing place for a business to stand – It entangles an increasing saturation of the Early Adopters’ market, at the same time it settles in a moment where
17
Mainstream adopters are still not comfortable to buy. If we add this constraints to the entrance of new competitors, this becomes an even less sustainable picture for the firm’s financials. Thus, to cross the chasm and get established in the mainstream market, the key is to target a very specific niche market where you can dominate from the outset, force your competitors out of the market niche, and then use it as a base for broader operations (Moore, 1991). The author adds up that the reason why most companies tend to fail this operation is within the loss of focus when confronted with the immensity of opportunity represented by a mainstream market. Moore (1991) states that once this niche market is defined, it is key to:
1. Capture a referenceable customer base that can open business to other mainstream
prospects. Seeding communication and word-of-mouth is a crucial meaning of gaining
mainstream adopters.
2. Ensure the delivery of the whole product and services needed to achieve the desired
result. Though whole product commitments might by expensive, companies should be
able to grasp the major market opportunities and leverage the product commitments that strategically reach one or two niches in the most sustainable way.
3. Achieve market leadership. Linked to their pragmatic nature, Mainstream Adopters aspire to take the right decision, reason why they aim at buying from the market leader, which inevitably and unconsciously will give them higher reliability.
Nevertheless, the main goal is to dominate the mainstream market. Thus, the key to moving beyond the initial target niche is to select strategic target market segments that, by virtue of its other connections, creates an entry point into a larger segment (Moore, 1991).
2.2.WEARABLES
“Wearable electronic devices”, “wearable technology” or even “wearables” are words that all refer to the same type of technology – “any electronics that can be worn on the body, either as an accessory or as part of material used in clothing” (Investopedia, 2017). Generally, the major feature to be considered a wearable is it connectivity – either the ability to connect to the Internet or another device, by allowing the exchange of data between both.
These devices have been gaining ground extensively in this last couple years. Examples of current wearable devices include: head-mounted displays (such as VR headsets and smart glasses); smart clothing (like biometric shirts and contactless payment jackets, etc.); smart jewellery; implantables (such as contraceptive devices or insulin pumps); and of course, smartwatches (Sung, 2015).
18
In general, smartwatches comprise some of the same features of smartphones or laptops, with an edge on other capabilities not typically seen in these first devices, such as biofeedback and tracking of physiological function. Hence, these ultimate type of innovation can have important implications in “the fields of health and medicine, fitness, aging, disabilities, education, transportation, enterprise, finance, gaming and music” (Wearable Devices, 2016)
2.2.1. Smartwatches
A smartwatch “is a wearable computing device worn on a user's wrist that offers functionality and capabilities similar to those of a smartphone” (Webopedia, 2017).
In line with the same source, these devices should work either on their own or paired with a smartphone, thus enabling to provide features like “connecting to the internet, running mobile apps, making calls, messaging via text or video, checking caller ID, accessing stock and weather updates, providing fitness monitoring capabilities, offering GPS coordinates and location directions, and more” (Webopedia, 2017).
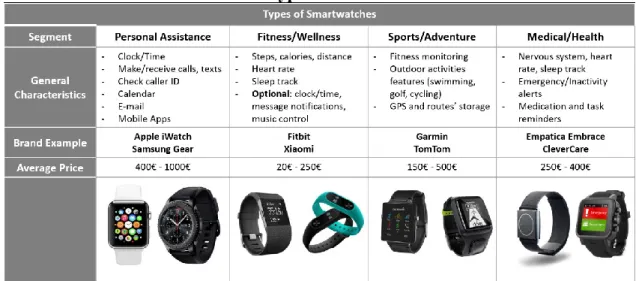
According to a study from 2015 developed by Allied Market Research, we can segment the smartwatches by application or context as: Personal Assistance; Wellness/Fitness; Sports/Adventure; and Medical/Health.
Regarding Wellness/Fitness category, it is important to mention that usually it entails a specific device that might not be a watch but rather a smart wristband, also called by “fitness tracker” or “activity tracker”. These devices’ features usually include the same as regular smartwatches in what regards fitness monitoring, but present a more discrete appearance (more similar to a wristband) and may or may not have a display.
On Table 1 are summarized the main features each segment generally provides, as well as brand/model examples attributed to each segment and respective average price.
19
Table 1 - Types of Smartwatches
Besides the already mentioned segments, there is also a rising trend for hybrid smartwatches. These devices look like classical timepieces that combine the look and functionalities of a traditional watch – usually analogic – with features available in today’s smartwatches (Maslakovic, 2017), and will be later described on “Main Players” section.
On Appendix II can be found a short section on the history and evolution of smartwatches over time.
2.2.2. The Wearables Market Worldwide
According to the International Data Corporation (IDC) Worldwide Quarterly Wearable Device Tracker, in 2016 were shipped about 102.4 million wearable devices worldwide, as new vendors have been entering the market – a 29.6% growth with regard to 2015 shipments (Table 2). Since 2014 that a rapid growth is notable in this market, especially in 2015, when shipments grew by 174% in relation to the previous year, fuelled by the growing popularity of fitness bands and the launch of Apple in 2Q15. It was also in 2015, by 4Q15, when smartwatches1
overtook Swiss wristwatches for the first time, in terms of total units: 8.1 million smartwatches were shipped, compared to 7.9 million Swiss watches, according to the latest research from Strategy Analytics (Mawston, 2016).
20
Table 2 - Wearable Shipments Worldwide Evolution
Source: IDC Worldwide Quarterly Wearable Device Tracker, March 2, 2017 & IDC Worldwide Quarterly Wearable Device Tracker, February 23, 2016
IDC breaks down the Wearables category into 5 segments: Watch; Wristband; Eyewear; Clothing; and Others. Nonetheless, we note on Table 3 that virtually all the market – 91,5% – refers to smartwatches per se (Watch + Wristband). For that reason we may analyse the smartwatches segment evolution by considering the total wearable shipments.
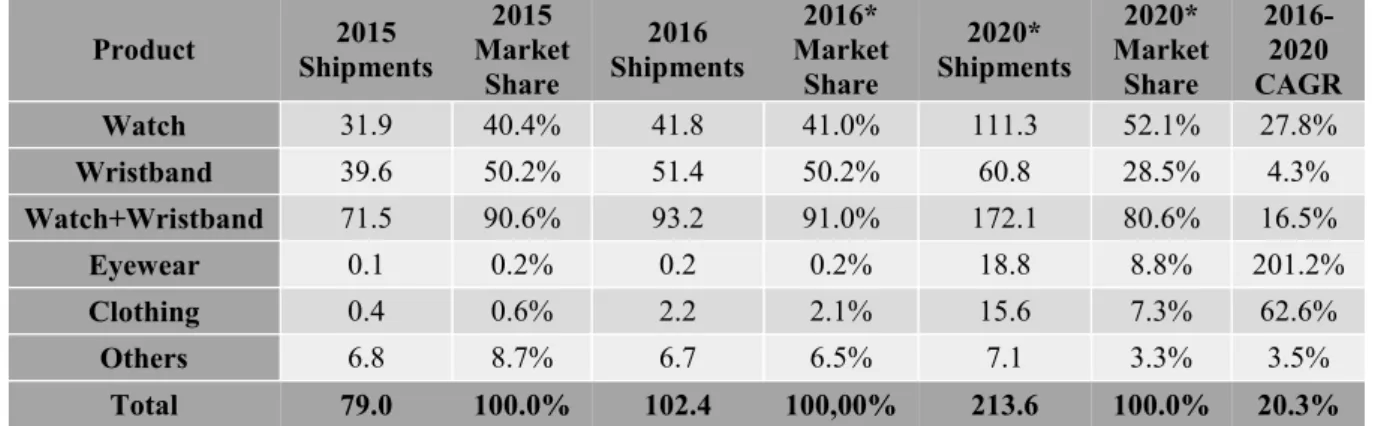
Table 3 - Top Wearable Products with Shipments, Market Share and 5-Year CAGR (shipments in millions)
Product Shipments 2015 Market 2015 Share 2016 Shipments 2016* Market Share 2020* Shipments 2020* Market Share 2016-2020 CAGR Watch 31.9 40.4% 41.8 41.0% 111.3 52.1% 27.8% Wristband 39.6 50.2% 51.4 50.2% 60.8 28.5% 4.3% Watch+Wristband 71.5 90.6% 93.2 91.0% 172.1 80.6% 16.5% Eyewear 0.1 0.2% 0.2 0.2% 18.8 8.8% 201.2% Clothing 0.4 0.6% 2.2 2.1% 15.6 7.3% 62.6% Others 6.8 8.7% 6.7 6.5% 7.1 3.3% 3.5% Total 79.0 100.0% 102.4 100,00% 213.6 100.0% 20.3%
Source: IDC Worldwide Quarterly Wearable Device Tracker, June 15, 2016 * Forecast Figures
Adding up to all this, we need however a base for comparison of this market. Thus, when we compare the smartwatch category to the total volume of wristwatches sold worldwide, we realize how niche this market is – the 42 million smartwatches (disregarding wristbands) sold in 2016 compared to the average annual sales of wristwatches of 1.2 billion units, makes this category represent about a 3,5% of total watch market. Even Swiss watches shipments 2016 represented only a 2.5% of the total market – Table 4.
Table 4 - Total Watches Market vs. Smartwatches and Swiss Watches Market (millions of units) Sales % of Total Watches Market Wristwatches Annual Sales 1.200 -
Smartwatches Sales 2016 42 3,5%
Swiss Watches Sales 2016 29 2,5%
Source: Adapted from Statistic Brand, 2016 & IDC Worldwide Quarterly Wearable Device Tracker
2014 2015 2016
Shipments (million units) 28.8 79.0 102.4
21 2.2.2.1. The Evolution of the Wearables Market
In what regards evolution trends, the worldwide wearables market has been maintaining an upward trajectory, with a higher propensity for sales during the last quarter of the year – influenced by Christmas season – followed by a usual decline in sales in 1Q.
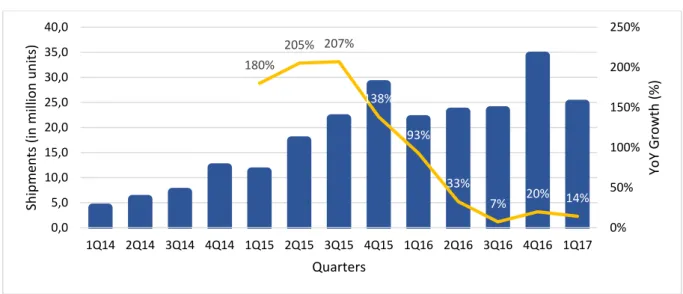
However, over 2016 and the first quarter of 2017, market growth has been decelerating as exhibited on Figure 4 – on 1Q17, YoY growth was only 14% vs. 1Q16 (93%) and 1Q15 (180%).
Figure 4 - Wearables Worldwide Shipments from 2014 to 1Q17 (in million units)
Source: Adapted from IDC Worldwide Quarterly Wearable Device Tracker
There are many reasons that may be behind this deceleration in growth of the market. One of the most probable factors that Choi & Kim (2016) mention as affecting the smartwatches’ performance are the positioning and marketing challenges that this product implies – by converging into both a technological device and a wristwatch. If on one hand, as a tech device entails a short life cycle, as a wristwatch, people are seeking values such as aesthetic pleasure, brand reputation and long-lasting durability – which leads into a value proposition conflict. And this has been representing not only a major issue when attracting consumers, but also in retaining them. According to a consumer survey made by Gartner, in December 2016, the abandonment rate of smartwatches is 29%, since people “do not find them useful, they get bored of them or they break” (Gartner, 2016). Reason why the Research Director at Gartner - Angela McIntyre defends that “to offer a compelling enough value proposition, the uses for wearable devices need to be distinct from what smartphones typically provide.”
180% 205% 207% 138% 93% 33% 7% 20% 14% 0% 50% 100% 150% 200% 250% 0,0 5,0 10,0 15,0 20,0 25,0 30,0 35,0 40,0 1Q14 2Q14 3Q14 4Q14 1Q15 2Q15 3Q15 4Q15 1Q16 2Q16 3Q16 4Q16 1Q17 Yo Y G ro w th (% ) Sh ip m en ts (in m ill ion u n its ) Quarters
22 2.2.2.2. Main Players
The next section describes the main competitors playing in this category, as summarized in
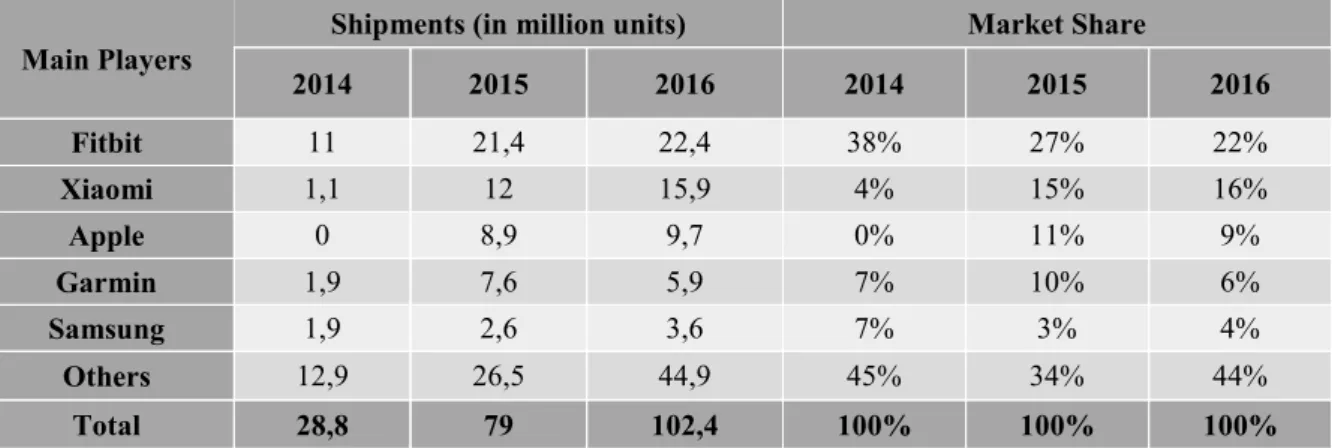
Table 5. It is notable how Fitbit has been able to maintain its market leadership over the years,
though slightly declining to the current 22% share, mainly focusing on the wristband segment. The second most important player is Xiaomi – also mainly driven by wristbands –, which has rocketed in 2015 (from 4% share in 2014) and maintained its 16% share over 2015 and 2016. Apple watch was launched in 2015, and since then it’s the 3rd biggest player in the category.
Afterwards is Garmin with 6% share and Samsung with 4%.
Besides the main players stated, there are many other brands producing this type of devices. Amongst them, is important to highlight the luxury and designer brands that generally play in this market with a specific type of smartwatch already mentioned in this study – the hybrids – which allow the combination of the traditional analogue design with simple smartwatch features that upgrade timeless pieces to today’s reality. This segment represents already 7% of the total smartwatch category and is expected to grow 77%, by the end of 2017.
More detailed information on the main players can be found in Appendix III.
Table 5 - Wearables Worldwide Main Players' Shipments and Market Shares Main Players Shipments (in million units) Market Share
2014 2015 2016 2014 2015 2016 Fitbit 11 21,4 22,4 38% 27% 22% Xiaomi 1,1 12 15,9 4% 15% 16% Apple 0 8,9 9,7 0% 11% 9% Garmin 1,9 7,6 5,9 7% 10% 6% Samsung 1,9 2,6 3,6 7% 3% 4% Others 12,9 26,5 44,9 45% 34% 44% Total 28,8 79 102,4 100% 100% 100%
Source: Adapted from IDC Worldwide Quarterly Wearable Device Tracker
2.2.2.3. The Future of Wearables
IDC’s forecasts refer that the wearables market will experience a CAGR of 20,3%, reaching 213.6 million units shipped by 2020 (Table 3). Looking into segments, Watch + Wristbands will continue to grow popularity, though losing share within the market and giving space to the growth of other wearables – particularly Eyewear that is expected to deliver new capabilities and experiences accompanied by a CAGR or 201,2%.
Though smartwatches are expected to grow at a lower CAGR (16,5%) than total wearables category, they are foreseen to reach 172.1 million shipped devices by 2020. This growth will
23
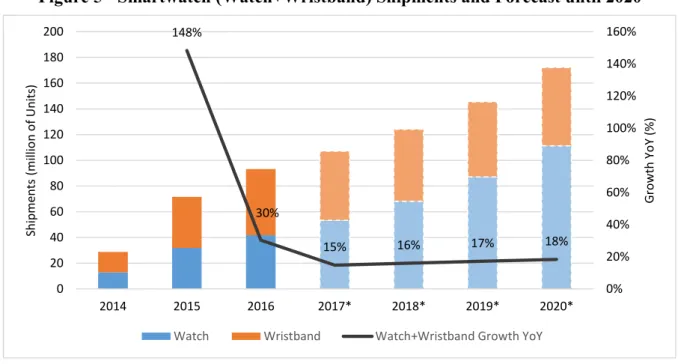
be particularly driven by Watches – which are expected to increase from 41% share to 52,1% of total wearables shipments in 2020 (Table 3 and Figure 5) – but not from all watches. According to IDC, future growth will come from basic watches that provide some sort of fitness/sleep tracking with no need for further sophistication in terms of third party applications. Also, Counterpoint Technology Market Research (2017) estimates hybrids to grow 77%, by 2017, taking the penetration to 12% of the total smartwatch category in volume. Hence, this type of development in the market will be mainly compelled by luxury/designer brands (such as Fossil) and health/fitness companies (like Fitbit).
On the other hand, Wristbands that once dominated the market, are expected to lose share in the segment, from 51,4% to an expected 28,5% by 2020, as well as a CAGR of 4,3%, reaching 60.8 million devices sold in 2020 (Table 3 and Figure 5). IDC expects this segment to be driven by low cost vendors like Xiaomi and giants like Fitbit, though its dominance is being challenged by watches as many vendors become incorporating basic fitness features into their products.
Figure 5 - Smartwatch (Watch+Wristband) Shipments and Forecast until 2020
Source: Adapted from IDC Worldwide Quarterly Wearable Device Tracker *Forecast Values
To sum up, considering the forecasted volume for 2020 of smartwatches (disregarding wristbands) of 113.3 million units, and that the annual sales of total wristwatches remain at around 1.2 billion, it is estimated that by that year smartwatches value about 9,2% of the wristwatch market vs. the actual 3.5%.
148% 30% 15% 16% 17% 18% 0% 20% 40% 60% 80% 100% 120% 140% 160% 0 20 40 60 80 100 120 140 160 180 200 2014 2015 2016 2017* 2018* 2019* 2020* G ro w th Y o Y (% ) Sh ip me n ts ( mil lio n o f Un its )
24 2.2.3. Smartwatches Market in Portugal
In Portugal, in 2015, were sold 117.000 wearable devices, from which 70% were wristbands, growing at 256% vs. YA, and the remaining 30% were smartwatches, growing 334% vs. 2014. According to IDC’s European Research Director Francisco Jerónimo (2016), “the Portuguese wearables market is still very incipient” as wearables sales in 2015 have only represented about 4% of total smartphones sales. These low values can be explained by the limited portfolio offer as well as consumer unawareness of these devices features.
The same institute also forecasts an increase of the market value by 2016 – predicting wearable sales in Portugal should reach 170.000 units, about 46% growth vs. 2015. And despite smartwatches’ low share vs. wristbands, IDC estimates a huge potential on this segment of about 68% growth vs. 2015. According to them, Apple was estimated to become market leader in Portugal by 2016, with 24% market share.
25
CHAPTER 3 – METHODOLOGY 3.1. Research Approach and Design
There are three most often referred research approaches in the research methods’ literatures, classified as: exploratory, descriptive and explanatory (Saunders, Lewis, & Thornhil, 2009). The exploratory research aims at finding new ideas and perceptions regarding a phenomena, providing a better comprehension of the topic. It is characterized by its flexibility and versatility, since it doesn’t require formal research procedures or protocol, and it is often the starting point of the entire research conception (Malhotra, 2006). According to Saunders et al. (2009) the main ways of conducting this type of research comprise the search of literature, interviews to experts in the subject and conduction of focus groups.
Descriptive research’s main goal is to describe something – usually, characteristics or functions of a market. Unlike the exploratory, the descriptive research is defined by a clear formulation of the problem, as well as specific hypothesis and the need of detailed information. It is usually adopted for market studies that describe the market size, consumer profile and purchase power, as well as sales analysis studies, image studies, etc. (Malhotra, 2006). This kind of study can be an extension of, or a precursor to, a part of exploratory research (Saunders et al., 2009), and entails the use of secondary data, panels and observational data (Malhotra, 2006).
Lastly, the explanatory research is used to determine cause-effect relationship evidences, by manipulating variables through experiments. Hence, just as the descriptive, the explanatory research entails a planned and structured conception (Malhotra, 2006).
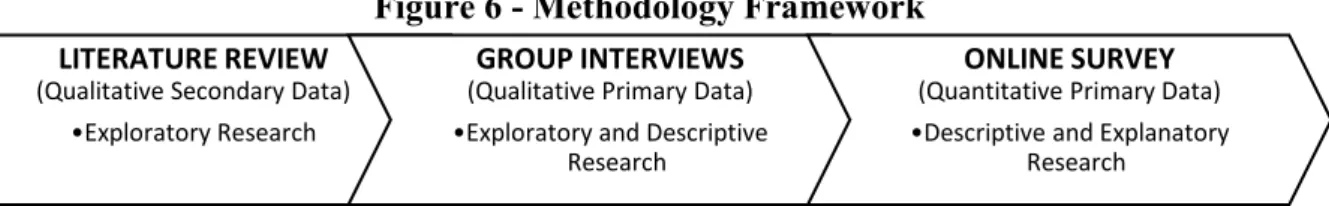
Since this research aims at studying the actual context of smartwatches in the Portuguese market, as well as its expected evolution which, logically, complies with some level of uncertainty, the three purposes were applied: the exploratory research, the descriptive research and the explanatory research. Furthermore, in order to comply with the each of the referred purposes, the following methods were used: Literature Review, Group Interviews and Online Survey.
Figure 6 - Methodology Framework LITERATURE REVIEW
(Qualitative Secondary Data) •Exploratory Research
GROUP INTERVIEWS
(Qualitative Primary Data) •Exploratory and Descriptive
Research
ONLINE SURVEY
(Quantitative Primary Data) •Descriptive and Explanatory
26 3.1.1. Literature Review: Exploratory Research
The literature review was used as a preliminary search to help generate and refine research ideas, as well as critically review the topic (Saunders et al., 2009).
The collection of this data comprised two central topics – on one hand, a theoretical framework on innovation, and on another hand, general and detailed information regarding the wearables (most specifically smartwatches) market. This information was collected from published data, such as various authors’ academic articles from respectable journals, and online published data, used to complement and better understand the previously approached authors.
3.1.2. Group Interviews: Exploratory and Descriptive Research
Afterwards, a non-standardised one-to-many group interview was conducted. This methodology was selected since it allows the opportunity to probe answers from interviewees, enabling discussions into areas that may have not been previously considered but that are significant for the research understanding, and that help addressing the research questions and objectives (Saunders et al., 2009).
Thus, two group interviews were conducted with two different groups of people: one composed by three smartwatch owners, and another composed by four smartwatch non-owners. Both were demographically heterogenic groups, comprised by both genders, different ages and by both satisfied/aspiring smartwatch owners and well as unsatisfied/non-aspiring smartwatch owners. Both interviews followed a similar structure, consisting of a first introductory part aiming at describing each participants’ profile, followed by a section focused on the decision-process as it follows: (1) identification of the need; (2) gathering of information; (3) identifying alternatives; (4) weighting evidences, based on the determinants of intention and behaviour described by Venkatesh et al. (2003); (5) taking action; (6) reviewing the decision – The complete interview script as well as a summary of main conclusions taken from them can be found on Appendix IV. Furthermore, the main conclusions on this part of the research will be later discussed in Chapter 4.
3.1.3. Online Survey: Descriptive and Explanatory Research
From the literature review and the semi-structured group interviews, arose the structured questionnaire which was deployed via the online platform Qualtrics. The advantages of this online data collection relies on its agility – allowing the respondents to participate at the convenience of their desired time and place – and rapidity of answers. However, it entails as well some limitations, as the non-representativeness of all the population, and the difficulty in verifying if participants are actually answering correctly to the survey (Malhotra, 2006). The
27
quantitative research was conveyed by applying the research instruments that will be described below.
3.1.3.1.Population of the Study
Population is defined by Malhotra (1999) as the aggregate of all the elements that share various common set of characteristics, comprising the universe for the purpose of the research problem. Thus, the population of this research comprises all Portuguese individuals, of both genders, and of all ages, that either own or not a smartwatch.
3.1.3.2.Sample of the Study
Malhotra (1999) describes sample as the subgroup of the elements of the population selected to participate in a study. According to Saunders et al. (2009), for a ten million people population (the total rough population of Portugal) and a confidence level of 95%, sample should be around 384 participants. Thus, for this study, due to financial and time constrains, a non-probabilistic convenience sample was used, aimed at a minimum of 350 respondents.
3.1.3.3.The Survey
As previously stated, an online self-administered questionnaire, designed and distributed through Qualtrics platform, was selected as method for data collection. The main reasons behind this decision rely on financial and time constraints, but also on the benefits it allows, such as design efficacy, easiness of diffusion and data extraction. A pre-test was conducted before the launch of the final questionnaire, in order to identify and eliminate any potential problems (Malhotra, 2006). The survey was then launched from the 21st of June, 2017 until the
4th of July, 2017, and was distributed across social network platforms (Facebook and Linkedin)
and by e-mail.
The questionnaire was composed by eight sections. The first comprised questions designed to appraise respondents’ unaided perceptions and knowledge about smartwatches. After this, participants were exposed to a short definition of smartwatch and a summary of main existing segments in the market and its respective characteristics. Based on this, were asked to estimate the average price of each segment smartwatch. On the third section, the real average price was presented to participants, followed by a series of questions on their perceptions about the product and price. The fourth section was composed by a filter question that split the sample into two groups (the smartwatch owners and the non-owners).
From this point beyond, survey flow split into section five (only aimed at smartwatch owners) and section six (aimed at non-owners). Section five (owners), was designed to understand all the steps in the decision-making process, such as the smartwatch brand, search of information,
28
desired and actual context of use, desired and actually used features, critical decision factors, as well as a subsection composed by Likert scaled questions aimed at evaluating Venkatesh’s constructs of performance expectancy, effort expectancy, social influence and facilitating conditions. Section six (non-owners) intended to understand respondents smartwatch purchase intentions, as well as a subsection similar to the one used on section six, used to comprehend the same Venkatesh’s constructs and how they affect consumer purchase intentions, from the point of view of a non-owner.
Finally, the seventh section is aimed again at all respondents and is designed to evaluate participants’ perceptions on the main problems they find in smartwatches (price, features, design, value, none). And lastly, section eight provides the definition of respondent’s profile based on socio-demographic questions. The detailed questionnaire can be found on Appendix
V.
3.1.3.4.The Measures
The measures considered and analysed in this research were based on constructs developed in previous studies and past literature, afterwards adapted to fit this study.
Hence, two multi-item scales were used: one adapted from Venkatesh et al. (2003), measuring the determinants of intention and behaviour; and another adapted from Rogers (1962), to measure the adopters categories, in particular, to distinguish early adopters from later adopters. Regarding the adopter categories scale, Rogers (1962) summarizes the immense research literature about variables related to innovativeness in a total of 27 generalizations that distinguish Early Market adopters from Mainstream (or Late) Market adopters. And from these 27 generalizations (Appendix VI), in this dissertation, we will focus on the 13 ones that comply with two conditions: 1) Having a considerable number of research studies on the generalization (≥ 20 supporting studies); 2) Most of the research studies must be supporting the generalization (≥70% of research studies supporting the generalization). Thus, the refined generalizations that describe the Early Adopters, and the respective used scale, can be found in Appendix VI. Within these two previously mentioned scales, questions were measured using Likert rating scale, where participants indicated their degree of concordance or discordance with each statement of a series (Malhotra, 2006), on a five-point scale (1 – Strongly Disagree, 2 – Somewhat Disagree, 3 – Neither Agree, Neither Disagree, 4 – Somewhat Agree, 5 – Strongly Agree). The multi-item scales and respective constructs can be found on Appendix VI.
29
CHAPTER 4 – RESULT ANALYSIS 4.1. Qualitative Research – Interviews
As already mentioned, a series of two group interviews were conducted which main results can be found on Appendix IV. Nonetheless, there were some more relevant insights which will be highlighted in this section. Thus, from the group interviews, there were three main messages extracted that had not been hypothesised before and which served as important topics to be tested in the quantitative research. They were:
1) The negative impact of social influence on smartwatch users – As smartwatch users mentioned to sometimes feel stigmatized by some of their peers, in what regards the spent amount of money on the device. Carolina stated “People with whom I talked to, told me I was crazy to be willing to spend 800€ on this.”, whereas Fernando stated “Sometimes if people comment it negatively, mostly on how much it cost, etc., I see it as an evidence of envy for it.”
2) The problem in battery life – Since smartwatches derive from watches, which are timepieces with a considerable battery life, it revealed to be an inherent characteristic to technology difficult for both owners and potential smartwatch owners to accept in this category of devices. Thus, for some of the interviewees, longer battery life was expressed as a crucial feature to take into account, as mentioned by João (ex-owner) “While they don’t fix the battery for lasting at least 2 weeks, I won’t buy it. And if it was be possible to charge it wirelessly, it would be perfect!”.
3) The value perception of non-owners – As many of them don’t seem to perceive an added-value on smartwatches vs. their smartphone. In reality, some of the interviewees agreed on the fact that they didn’t want to become too attached to technology on their wrist, for the constant attention to notifications it implies. Ana mentioned “A watch is to see what time it is, and for all the rest I use my cell phone”, whereas Mafalda referred “I wouldn’t like to be having lunch right now and receiving e-mails on my wrist”.
4.2. Quantitative Research 4.2.1. Preliminary Analysis
4.2.1.1. Data Collection and Analysis
The online survey was distributed and available online from 21st of June, 2017 until the 4th of
July, 2017, collecting a sample of 326 respondents. Across the survey, a set of three control questions were used in order to avoid response bias and filter honest respondents. Thus, after
30
excluding all the respondents who didn’t pass the control tests, only 258 were considered valid and used for analysis of this study.
In order to gather insights and understand this research’s problem statement, the collected data was then analysed with the statistical software IBM SPSS Statistics 22.
4.2.1.2. Sample Characterization
In order to accurately portray the profile of the respondents of this study, a set of socio-demographic questions were made, leading to the following sample characterization:
From the 258 analysed individuals, 46,1% are men and 53,9% are women. Regarding age, the largest answering group is aged between [18-24] years old (45%), followed by [45-54] y.o. (20,9%). In what regards occupation, the majority sample is composed by employed people (57,4%), followed by students (26%). Concerning academic qualifications, half of the respondents stated they have obtained a Bachelor degree (50%), followed by 24,4% who have attained a High School degree and 24% who have a Master degree. If we look into marital status, 56,6% of the respondents are single and 38,8% married or living with partner. Regarding household size and income, 31% of respondents’ household is composed by four people, followed by 24% composed by three people, and the majority of the sample (51,9%) has a monthly net income of [1001€-3000€]. Moreover, from this sample only 13,2% own a smartwatch.
Since a crucial part of this research implied the distinction of two different adopter categories – the Early Market Adopters and the Mainstream Market Adopters –, a K-Mean Cluster Analysis was done in order to extract these two categories of adopters. This analysis took as base the variables described and acknowledged previously in the literature – Appendix VI,
Table 10.
Thus, two clusters emerged – one (C1) composed by 113 cases and another (C2) composed by 145 cases. After analysing the final cluster centers (Appendix VII - Table 11) and each cluster’s means (Appendix VII – Table 14), it was possible to understand that C2 exhibited a clear Early Adopter profile, according to Rogers (1962), with higher levels of agreement on all considered variables: “first buying innovation” (µC2=3,23 vs. µC1=1,68) ; “entrepreneurial
spirit” (µC2=4,10 vs. µC1=3,01) ; “comfortable with change” (µC2=4,38 vs. µC1=3,63) ;
“comfortable with uncertainty” (µC2=3,49 vs. µC1=2,65); “faith over science (reverse scale)”
(µC2=1,92 vs. µC1=2,42); “leadership aspiration” (µC2=4,18 vs. µC1=2,96); “money aspiration”
31
networks” (µC2=4,39 vs. µC1=3,90); “travel” (µC2=3,94 vs. µC1=2,82); “innovation awareness”
(µC2=4,05 vs. µC1=2,72); “recommendation to friends” (µC2=3,61 vs. µC1=1,86); “highest
academic qualification” (µC2=3,21 vs. µC1=2,79).
Hence, cluster C2 was considered the Early Market Adopter (EMA) cluster, with 56,2% of the sample included in it, and cluster C1 the Mainstream Market Adopters (MMA) with 43,7% of respondents. Except for the variable “Education importance” that exhibited a sig.=0.709, all variables used to define the clusters revealed to be statistically significant (Appendix VII -
Table 13) with sig. = 0.000 < 0.05, which validates the model and supports the relevant existing
differences between groups.
Afterwards, Crosstabs and Chi-Square Tests for Independence were ran, in order to characterize the research sample by distinguishing adopter categories. From this analysis, it is notable how some moderators are statistically significant for the definition of each profile, such as: gender, (asympt. sig.=0.000 < 0.05), with 70,6% of men being EMA and only 43,9% of women representing the same adopter category; highest academic qualification, (asympt sig.= 0.000 < 0.05), with 53,5% of Bachelor degree and 79% of Master degree respondents being EMA, and 61,9% of High-School degree respondents being MMA; people living in household (asympt. sig.=0.002 < 0.05), exhibiting that the less individuals live in the household, the more respondents’ answers resemble the EMA profile (ex.: 82,5% of single living respondents are EMA, and 75% of the families > 5 people represent and MMA profile); household’s disposable income (asympt. sig =0.034 < 0.05), demonstrating that the higher the income, the more the individuals belong to the EMA category (ex.: 80% of households with a monthly income above 5000€ are EMA, whereas 60% of households earning bellow 500€ are MMA); all the remaining socio-demographic variables revealed to be independent from adopter categories.
4.2.1.4. Data Reliability
Reliability means that a measure should consistently reflect the construct that it is measuring (Field, 2005). Thus, in order to determine data reliability, the Cronbach Alpha test was applied, but not without first taking into account the items with a reverse scale, that were reversed before applying the test.
32
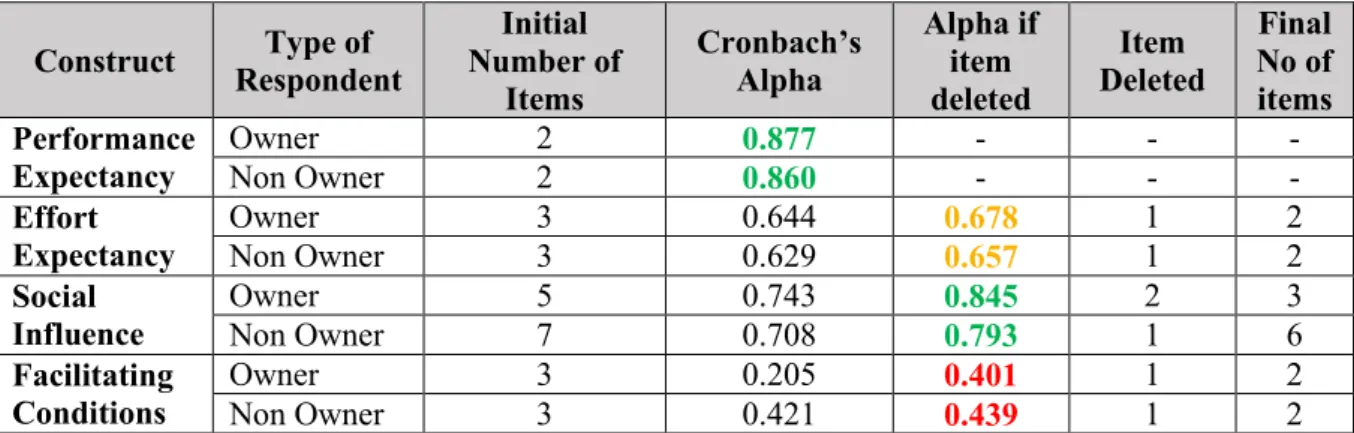
Table 6 - Data Reliability Test
Construct Respondent Type of
Initial Number of Items Cronbach’s Alpha Alpha if item deleted Item Deleted Final No of items Performance Expectancy Owner 2 0.877 - - - Non Owner 2 0.860 - - - Effort Expectancy Owner 3 0.644 0.678 1 2 Non Owner 3 0.629 0.657 1 2 Social Influence Owner 5 0.743 0.845 2 3 Non Owner 7 0.708 0.793 1 6 Facilitating Conditions Owner 3 0.205 0.401 1 2 Non Owner 3 0.421 0.439 1 2
As mentioned before, the four scales were applied in two different moments to each respondent type – the smartwatch owners and non-owners – and so, the Cronbach Reliability test was then applied for all the scales and two different respondent types. Moreover, some adjustment were made by deleting items in some constructs in order to enhance their alpha – Table 6.
Thus – and according to DeVellis (1991), that considers Cronbach’s Alpha coefficient: below 0.60 as unacceptable; between 0.65 and 0.70 as minimally acceptable; between 0.70 and 0.80 as good; and finally, above 0.80 as very good –, it is possible to conclude that Performance Expectancy and Social Influence (in both respondent types) are constructs with a very good internal consistency – with alphas above 0.793 – whereas Effort Expectancy exhibits the minimally acceptable reliability – 0.678 and 0.657 – and lastly, Facilitating Conditions reveal totally unacceptable coefficients – 0.401 and 0.439.
4.2.1.5. Principal Component Analysis (PCA)
In order to assess the dimensionality of the used scales, a Principal Component Analysis (PCA) was performed. According to Field (2005), this analysis is concerned with establishing which linear components exist within the data and how a particular variable might contribute to that component. However, as PCA’s reliability is dependent on sample size, it is important to consider this criteria. Comrey and Lee (1992) suggest a class of 300 as a good sample size, 100 as poor and 1000 as excellent, whereas Nunnally (1978) recommended having 10 times as many participants as variables. Taking this into account, and considering two scales were applied to two different samples – smartwatch owners and non-owners – it is possible to conclude that reliability levels for the PCA to the smartwatch owners sample of 34 respondents might not be as reliable as the PCA to the smartwatch non-owners sample of 224 respondents.
33
Therefore, the PCA was ran for both samples (owner and non-owners), taking only into account the reliable items derived from the Cronbach Alpha test.
Smartwatch Owners Scale
Within the smartwatch owners sample, the PCA analysis revealed the existence of four components with Eigenvalues higher than one, that explained 82,28% of the total variance (Appendix VII, Table 16). Thus, the number of components matched the number of constructs we were taking into account. When looking into the Rotated Component Matrix (Appendix
VII, Table 17), we see that all variables correlated highly with the respective factor component
it was defined previously, except for “system compatibility with my lifestyle” that should have a higher correlation with Facilitating Conditions than Effort Expectancy. This, also explains the previous results on the Cronbach’s alpha test on the low reliability for this construct.
The KMO Measure of Sampling Adequacy confirmed that the reliability for this sample wasn’t indeed perfect. Thus, with a score of 0.577 on the KMO, sample adequacy revealed to be normal – according to Hutcheson and Sofroniou (1999) that considered KMO values: between 0.5 and 0.7 as normal; between 0.7 and 0.8 as good; between 0.8 and 0.9 as great; and all values above 0.9 as superb. Moreover, when considering the Bartlett’s Test of Sphericity, it revealed a sig. of 0.000 < p-value = 0.05, certifying that the factorability of the correlation matrix is suitable – see Appendix VII, Table 15.
Smartwatch Non-Owners Scale
When looking into the smartwatch non-owners sample, the PCA analysis exhibits three components with Eigenvalues higher than one, that explain 56,82% of the total variance (Appendix VII, Table 19). In this case, the Rotated Component Matrix (Appendix VII, Table
20) exhibits that the items related with Social Influence and Effort Expectancy are all
respectively correlated with each factor. However, there is only another factor that aggregated the items related with both Performance Expectancy and Facilitating Conditions – meaning this two constructs aren’t significantly distinct from each other to this sample of respondents. This sample scored 0.716 on the KMO test, confirming its good adequacy. Furthermore, the Bartlett’s Test also revealed the factorability of the correlation matrix as suitable, with a sig. = 0.000, above p-value = 0.05 – see Appendix VII, Table 18.
In conclusion, from the PCA, factor scores were extracted and saved as variables in the form of regressions, with the coefficients exhibited on Appendix VII, Table 17 and Table 20. From
34
this point on, we considered for further analysis the following constructs as determinants for behaviour and intention:
- Smartwatch Owners sample: Performance Expectancy; Effort Expectancy; Social Influence; Facilitating Conditions.
- Smartwatch Non-Owners sample: Performance Expectancy; Effort Expectancy; Social Influence; (withdrawing Facilitating Conditions as a non-significant construct for this sample, and considering its items within Performance Expectancy factor).
4.2.2. In-depth Analysis
In the following section, research questions will be statistically tested, by analysing the survey results and combining them with key insights collected both in the literature review and group interviews.
RQ1: What type of innovation are smartwatches?
Backed on the concept of disruptive innovation by Bower & Christensen (1995) and Nagy et al. (2006), which is the starting point for the further development of the main defended concepts throughout this research – such as the TALC and Chasm –, it is important to understand whether consumers consider this product as a discontinuous innovation – meaning, an innovation with a radical functionality vs. similar to other existing products in the market.
By analysing the questions on a Likert-scale (1- Strongly Disagree and 5 – Strongly Agree) “Smartwatches imply a radical change in consumer behaviour vs. regular wristwatches” and “Smartwatches imply a radical change in consumer behaviour vs. smartphones”, we realize the following results: µwristwatches= 3,17 with a negative skewness of -0.166; µsmartphones= 2,58 with a
positive skewness of 0.185. Thus, this means for respondents, a smartwatch when compared to a smartphone is not considered as disruptive, whereas when compared to a regular wristwatch the opposite happens, rather being considered as discontinuous innovation. Hence, for this devices the TALC becomes a key model to take into consideration when forecasting the future. RQ2: At what stage of the product lifecycle are smartwatches at?
To take conclusions for this research questions, we should start by understanding how many smartwatch owners are there in Portugal. It is important to acknowledge the fact that the survey sample may be biased and not representative of Portuguese consumers. Nonetheless, if we take it as good data, results indicate that about 13.2% of the sample owns a smartwatch, from which 70.6% exhibited an Early Market Adopter profile (sig=0.007<0.05). Thus, taking into account many of the authors who described the TALC Model and who defended that the Early Market