eISSN: 2171-9292 http://dx.doi.org/10.5424/sjar/2015134-8176 Instituto Nacional de Investigación y Tecnología Agraria y Alimentaria (INIA)
SHORT COMMUNICATION OPEN ACCESS
Impact of the intensity of milk production on ammonia and
greenhouse gas emissions in Portuguese cattle farms
José Pereira1,2 and Henrique Trindade2
1 Polytechnic Institute of Viseu, Agrarian School of Viseu, CI&DETS, Quinta da Alagoa, 3500-606 Viseu, Portugal. 2 University of Trás-os-Montes and Alto Douro (UTAD), Centre for the Research and Technology of Agro-Environmental
and Biological Sciences (CITAB), Quinta de Prados, 5000-801 Vila Real, Portugal
Abstract
The aim of this study was evaluate the relationship between the intensity of milk production for a wide range of Portuguese commercial cattle farms and NH3 and greenhouse gas (GHG) emissions from manure management and enteric fermentation. A
survey was carried out at 1471 commercial dairy cattle farms (Holstein-Friesian) and the NH3, N2O and CH4 emissions at each stage
of manure management were estimated as well as CH4 losses from enteric fermentation. Gaseous emissions were estimated by a
mass flow approach and following the recommendations of IPCC guidelines. The manure management and enteric fermentation in a typical Portuguese cattle farm contributes with 7.5±0.15 g N/L milk produced as NH3 and 1.2±0.22 kg CO2 equivalent per litre of
milk as GHG. Increasing milk production will significantly reduce NH3 and GHG emissions per litre of milk produced. It can be
concluded that a win-win strategy for reducing NH3 and GHG emissions from dairy cattle farms will be the increase of milk
produc-tion on these farms. This goal can be achieved by implementing animal breeding programs and improving feed efficiency in order to increase productivity.
Additional key words: dairy cattle; enteric fermentation; gaseous emissions; manure management.
Abbreviations used: CP (crude protein); GHG (greenhouse gas); LU (livestock unit); M (annual milk production).
Citation: Pereira, J.; Trindade, H. (2015). Short communication: Impact of the intensity of milk production on ammonia and greenhouse gas emissions in Portuguese cattle farms. Spanish Journal of Agricultural Research, Volume 13, Issue 4, e06SC05, 7 pages. http://dx.doi.org/10.5424/sjar/2015134-8176.
Received: 18 Jun 2015. Accepted: 11 Nov 2015
Copyright © 2015 INIA. This is an open access article distributed under the terms of the Creative Commons Attribution-Non Commercial (by-nc) Spain 3.0 Licence, which permits unrestricted use, distribution, and reproduction in any medium, provided the original work is properly cited.
Funding: European Union Funds (COST Action FA1302); FCT-Portuguese Foundation for Science and Technology (project UID/AGR/04033/2013).
Competing interests: The authors have declared that no competing interests exist. Correspondence should be addressed to José Pereira: jlpereira@esav.ipv.pt
The intensive cattle production has led to severe environmental problems, such as ammonia (NH3) and greenhouse gas (GHG) emissions, due to the large amounts of slurry (liquid manure) resulting from this activity (Hristov et al., 2011, 2013; Montes et al., 2013). The most common liquid manure handling systems for cows in Europe are scraping and flushing systems where a mixture of urine, faeces and litter materials (i.e., cat-tle slurry) are drained together from housing to manure storage facilities (Pereira & Trindade, 2014). Then, the cattle slurry stored is applied to land as organic ferti-liser. Gaseous emissions are related with animal health (e.g., mucous membrane irritation and pulmonary dis-eases related with NH3 exposure), nutrition (e.g., meth-ane (CH4) losses from rumen and N excretion) and environmental (e.g., air quality, atmospheric deposition,
global climate change) issues and occur at all stages of animal manure management, namely housing, storage and soil application (Sommer et al., 2006; Hristov et
al., 2011, 2013; Montes et al., 2013; Beccaccia et al.,
2015; Hou et al., 2015). Consequently, mitigation meas-ures have been proposed in Northern Europe countries, but few data are available for Southern Europe coun-tries. Also, recent Portuguese legislation (NREAP, 2013) regarding manure management refer to the use of the best available techniques by farms but their inclusion at one stage of manure management could lead to pol-lution swapping between NH3 and nitric oxide (NO)/ nitrous oxide (N2O) emissions and nitrate leaching. Hence, further practical solutions to reduce gaseous emissions from manure management are needed in order to achieve reduction targets.
spreading and crop growing period). The gaseous N losses were estimated by Eq. [1]-[4].
EHousing = NHousing × EFNH3 [1] EStorage = (NHousing – EHousing) × (EFNH3 – EN20) [2] ELand_spreading = (NStorage – EStorage) × (EFNH3 – EFN20) [3] ECrop_growing= (NLand_spreading – ELand_spreading) × EFN20 [4] where, EHousing, EStorage, ELand_spreading, and ECrop_growing are the amounts of gaseous losses at each stage of manure management considering proper emission factors for each gas (EFNH3, EFN2O) and stage (Table 1). NHousing, NStorage, NLand_spreading, and NCrop_growing are the N contents available for gaseous losses at each stage of manure management.
The emission factors employed in our study were selected following the recommendations of IPCC and EMEP-EEA for the Portuguese conditions (Table 1). The annual N excretion for dairy cows was estimated by Eq. [5], as a function of annual milk production and crude protein (CP) supplied in the diet (Vérité & De-laby, 1998). The default N excretion for non dairy cows was 50 kg N/yr as recommended by EMEP-EEA (2013). NExcreted= 9.635CP-39.114
(
)
+ +(
9.635CP-39.114)
× 0.005 M − 6000(
)
100 ⎡ ⎣ ⎢ ⎢ ⎤ ⎦ ⎥ ⎥ [5]where, NExcreted was the annual N excretion for dairy cows (in kg N/yr), CP was the percentage of crude protein in diet (16%), and M was the annual milk pro-duction (in L/yr).
In order to assess gaseous N losses using the emis-sion factors described in Table 1, the NH4+-N content in excreta deposited in housing was 29% of total N excreted (Pereira et al., 2010) and the mineral N con-tent in cattle slurry was 50% of total N applied at soil spreading (Trindade et al., 2009; Pereira et al., 2016). Considering Portuguese legislation (NREAP, 2013) regarding animal manure management, it was assumed a 30% reduction in NH3 emissions at land spreading, since the untreated cattle slurry was subjected to broad-cast application and incorporation by plough within 12 h (EMEP-EEA, 2013).
The CH4 emissions from manure management of all cattle, as well as emissions from enteric fermentation of the non dairy cows, were estimated by Tier 1 ap-Previous studies (Casey & Holden, 2005; Fangueiro
et al., 2008; Gerber et al., 2011) reported that, for a
proper comparison between different farm intensities or milking systems, the environmental impacts gener-ated should be expressed in function of production output (e.g., milk produced) together with per animal head or per hectare. The aim of this study was to evaluate the relationship between intensity of milk production for a wide range of Portuguese commercial cattle farms and NH3 and GHG emissions from manure management and enteric fermentation.
A survey was carried out at 1471 commercial dairy cattle farms (Holstein-Friesian) each with more than 20 dairy cows. The farms were located at Northwest Portugal, being the main dairy production area of the country (about 50% of the national milk production). Each farm was visited and a questionnaire was com-pleted. Data for the whole year were collected and included the following parameters: cattle numbers and types (dairy cows, bulls, heifers and calves), milk pro-duction (liquid milk) and diets supplied (dry matter intake of concentrates, forages and crude protein). The dairy cattle buildings were freestall-type housing, naturally ventilated and equipped with solid and slatted concrete floors. The slurry was stored in concrete slurry pits, with a mean capacity of 7.6 m3 per livestock unit (LU), enough for a 5 month storage period. Animal numbers were expressed in Portuguese LUs, consider-ing that 1 LU was an adult animal (>24 months age and >500 kg liveweight) of the bovine species or a dairy cow with <7000 L/yr of milk produced. A dairy cow with ≥7000 L/yr of milk produced was 1.2 LU. A heifer was 0.6 LU (6-24 months age) and calves (<6 months age) were 0.4 LU.
The manure management system for the studied farms was the following: excreta was removed daily from concrete floors of housing as slurry (liquid sys-tem) and then stored outside buildings in concrete slurry pits. The dairy system is based on zero-grazing with two forage crops per year: maize silage and a winter crop (i.e., ryegrass). All untreated slurry of each dairy farm was applied (mean rate of 95 m3/ha/yr or 266 kg total N/ha/yr) by traditional broadcast at the sowing of each forage crop as organic fertiliser source. The inputs of mineral fertilisers in dairy farms were not included in the present study. More details of the dairy farming system can be found in Fangueiro et al. (2008), Pereira et al. (2010, 2016) and Brito et al. (2011).
At each dairy farm, NH3 and N2O emissions were estimated following a mass-flow approach as described by Webb & Misselbrook (2004) and Dämmgen & Webb (2006), considering the N gaseous losses at each stage of manure management (e.g., housing, storage, land
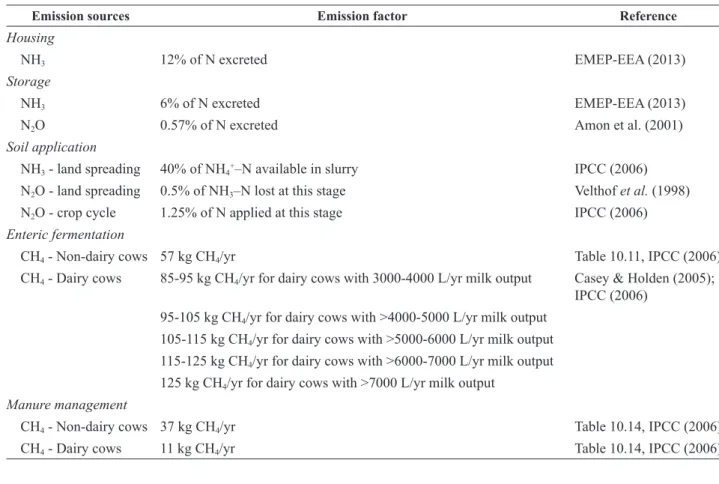
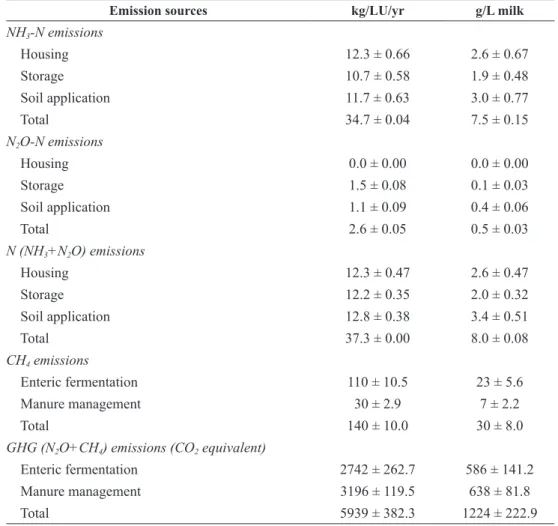
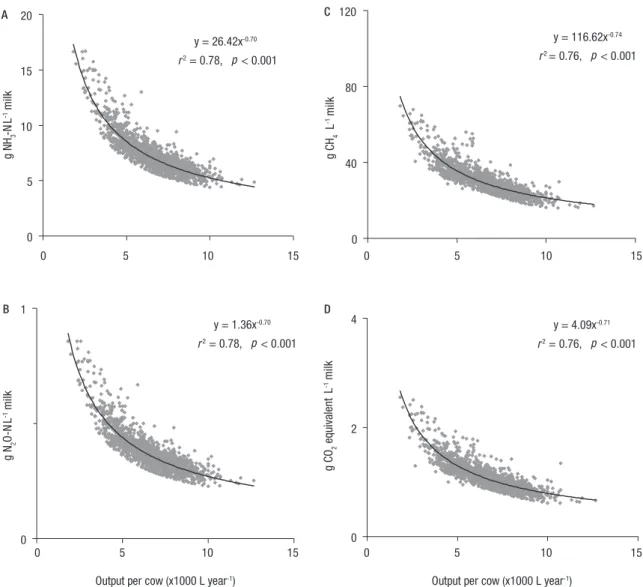
Table 2 shows the mean values of gaseous emissions from all stages of manure management. We observed important NH3 emissions (>25% of total losses) at all stages of manure management, but soil application was the main source of NH3 emissions followed by housing. A significant (p<0.05) negative relationship was ob-served between the intensity of milk output per cow and NH3 emissions per litre of milk produced in each farm (Fig 1A). In our study, the NH3 emissions were 92% of N emissions (NH3+N2O) of which were con-tributed 35, 25 and 40%, respectively, from housing, storage and soil application (Table 2). So, these values observed in each stage of manure management are comparable to values obtained in other studies, with higher NH3 emissions in soil application followed by housing (Sommer et al., 2006). In addition, our esti-mates of emissions of NH3 (expressed per litre of milk produced) are comparable with average values observed in dairy cattle farms located at Germany, Portugal and UK, with emissions that ranged between 7.5 and 7.7 g N/L milk (Fangueiro et al., 2008).
The N2O emissions (2.6 kg N/LU/yr) from all stages of manure management were small relative to NH3 emissions (34.7 kg N/LU/yr) observed in the farms, being less than 8% of N emissions (NH3+N2O) (Table 2). The main source of N2O emissions was soil proach of IPCC (IPCC, 2006) for Portuguese
condi-tions (Table 1). For dairy cows, the CH4 emissions from enteric fermentation were estimated by Tier 2 approach of IPCC, and in function of milk production of each farm (Table 1) as used by Casey & Holden (2005).
The relationship between milk production and gase-ous emissions was established using regression analy-sis (e.g., fitting exponential equations). The software used was STATISTIX 7.0 (USA) and significant sta-tistical differences correspond to p<0.05.
The main characteristics (mean±standard deviation) of the typical Portuguese dairy cattle farms studied (n=1471) were as follows: dairy cows and non-dairy cows=48±32.1 and 25±23.0 animals/farm/yr, respec-tively; milk production=6601±1634.5 L/cow/farm/yr; LU=67.4±48.25; total N excreted in ma-nure=118.5±9.38 and 50±0.0 kg N/yr for dairy cows and non-dairy cows, respectively. It was observed that the cattle numbers ranged considerably between the studied farms. The number of dairy cows varied be-tween 20 and 441 animals and milk production varied between 2000 and 13000 L/yr/cow. The non dairy cows were about 34% of total cattle housed in each farm and 42% of the 1471 commercial dairy cattle farms had an annual milk production higher than 7000 L/cow.
Table 1. Emission factors of NH3, N2O and CH4 from dairy cattle farms
Emission sources Emission factor Reference
Housing
NH3 12% of N excreted EMEP-EEA (2013)
Storage
NH3 6% of N excreted EMEP-EEA (2013)
N2O 0.57% of N excreted Amon et al. (2001)
Soil application
NH3 - land spreading 40% of NH4+–N available in slurry IPCC (2006)
N2O - land spreading 0.5% of NH3–N lost at this stage Velthof et al. (1998)
N2O - crop cycle 1.25% of N applied at this stage IPCC (2006)
Enteric fermentation
CH4 - Non-dairy cows 57 kg CH4/yr Table 10.11, IPCC (2006)
CH4 - Dairy cows 85-95 kg CH4/yr for dairy cows with 3000-4000 L/yr milk output Casey & Holden (2005);
IPCC (2006)
95-105 kg CH4/yr for dairy cows with >4000-5000 L/yr milk output
105-115 kg CH4/yr for dairy cows with >5000-6000 L/yr milk output
115-125 kg CH4/yr for dairy cows with >6000-7000 L/yr milk output
125 kg CH4/yr for dairy cows with >7000 L/yr milk output
Manure management
CH4 - Non-dairy cows 37 kg CH4/yr Table 10.14, IPCC (2006)
(2010) who reported a environmental impact (using life cycle assessment methodology) of 1.0 kg CO2 equivalent/L milk in a typical Portuguese dairy farm (including diesel consumption). Our study does not in-clude N2O from mineral fertilisers, indirect N2O emis-sions and CO2 losses from direct and indirect energy use in dairy farms. Also, differences between our estimates and the previously referred study are related with an underestimate of GHG emissions coming from enteric fermentation of dairy cows reported by Castanheira et
al. (2010), since they used a Tier 1 approach to estimate
emissions whereas this study used a Tier 2 approach. Nevertheless, Casey & Holden (2005) calculated GHG emissions ranged from 0.9 to 1.5 kg CO2 equivalent per litre of milk in typical Irish dairy cattle farms and found a negative relationship between GHG emissions and the intensity of milk production, being comparable with the present study. In addition, increasing milk yield/cow will reduce GHG emissions, if these emissions are expressed per kg milk and reduction in associated beef production is not considered (Zehetmeier et al., 2012).
application with 75% of total losses against less than 25% in storage and housing. Considering the N2O emis-sions from all stages of manure management, it was observed a significant (p<0.05) negative relationship between the increase of milk production in farms and N2O losses per litre of milk produced (Fig 1B).
Enteric fermentation contributes with 46% of total CH4 emissions (110 kg CH4/LU/yr) from farms and manure management was responsible for the remaining CH4 losses. The GHG (N2O+CH4) emissions, expressed in CO2 equivalent, from the studied Portuguese dairy cattle farms were about 6.0 t/LU/yr, wherein about half of these losses are emitted from enteric fermentation and the other half coming from manure management (Table 2). In addition, the increase of milk production in farms reduces significantly (p<0.05) the CH4 and GHG emissions per litre of milk produced in studied farms (Fig. 1C-1D).
The GHG emissions observed in the studied dairy cattle farms (1.2 kg CO2 equivalent/L milk) (Table 2) are higher than a previous study by Castanheira et al.
Table 2. Average values (mean±standard deviation) of NH3, N2O and CH4 emissions from dairy
cattle farms (n=1471).
Emission sources kg/LU/yr g/L milk
NH3-N emissions Housing 12.3 ± 0.66 2.6 ± 0.67 Storage 10.7 ± 0.58 1.9 ± 0.48 Soil application 11.7 ± 0.63 3.0 ± 0.77 Total 34.7 ± 0.04 7.5 ± 0.15 N2O-N emissions Housing 0.0 ± 0.00 0.0 ± 0.00 Storage 1.5 ± 0.08 0.1 ± 0.03 Soil application 1.1 ± 0.09 0.4 ± 0.06 Total 2.6 ± 0.05 0.5 ± 0.03 N (NH3+N2O) emissions Housing 12.3 ± 0.47 2.6 ± 0.47 Storage 12.2 ± 0.35 2.0 ± 0.32 Soil application 12.8 ± 0.38 3.4 ± 0.51 Total 37.3 ± 0.00 8.0 ± 0.08 CH4 emissions Enteric fermentation 110 ± 10.5 23 ± 5.6 Manure management 30 ± 2.9 7 ± 2.2 Total 140 ± 10.0 30 ± 8.0
GHG (N2O+CH4) emissions (CO2 equivalent)
Enteric fermentation 2742 ± 262.7 586 ± 141.2
Manure management 3196 ± 119.5 638 ± 81.8
reducing gaseous from cattle farms and are in agree-ment that pre-excretion techniques designed for lower-ing excreta (e.g., optimised crude protein in diet and increased milk production at farm level) are more ef-ficient than post-excretion strategies (e.g., floor type and manure handling). In the present study, results obtained showed that increasing milk production in farms will reduce significantly (p<0.05) NH3 and GHG emissions per litre of milk produced in each farm. Hence, a win-win strategy for reducing NH3 and GHG emissions from dairy cattle farms will be the increase of milk production in these farms. For example, a farm with 10000 L/cow of annual milk production should had an amount 25% lower of NH3 and GHG emissions, expressed per litre of milk produced, relative to a farm with a annual milk production of 6600 L/cow. A high milk production per cow will result in fewer cows to achieve the same level of production relative to less The results obtained in our study are a logical
con-sequence of the mathematical equations (Eq. [1]-[5]) of the methodology. Thus, Eq. [5] for N excretion and IPCC equations are very sensitive to milk yield and crude protein (for N excretion). Since emission per animal increases with production intensity, but produc-tivity increases at a higher rate, emissions per product unit decrease and this originates the trend shown in Fig. 1. Therefore, increasing the production will reduce emissions, and improving genetics, nutrition and man-agement will both improve productivity and reduce emissions. There were substantial differences among farms in these factors, probably related to their produc-tion objective, which explain the important differences obtained in milk production (2000-13000 L/yr) and emissions.
Previous studies (Hristov et al., 2011; Pereira & Trindade, 2014) reviewed mitigation strategies for
g NH3 -N L -1 mi lk A
Output per cow (x1000 L year-1)
B 0 40 80 120 C
Output per cow (x1000 L year-1)
D y = 116.62x-0.74 r2= 0.76, p < 0.001 y = 26.42x-0.70 r2= 0.78, p < 0.001 0 5 10 15 20 g CH 4 L -1 mi lk g N2 O -N L -1 mi lk g CO 2 equivalent L -1 mi lk 0 1 y = 1.36x-0.70 r2= 0.78, p < 0.001 0 5 10 15 0 2 4 y = 4.09x-0.71 r2= 0.76, p < 0.001 0 5 10 15 0 5 10 15 0 5 10 15
Figure 1. The relationship between NH3 (A), N2O (B), CH4 (C) and greenhouse gas (N2O+CH4) (D) emissions and
European Environment Agency (EEA). Copenhagen, Denmark. http://www.eea.europa.eu/publications/emep-eea-guidebook-2013.
Fangueiro D, Pereira J, Coutinho J, Moreira N, Trindade H, 2008. NPK farm-gate nutrient balances in dairy farms from Northwest Portugal. Eur J Agron 28: 625-634. http:// dx.doi.org/10.1016/j.eja.2008.01.007
Gerber P, Vellinga T, Opio C, Steinfeld H, 2011. Productiv-ity gains and greenhouse gas emissions intensProductiv-ity in dairy systems. Livest Sci 139: 100-108. http://dx.doi. org/10.1016/j.livsci.2011.03.012
Hou Y, Velthof GL, Oenema O, 2015. Mitigation of ammonia, nitrous oxide and methane emissions from manure man-agement chains: a meta-analysis and integrated assess-ment. Global Change Biol 21: 1293-1312. http://dx.doi. org/10.1111/gcb.12767
Hristov AN, Hanigan M, Cole A, Todd R, Mcallister TA, Ndegwa PM, Rotz A, 2011. Review: Ammonia emissions from dairy farms and beef feedlots. Can J Anim Sci 91: 1-35. http://dx.doi.org/10.4141/CJAS10034
Hristov AN, Oh J, Firkins J, Dijkstra J, Kebreab E, Waghorn G, Adesogan A, Yang W, Tricarico J, Lee C, Gerber PJ, Henderson B, Makkar HPS, 2013. Mitigation of methane and nitrous oxide emissions from animal operations: I. A review of enteric methane mitigation options. J Anim Sci 91: 5045-5069. http://dx.doi.org/10.2527/jas.2013-6583 IPCC, 2006. 2006. IPCC Guidelines for National Greenhouse
Gas Inventories. In: IPCC national greenhouse gas inven-tories programme, Technical support unit; Eggleston HS, Buendia L, Miwa K, Ngara T, Tanabe K (eds). IGES, Hayama, Japan. http://www.ipcc-nggip.iges.or.jp. Montes F, Meinen R, Dell C, Rotz A, Hristov AN, Oh J,
Waghorn G, Gerber PJ, Henderson B, Makkar HPS, 2013. Mitigation of methane and nitrous oxide emissions from animal operations: II. A review of manure management options. J Anim Sci 91: 5070-5094. http://dx.doi.org/ 10.2527/jas.2013-6584
NREAP, 2013. Decree number 81/2013 of 14 June regarding animal manure management (NREAP). In: Diário da República, Série I, number 113 of 14 June 2013. Portugal, pp: 3304-3329. https://dre.pt/application/file/496667 Pereira J, Misselbrook TH, Chadwick DR, Coutinho J,
Trin-dade H, 2010. Ammonia emissions from naturally venti-lated dairy cattle buildings and outdoor concrete yards in Portugal. Atmos Environ 44: 3413-3421. http://dx.doi. org/10.1016/j.atmosenv.2010.06.008
Pereira J, Trindade H, 2014. Control of ammonia emissions from naturally ventilated dairy cattle houses in Portugal. Eng Agríc 34: 600-609. http://dx.doi.org/10.1590/S0100-69162014000300022
Pereira J, Coutinho J, Trindade H, 2016. Assessment of net nitrogen mineralisation from repeated applications of cattle-slurry and mineral fertiliser in a Mediterranean for-age system. Journal of Global Agriculture and Ecology 4: 1-6.
Sommer SG, Zhang GQ, Bannink A, Chadwick D, Missel-brook T, Harrison R, Hutchings NJ, Menzi H, Monteny GJ, Ni JQ, Oenema O, Webb J, 2006. Algorithms deter-mining ammonia emission from buildings housing cattle
intensive dairy farm. On the other hand, the reduction of replacement animals (heifers) has a similar effect than high milk production per cow and could reduce NH3 and GHG emissions in farms.
In conclusion, the manure management and enteric fermentation in a typical Portuguese cattle farm con-tributes with 7.5±0.15 g N/L milk produced as NH3 and 1.2±0.22 kg CO2 equivalent per litre of milk as GHG. Besides, increasing milk production in farms will re-duce significantly NH3 and GHG emissions per litre of milk produced in each farm. It can be concluded that a win-win strategy for reducing NH3 and GHG emis-sions from dairy cattle farms will be the increase of milk production on these farms. This goal can be achieved by implementing animal breeding programs and improving feed efficiency in order to increase productivity.
Acknowledgments
The authors thank the reviewers for their sugges-tions.
References
Amon B, Amon T, Boxberger J, Alt C, 2001. Emissions of NH3, N2O and CH4 from dairy cows housed in a farm-yard manure tying stall (housing, manure storage, manure spreading). Nutr Cycl Agroecosyst 60: 103-113. http:// dx.doi.org/10.1023/A:1012649028772
Beccaccia A, Ferrer P, Ibáñez MA, Estellés F, Rodríguez C, Moset V, de Blas C, Calvet S, García-Rebollar P, 2015. Relationships among slurry characteristics and gaseous emissions at different types of commercial Spanish pig farms. Span J Agric Res 13 (1): e0602. http://dx.doi. org/10.5424/sjar/2015131-6575
Brito LM, Alonso JM, Mamede J, Rey-Graña J, 2011. Slurry management in the milk farms of Entre Douro e Minho. Revista de Ciências Agrárias 34: 80-93.
Casey JW, Holden NM, 2005. The relationship between greenhouse gas emissions and the intensity of milk pro-duction in Ireland. J Environ Qual 34: 429-436. http:// dx.doi.org/10.2134/jeq2005.0429
Castanheira EG, Dias AC, Arroja L, Amaro R, 2010. The environmental performance of milk production on a typical Portuguese dairy farm. Agric Syst 103: 498-507. http://dx.doi.org/10.1016/j.agsy.2010.05.004
Dämmgen U, Webb J, 2006. The development of the EMEP/ CORINAIR Guidebook with respect to the emissions of different nitrogen and carbon species from animal produc-tion. Agric Ecosyst Environ 112: 241-248. http://dx.doi. org/10.1016/j.agee.2005.08.025
EMEP-EEA, 2013. EMEP/EEA air pollutant emission inven-tory guidebook 2013. EEA Technical report No 12/2013.
Vérité R, Delaby L, 1998. Conduite alimentaire et sujets azotés chez la vache laitière. Interactions avec les per-formances. Rencontres Recherches Ruminants 5: 185-192.
Webb J, Misselbrook TH, 2004. A mass-flow model of am-monia emissions from UK livestock production. Atmos Environ 38: 2163-2176. http://dx.doi.org/10.1016/j.at-mosenv.2004.01.023
Zehetmeier M, Baudracco J, Hoffmann H, Heißenhuber A, 2012. Does increasing milk yield per cow reduce green-house gas emissions? A system approach. Animal 6: 154-166. http://dx.doi.org/10.1017/S1751731111001467 and pigs and from manure stores. Adv Agron 89: 261-335.
http://dx.doi.org/10.1016/S0065-2113(05)89006-6 Trindade H, Coutinho J, Jarvis S, Moreira N, 2009. Effects
of different rates and timing of application of nitrogen as slurry and mineral fertilizer on yield of herbage and ni-trate-leaching potential of a maize ⁄ Italian ryegrass crop-ping system in north-west Portugal. Grass Forage Sci 64: 2-11. http://dx.doi.org/10.1111/j.1365-2494.2008.00664.x Velthof GL, Van Beusichem ML, Oenema O, 1998. Mitiga-tion of nitrous oxide emission from dairy farming systems. Environ Pollut 102: 173-178. http://dx.doi.org/10.1016/ S0269-7491(98)80030-4