Research Article
Conversion to Sirolimus Ameliorates Cyclosporine-Induced
Nephropathy in the Rat: Focus on Serum, Urine,
Gene, and Protein Renal Expression Biomarkers
José Sereno,
1,2Sara Nunes,
1Paulo Rodrigues-Santos,
3,4Helena Vala,
5,6Petronila Rocha-Pereira,
7João Fernandes,
1,8Alice Santos-Silva,
8,9Frederico Teixeira,
1and Flávio Reis
11Laboratory of Pharmacology & Experimental Therapeutics, IBILI, Faculty of Medicine, University of Coimbra,
Sub-Unit 1 (P´olo III), 3000-548 Coimbra, Portugal
2Institute for Nuclear Sciences Applied to Health (ICNAS), University of Coimbra, 3000-548 Coimbra, Portugal
3Institute of Immunology, Faculty of Medicine, University of Coimbra, 3004-504 Coimbra, Portugal
4Immunology and Oncology Laboratory, Center for Neurosciences and Cell Biology, 3004-504 Coimbra, Portugal
5ESAV, Polytechnic Institute of Viseu, 3504-510 Viseu, Portugal
6Educational, Technologies and Health Study Center, Polytechnic Institute of Viseu, 3504-510 Viseu, Portugal
7Research Centre for Health Sciences, Beira Interior University, 6201-506 Covilh˜a, Portugal
8Biochemistry Department, Pharmacy Faculty, Porto University, 4050-313 Porto, Portugal
9Institute for Molecular and Cellular Biology, Porto University, 4150-180 Porto, Portugal
Correspondence should be addressed to Fl´avio Reis; freis@fmed.uc.pt Received 21 February 2014; Accepted 17 April 2014; Published 19 May 2014 Academic Editor: Pasquale Ditonno
Copyright © 2014 Jos´e Sereno et al. This is an open access article distributed under the Creative Commons Attribution License, which permits unrestricted use, distribution, and reproduction in any medium, provided the original work is properly cited. Protocols of conversion from cyclosporin A (CsA) to sirolimus (SRL) have been widely used in immunotherapy after transplantation to prevent CsA-induced nephropathy, but the molecular mechanisms underlying these protocols remain nuclear. This study aimed to identify the molecular pathways and putative biomarkers of CsA-to-SRL conversion in a rat model. Four animal groups (𝑛 = 6) were tested during 9 weeks: control, CsA, SRL, and conversion (CsA for 3 weeks followed by SRL for 6 weeks). Classical and emergent serum, urinary, and kidney tissue (gene and protein expression) markers were assessed. Renal lesions were analyzed in hematoxylin and eosin, periodic acid-Schiff, and Masson’s trichrome stains. SRL-treated rats presented proteinuria and NGAL (serum and urinary) as the best markers of renal impairment. Short CsA treatment presented slight or even absent kidney lesions and TGF-𝛽, NF-𝜅𝛽, mTOR, PCNA, TP53, KIM-1, and CTGF as relevant gene and protein changes. Prolonged CsA exposure aggravated renal damage, without clear changes on the traditional markers, but with changes in serums TGF-𝛽 and IL-7, TBARs clearance, and kidney TGF-𝛽 and mTOR. Conversion to SRL prevented CsA-induced renal damage evolution (absent/mild grade lesions), while NGAL (serum versus urine) seems to be a feasible biomarker of CsA replacement to SRL.
1. Introduction
Calcineurin inhibitors, such as cyclosporin A (CsA), are clin-ically important immunosuppressive drugs for prevention of allograft rejection after organ transplantation and also for several autoimmune disorders, such as psoriasis, rheumatoid arthritis, systemic lupus erythematosus, and inflammatory
bowel disease, among other indications [1, 2]. Despite the
impressive reduction in the number of acute rejection episodes after the beginning of CsA use in clinical practice, long-term therapy is typically associated with drug-induced
nephrotoxicity [3]. Renal dysfunction is an independent risk
factor for graft loss and mortality after kidney transplantation (KTx) and cardiovascular disease (CVD) is the main cause of
dead post-KTx [4–6]; thus, extended long-term graft survival
has not been completely achieved.
Volume 2014, Article ID 576929, 17 pages http://dx.doi.org/10.1155/2014/576929
Complete avoidance of CNIs, in particular of CsA, from transplantation immunotherapy, has been viewed as an invalid option by almost all the transplantation centres world-wide, particularly because of the risks in acute rejection. The main long-term goals of immunosuppressive therapy are to reduce drug exposure while maintaining a well-functioning graft, keeping efficacy and minimizing drug-induced serious
side-effects, including infections and nephrotoxicity [7]. The
recognition of these serious adverse effects sparked interest
in CsA-sparing strategies [8]: dose reduction is associated
with a modest improvement in renal function, but CsA-induced nephropathy is progressive over time when exposure is maintained; CsA avoidance is associated with high acute rejection rates and is not an option; minimization protocols are the current preferred therapy, including the conversion from CsA to other drugs, especially sirolimus (SRL), an inhibitor of the mammalian target of rapamycin (mTOR)
[9–11]. Despite the SRL-evoked proteinuria, this drug has
been indicated as a less nephrotoxic immunosuppressive agent per se when compared with calcineurin inhibitors
[12], but its use after CsA would have an impact on the
renal function/structure that should be precisely defined. The major question nowadays concerning the protocols of immunotherapy is to find the most adequate duration for CsA exposure and the proper moment for replacement by other less nephrotoxic drugs, such as SRL, in order to afford renoprotection without compromising the graft by a rejection episode.
Early diagnosis of nephropathy can greatly improve patient diagnosis, but the initial stages of CsA-induced nephropathy are largely asymptomatic, making early
diag-nosis difficult [13]. Since the current diagnostic techniques
employed to detect CsA nephropathy seem to be unsat-isfactory, the identification of novel, early disease indica-tors is currently a major research focus. Identifying drug safety liabilities or predictive biomarkers for drug-induced organ damage is of great value. Drug safety evaluation has mainly been based on biochemical and histopathological data, but transcriptional profiling has the promise of being able to detect toxicity objectively. In addition, gene expression changes associated with toxicity may also accurately and earlier assist our understanding on the mechanism of certain
drug-induced toxicity [14,15], which will be pivotal for drugs
with a low therapeutic window, such as the immunosuppres-sive agents. The precise mechanisms and biomarkers, under-lying transition from renal dysfunction to nephrotoxicity, deserve better elucidation; experimental studies have been important to improve the knowledge on this translational issue of clinical relevance.
The mechanisms underlying CsA-induced nephropathy have been debated for the last decades and are clearly viewed as having a multifactorial nature (including vasore-laxant/vasoconstrictor disequilibrium, oxidative stress,
apop-tosis, and proliferation/fibrosis) [16–20], as evolving and
changing with the increased duration of exposure [3,21,22]
and as modulated by influence on renal tissue gene expression
[23–25]. With nephrotoxicity remaining a major contributing
factor to late allograft damage, it is crucial to understand the impact on the kidney tissue of protocols of conversion
from CsA to SRL and identify early biomarkers in order to improve the therapeutic strategies after transplantation, thus extending long-term graft survival by reducing cardiorenal mortality. Molecular studies on animal tissues are essential to elucidate these questions and emergent biomarkers of renal damage, such as NGAL, KIM-1, and CTGF, among others, would increase our knowledge of how to better manage this drug-related nephropathy.
We have previously shown, in a preliminary study using an experimental model for comparing CsA and SRL, that distinct mechanisms and players are involved in the effects of these drugs on the kidney tissue, in a moment when renal
lesions are almost absent [26]. In addition, our previous data
suggested that early conversion from CsA to SRL promotes
a better cardiorenal profile than late conversion [27], whose
mechanisms and biomarkers deserve now more elucida-tion. The current study intended to clarify the pathways of nephropathy evolution in a protocol of conversion from CsA to SRL in the rat, focusing on serum, urine, and renal (gene and protein) tissue samples, as well as to elucidate the involvement of several emergent biomarkers of renal damage which are putative candidates to act as players in the evolution from renal dysfunction to nephrotoxicity.
2. Materials and Methods
2.1. Animals and Treatments. Male Wistar rats (aged 11
weeks) were purchased from Charles River Laboratories (Barcelona, Spain) and housed (two animals per cage) in IVC racks, subjected to 12 h dark/light cycles and given standard laboratory rat chow (IPM-R20, Letica, Barcelona, Spain) and free access to tap water. Forty-two animals were divided into two groups, according to the period of the treatments. Eighteen animals were used in a protocol of 3-week treatments and divided in 3 groups: control (vehicle), cyclosporin A (5 mg/Kg/day of Sandimmun Neoral, Novartis Farma Produtos Farmacˆeuticos SA, Sintra, Portugal), and sirolimus (1 mg/kg BW/day of Rapamune, Laborat´orios Pfizer Lda., Lisbon, Portugal). Twenty-four animals were used in a protocol of 9-week treatments and divided into 4 groups: control (vehicle), cyclosporin A, sirolimus, and conversion (cyclosporin A during 3 weeks and sirolimus during the last 6 weeks). Treatments were performed by oral gavage and body weight was monitored daily. Animal experiments were conducted according to the European Council Directives on Animal Care and to the National Authorities.
2.2. Sample Collection and Preparation. The rats were
anes-thetized (i.p.) with 2 mg/Kg BW of a 2 : 1 (v : v) 50 mg/mL Ketamine (Ketalar, Parke-Davis, Pfizer Laboratories Ltd, Seixal, Portugal) solution in 2.5% chlorpromazine (Largatil, Rhˆone-Poulenc Rorer, Vit´oria laboratories, Amadora, Portu-gal). When the animal did not present response to stimulus, blood samples were immediately collected by venipuncture from the jugular vein in needles with no anticoagulant for serum samples collection. Then, the rats were sacrificed by cervical dislocation, and the kidneys were immediately removed, weighted, divided, and stored according to the next procedure: RNA-stabilizer reagent for gene expression
determinations, frozen in nitrogen for lipid peroxidation assays, prefixed with formaldehyde for histopathological analysis and immunohistochemical detections.
2.3. Serum and Urinary Measures
2.3.1. Serum Biochemical Data. Serum creatinine and blood
urea nitrogen (BUN) contents were evaluated by automatic validated methods and equipment (Hitachi 717 analyser, Roche Diagnostics Inc., MA, USA). Serum levels of inter-leukin 1𝛽 (IL-1𝛽), interinter-leukin 2 (IL-2), vascular epidermal growth factor (VEGF), and transforming growth factor beta 1
(TGF-𝛽1) were measured by ultrasensitive Quantikine ELISA
kits (R&D Systems, Minneapolis, USA). High sensitivity CRP (hsCRP) was detected by using an ELISA kit (Alpha Diagnostic International, San Antonio, USA). Interleukin-7 (IL-7) was measured through an ELISA kit obtained from Wuhan EIAAB Science Co (Wuhan, China).
2.3.2. Urinary Data. The animals were housed in metabolic
cages during 24 hours and received tap water and food ad
libitum. The urine concentration of creatinine, BUN, and
protein was assessed in 24-hour urine (Cobas Integra 400 plus, Roche), and the urine volumes were measured in order to calculate creatinine and BUN clearance and glomerular
filtration rate, as previously described [28].
2.3.3. Serum, Kidney, and 24-Hour Urine Lipid Peroxidation.
Lipid peroxidation was determined by assaying the malondi-aldehyde (MDA) production by means of the thiobarbituric
acid (TBA) test. Briefly, 100𝜇L of kidney tissue supernatant,
serum, or urine (previously centrifuged to remove partic-ulates) was incubated 1 hour in a TBA solution. Samples
incubated at 90∘C for 60 min. In this test, one molecule of
MDA reacts with two molecules of TBA with the production of a pink pigment producing maximal absorbance at 532 nm. The concentration of MDA was calculated with respect to a calibration curve using 1,1,3,3-tetramethoxypropane as
the external standard (range: 0.1–83.5𝜇M) and results were
expressed as𝜇M/g of kidney tissue and 𝜇M of serum or urine.
2.4. RT-qPCR Kidney Gene Expression
2.4.1. Total RNA Isolation. The kidneys were stored in RNA
later solution (Ambion, Austin, TX, USA). For RNA
extrac-tion, 10 mg of tissue was weighted, 450𝜇L of RLT lysis buffer
was added, and tissue disruption and homogenization for 2 min at 30 Hz were performed using a TissueLyser (Qiagen, Hilden, Germany). Tissue lysates were processed according to the RNeasy Mini Kit protocol (Qiagen, Hilden, Germany).
Total RNA was eluted in 50𝜇L of RNase-free water (without
optional treatment with DNAse). In order to quantify the amount of total RNA extracted and to verify RNA integrity (RIN, RNA Integrity Number), samples were analyzed using a 6000 Nano Chip kit, in the Agilent 2100 Bioanalyzer (Agilent Technologies, Walbronn, Germany) and the 2100 expert software, following manufacturer’s instructions. The
isolation yield was from 0.5 to 3𝜇g; RIN values were 6.0–9.0
and purity (A260/A280) was 1.8–2.0.
2.4.2. Reverse Transcription. RNA was reverse transcribed
with SuperScript III First-Strand Synthesis System for RT-PCR (Invitrogen, California, USA). One microgram of total RNA was mixed with a 2x First-Strand Reaction Mix and a SuperScript III Enzyme Mix (Oligo (dT) plus random hexamers). Reactions were carried out in a thermocycler Gene Amp PCR System 9600 (Perkin Elmer, Norwalk, CT,
USA), 10 min at 25∘C, 30 min at 50∘C, and 5 min at 85∘C.
Reaction products were then digested with 1𝜇L (2 U) RNase
H for 20 min at 37∘C and, finally, cDNA was eluted to a final
volume of 50𝜇L and stored at −20∘C.
2.4.3. Relative Gene Expression Quantification. Gene
expres-sion was performed using a 7900 HT Sequence Detec-tion System (Applied Biosystems, Foster City, USA). A normalization step preceded the gene expression quantifi-cation, using geNorm Housekeeping Gene Selection kit for Rattus norvegicus (Primer Design, Southampton, UK) and geNorm software (Ghent University Hospital, Center for Medical Genetics, Ghent, Belgium) to select optimal
housekeeping genes for this study [29]. Real-time PCR
reactions used specific QuantiTect Primer Assays (Qia-gen, Hilden, Germany) with optimized primers for trans-forming growth factor beta 1 (QT00187796), proliferat-ing cell nuclear antigen (QT00178647), mechanistic tar-get of rapamycin (QT00180586), nuclear factor kappa B (QT01577975), monoclonal antibody Ki-67 (QT00450786), and tumor protein p53 (QT00193522) as proliferative mark-ers; vascular endothelial growth factor beta (QT01290163) as angiogenic marker; interleukin 1 beta (QT00181657), inter-leukin 2 (QT00185360), tumor necrosis factor (QT00178717), cyclooxygenase 2 (QT00192934), and C-reactive protein (QT00391650) as inflammatory markers. Endogenous con-trols were used for kidney [glyceraldehyde-3-phosphate dehydrogenase (QT00199633), actin beta (QT00193473), and topoisomerase I (QT01820861)]. A QuantiTect SYBR Green PCR Kit (Qiagen, Hilden, Germany) was used according to manufacturer’s instructions. RT-qPCR reactions were carried out with 100 ng cDNA sample, primers (50–200 nM), and 1x QuantiTect SYBR Green PCR Master Mix. Nontemplate control reactions were performed for each gene, in order to assure nonunspecific amplification. Reactions were
per-formed with the following thermal profile: 10 min at 95∘C plus
40 cycles of 15 seconds at 95∘C and 1 min at 60∘C. Real-time
PCR results were analyzed with SDS 2.1 software (Applied Biosystems, Foster City, USA) and quantification used the
2−ΔΔCt method [30]. The results were obtained in CNRQ
(calibrated normalized relative quantities).
2.5. Histopathological Analysis
2.5.1. Haematoxylin and Eosin Staining. Samples were fixed
in Bock’s fixative and embedded in paraffin wax, and 4𝜇m
routine histopathological diagnosis with haematoxylin and eosin (H&E).
2.5.2. Periodic Acid of Schiff Staining. Periodic acid of Schiff
(PAS) was used to evaluate and quantify the renal lesions. Samples were fixed in 10% neutral formalin, embedded in
paraffin wax, and 4𝜇m thick sections were immersed in
water and subsequently treated with a 1% aqueous solution of periodic acid, then washed to remove any traces of the periodic acid, and finally treated with Schiff ’s reagent. All samples were examined by light microscopy using a Zeiss Microscope Mod. Axioplan 2. The degree of injury visible by light microscopy was scored in a double-blinded fashion by two independent pathologists. Lesions were evaluated on the total tissue on the slide.
2.5.3. Analysis of Lesions. Glomerular damage was assessed
by evaluating mesangial expansion, the glomerular basement membrane and the Bowman’s capsule thickenings, nodular sclerosis, and vascular pole hyalinosis. The analysed tubuloin-terstitial lesions comprised inflammatory infiltration, pres-ence of hyaline cylinders, tubular basement membrane irreg-ularity, tubular calcification, tubular vacuolization, and the association of interstitial fibrosis and tubular atrophy (IFTA). The evaluation of vascular lesions was concentrated on vascular congestion and hyperemia, arteriolar vacuolization, arteriolosclerosis, and arteriosclerosis. A semiquantitative rating for each slide ranging from normal (or minimal) to severe (extensive damage) was assigned to each component. Severity was graded as absent/normal (0), mild (1), moderate (2), and severe (3). Scoring was defined according to the extension of the lesion (number of capsules): normal: 0%;
mild:<25%; moderate: 25–50%; severe: >50%. The final score
of each sample was obtained by the average score observed in the individual glomeruli, in the considered microscopic fields. Tubular calcification was evaluated and graded by the same semiquantitative method. Regarding vascular lesions, arteriosclerosis was scored as 0 if no intimal thickening was present, as 1 if intimal thickening was less than the thickness of the media, and as 2 if intimal thickening was more than the thickness of the media and considering the worst artery on the slide. Using PAS, the rating was set for intensity and extension of staining, ranging from 0 (no staining) to 3 (intense and extensive staining), respecting tissue specificity scoring when adequate.
2.5.4. Masson’s Trichrome Staining. Deparaffinise and
rehy-drate through 100% alcohol, 95% alcohol, and 70% alcohol. Wash in distilled water. After that, refix in Bouin’s solution for
1 hour at 56∘C to improve staining quality and rinse in
run-ning tap water for 5–10 minutes to remove the yellow colour. Stain in Weigert’s iron hematoxylin working solution for 10 minutes and rinse in running warm tap water for 10 minutes. Wash in distilled water. Stain in Biebrich scarlet-acid fuchsin solution for 10–15 minutes and wash in distilled water. Differ-entiate in phosphomolybdic-phosphotungstic acid solution for 10–15 minutes and transfer sections directly to aniline blue solution and stain for 5–10 minutes. Rinse briefly in distilled
water and differentiate in 1% acetic acid solution for 2–5 minutes and wash in distilled water. Finally, dehydrate very quickly through 95% ethyl alcohol, absolute ethyl alcohol, clear in xylene, and mount with resinous mounting medium. All samples were examined in a blind fashion by expert personnel (pathologists) by light microscopy using a Zeiss Microscope Mod. Axioplan 2.
2.6. Immunohistochemical Analysis. Immunohistochemical
analyses were performed in 4𝜇m thick sections with sagittal
orientation of kidney fixed in Bock’s fixative and embedded in paraffin wax. The samples were processed by indirect immune detection technique with mouse and rabbit specific HRP/DAB detection IHC kit (Abcam, Cambridge, UK) using the primary antibody mammalian target of rapamycin (Mil-lipore Corporation, Billerica, MA, USA, 04-385) (dilution 1 : 250). The protocol was executed according to the manu-facturer’s instructions. In this study, we employed primary antibodies against CTGF (dilution 1 : 100, ab6992; Abcam), TGF-b (dilution 1 : 100, ab66043; Abcam), mTOR (dilution 1 : 250, 04-385; Millipore), NF-𝜅𝛽 p50 (dilution 1 : 500, sc-114; Santa Cruz Biotechnology), and KIM-1 (dilution 1 : 14, AF3689; R&D Systems). For KIM-1 detection the secondary antibody was anti-goat (dilution 1 : 500, sc2771; Santa Cruz Biotechnology). After testing the different antigen-retrieval methods and negative controls, immunohistochemical pro-cedures were optimized. To identify PCNA protein we used a standard kit (ready to use, 93-1143, Invitrogen Corporation). An appropriate positive control was used in each staining run, and each slide was stained with a negative control obtained by omitting the primary antibody. Standard procedures were used for visualisation and the staining was quantified using a semiquantitative scale (1–4) that evaluated both the intensity and area of staining. Intensity was graded as very low (1), low (2), moderate/mild (3), and high (4); staining area was graded
as<25% (1), 25–50% (2), 25–75% (3), and >75% (4). All slides
were reviewed independently by 2 investigators blinded to the data. In this evaluation a quantitative immunohistochemical
score (QIC) was calculated. QIC = % of staining area ∗
staining intensity∗0.1.
2.7. Statistical Analysis. Statistical analyses were performed
using the GraphPad Prism for Windows (version 5.00).
The results are presented as means± S.E.M. Comparisons
between groups were performed using one-way ANOVA test, followed by the post hoc Bonferroni’s multiple com-parisons. The association between categorical variables was analyzed using Pearson’s test in the IBM Statistical Package for Social Sciences (SPSS) for Windows, version 20.0 (SPSS
Inc., Chicago, IL, USA). Significance was accepted at𝑃 less
than 0.05.
3. Results
3.1. Kidney Histomorphological Changes and Collagen Depo-sition. Nephrotoxicity was confirmed by two independent
the attribution of degrees to each vascular, glomerular, and tubular lesion, examining kidney slices stained with H&E and PAS. After 3 weeks of CsA treatment, only slight morphologi-cal changes on the tubules (tubular vacuolization) were found
when compared with the control (Figure 1). However, signs
of toxicity were identified in the vessels since some kidney slices revealed arteriolar vacuolization and hyperemia. SRL treatment during identical period, described in the literature as less nephrotoxic than CsA, surprisingly revealed some lesions in the vascular (congestion and hyperemia) and tubular (vacuolization and calcification) fields. Total lesion scoring showed that only SRL was able to induce significant damage in the vessels (𝑃 < 0.05) and tubules (𝑃 < 0.01)
after the first 3-week period (Figures2(a1) and2(c1)).
Long-term CsA treatment (9 weeks) promoted relevant changes on the kidney (vessels, glomeruli, and tubules) structure, which are viewed as clear signs of nephrotoxicity. The main changes encountered compared with the normal controls
are represented inFigure 1. In the long-term CsA exposure,
vascular congestion, vascular hyperemia, and arteriolar vac-uolization and arteriolosclerosis were identified, being all
sta-tistically significant versus the control group (Figure 1(a1–4)).
Sirolimus revealed similar pattern to that found for CsA but does not induce arteriolosclerosis, compared to CsA (𝑃 < 0.05). The conversion protocol does not promote any advantage in the vascular field when compared with the CsA treatment alone; two rats of the group presented arteriosclerosis (grades 1 and 2).
Regarding the glomerular field after 9 weeks of CsA treatment, the major lesions found were mesangial expansion (𝑃 < 0.01), hyalinosis of vascular pole (𝑃 < 0.001), and thickening of Bowman’s capsule (𝑃 < 0.001) when
compared with the control rat kidneys (Figure 1(b1–4)).
One rat presented hydronephrosis and cortical atrophy. In the SRL treatment the single significant lesion found was Bowman’s capsule thickening, confirming a better profile in the conversion protocol. Mesangial expansion and vascular pole hyalinization grade were almost absent when compared with the isolate CsA treatment. However, all rats from the conversion group showed glomerular basement membrane thickening (𝑃 < 0.05 versus CsA). The global glomerular score clearly showed that SRL is less toxic than CsA (𝑃 < 0.01) and this was reflected in the lower score found in the conversion group.
CsA induces tubular damages and the main lesions identified were tubular vacuolization and calcification (𝑃 < 0.001, both), versus the normal profile found in the control
rats (Figures 1(c1–4) and 2(c2-3)). However, the presence of
hyaline cylinders and inflammatory infiltration was iden-tified in almost all the kidneys (grade 1, less than 25% of the tubules). Sirolimus treatment only induced tubular vacuolization. However, when CsA was used prior to SRL (conversion group), tubular calcification and vacuolization remain present in the same grade than that encountered for CsA therapy alone. In contrast, hyaline cylinders (𝑃 < 0.05) and inflammatory infiltration were absent in the kidneys of
the conversion group rats.Figure 2(c1) gives an idea about the
treatments influence on the tubules. Clearly, CsA promotes more tubular damage than SRL, and CsA conversion to SRL
revealed less total lesions grade in glomerular and tubular fields.
Collagen is the major insoluble fibrous protein in the extracellular matrix and in connective tissue and is clearly marked with Masson’s trichrome; modifications of collagen production reflect cellular changes and consequent kidney dysfunction. In the kidneys from vehicle-treated rats, colla-gen staining was rare in the glomeruli, and a small amount of blue Trichrome staining appeared in the outer borders
tubules and around the vessels (Figures2(a4-5),2(b4-5), and
2(c4-5)). After 9 weeks of CsA treatment, staining was clearly
visible in the outer borders of tubular cells (cortex and medulla), well representing wide-spread interstitial fibro-sis. Bowman’s capsule thickening also occurred in some glomeruli; around the vessels we also verified higher collagen deposition in the CsA-treated rats. Sirolimus and conversion group revealed normal collagen staining (comparable to that encountered in the control group).
3.2. Nephrotoxicity Evaluation through Serum, Kidney, and Urine Markers. Classical serum markers of renal function,
such as creatinine and BUN, presented a trend to increased levels after 3 weeks of CsA treatment, accompanied by a trend to decreased creatinine and BUN clearances (Figures
3(a),3(b),3(d), and3(e)), resp.); however, all those measures
did not reach a statistical significant value. Moreover, CsA showed a trend to decreased glomerular filtration rate (GFR). On the other hand, unchanged values were found for the SRL group for all serum and urine markers. Long-term CsA treatment (9 weeks) presented a trend to aggravated serum creatinine and BUN levels; in addition, while GFR and kw/bw remained decreased, kidney TBARs production and clearance significantly increased (𝑃 < 0.05). The main change found for the SRL treatment after 3 weeks was increased urinary protein, with additional increment after 9 weeks, suggesting a time-dependent effect. The conversion protocol revealed no significant change on serum creatinine and BUN levels and clearances; moreover, GFR remains unchanged as
well as urinary protein and TBARs (Figure 3).
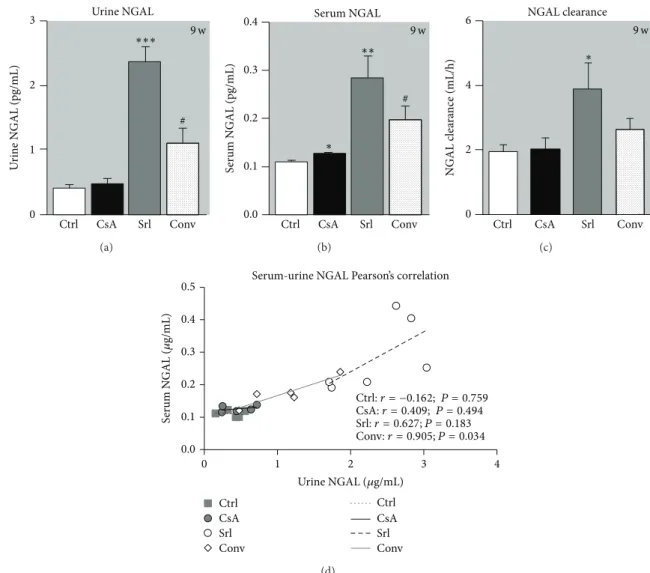
NGAL has been described as a putative biomarker of nephrotoxicity. Long-term CsA treatment only promoted serum NGAL increment (𝑃 < 0.05), without affecting urine and clearance values. The rats treated with SRL presented increased serum and urine NGAL contents, as well as augmented clearance. The use of SRL to replace CsA leads to increased NGAL levels in serum and urine compared to
the CsA group (𝑃 < 0.05) (Figures 4(a), 4(b), and4(c)).
Figure 4(d)showed the correlation between serum and urine NGAL levels; interestingly, with only 6 samples of each group, while the control and CsA groups were unable to show significant Person’s correlation; in SRL group there was a good linearity (𝑟 = 0, 627, 𝑃 = 0, 183), which was even more evident and statistically significant, in the conversion group (𝑟 = 0.905, 𝑃 = 0.034).
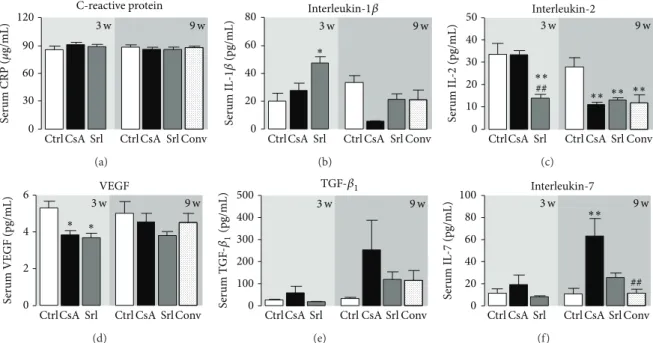
3.3. Serum Markers of Inflammation, Proliferation, and Angio-genesis. Unchanged values of serum hsCRP were found
∗ 3 w 9 w 3 2 1 0 Ctrl CsA Srl Ctrl CsA Srl Conv Ar te ri o los cler osis grade Arteriolosclerosis # V as cula r co n ge stio n grade ∗ Vascular congestion Vascular hyperemia 3 w 9 w 3 2 1 0 Ctrl CsA Srl Ctrl CsA Srl Conv Ar te ri o la r vac uo liza tio n grade Arteriolar vacuolization ∗∗∗ 3 2 1 0 Ctrl CsA Srl Ctrl CsA Srl Conv ∗ ∗ 3 w 9 w V as cula r h yp er emia grade ∗∗∗ 3 2 1 0 Ctrl CsA Srl Ctrl CsA Srl Conv 3 w 9 w ∗∗ ∗∗ §§ (a1) (a2) (a3) (a4) (a) M es an gial expa n sio n grade Mesangial expansion GBM thickening 2 1 0 Ctrl CsA Srl Ctrl CsA Srl Conv
Bowman capsule thickening
3 w 9 w B o wm an ca ps ule t hic kness grade 2 1 0 Ctrl CsA Srl Ctrl CsA Srl Conv
Vascular pole hyalinization
3 w 9 w V as cula r p o le h yaliniza tio n grade 2 1 0 Ctrl CsA Srl Ctrl CsA Srl Conv 3 w 9 w ∗∗ # ## ### ∗∗∗ ∗∗∗ ∗ G lo m er ula r ba sem en t mem b ra ne t hic k enin g grade # 2 1 0 Ctrl CsA Srl Ctrl CsA Srl Conv 3 w 9 w # (b1) (b2) (b3) (b4) § (b) ∗∗∗ ∗∗∗ ∗∗ # 3 2 1 0 Ctrl CsA Srl Ctrl CsA Srl Conv Tubular vacuolization 3 w 9 w T u b u la r vac uo liza tio n grade 2 1 0 Ctrl CsA Srl Ctrl CsA Srl Conv Inflammatory infiltration 3 w 9 w In fla mma to ry infil tra te grade ∗ H yaline c ylinder s grade Hyaline cylinders # 2 1 0 Ctrl CsA Srl Ctrl CsA Srl Conv 3 w 9 w Tubular calcification T u b u la r calcifica tio n grade ∗∗∗ ∗∗ 2 1 0 Ctrl CsA Srl Ctrl CsA Srl Conv 3 w 9 w ## ### § §§ (c1) (c2) (c3) (c4) (c)
Figure 1: Semiquantitative evaluation of vascular (a), glomerular (b), and tubulointerstitial (c) lesions. Each graphic represents one lesion for the 3 groups at week 3 (control, cyclosporin A, and sirolimus) and 4 groups at week 9 (control, cyclosporin A, sirolimus, and conversion). Values are mean± SEM.∗𝑃 < 0.05,∗∗𝑃 < 0.01, and∗∗∗𝑃 < 0.001 versus control;#𝑃 < 0.05 and###𝑃 < 0.001 versus cyclosporin; §𝑃 < 0.05
and§§𝑃 < 0.01 versus sirolimus. GBM thickening, glomerular basement membrane thickening.
the control group. However, serum IL-1𝛽 showed distinct patterns; in fact, SRL treatment was able to increase IL-1𝛽 levels in the short-term treatment and CsA to decrease
in the long-term use (Figures 5(a) and 5(b)). Serum IL-2
levels, which is simultaneously a marker of inflammation and immunosuppressive activity, decreased after 3 weeks of SRL treatment (𝑃 < 0.01). Identical reduction (𝑃 < 0.01) was found at 9 weeks for all the treated groups (CsA,
SRL, and conversion) versus the control one (Figure 5(c)).
Serum contents of the VEGF only decreased in the short-term treatment for both drugs, with unchanged values in long-term protocols. Serum TGF-beta levels showed a trend to increased values after 3 weeks, which was even more
pronounced after 9 weeks in the CsA group (Figures 5(e)
and5(f)). Interestingly, similar pattern was encountered for
serum IL-7 levels, showing significant correlation with serum
TGF-𝛽1contents in the short- and long-term treatments (𝑟 =
0.871, 𝑃 = 0.129; 𝑟 = 0.873, 𝑃 = 0.053, resp., in Person’s Test).
3.4. Kidney Gene Expression Evaluation. Several markers
of proliferation, fibrosis, inflammation, and angiogenesis were evaluated in terms of kidney mRNA expression in the weeks 3 and 9 for the three immunosuppressive protocols
in comparison to control group (Figure 6). After 3 weeks of
CsA treatment, a significant downregulation of the antigen identified by the monoclonal antibody Ki67 (MKi67) (𝑃 <
∗∗∗∗∗ 3 2 1 0 Ct rl CsA Srl Ct rl CsA Srl Con v ∗ 3 w 9 w V ascula r sc o ri n g
Periodic acid of Schiff staining
Masson’s trichrome staining
(a1) (a2) (a3) (a4) (a5) Total scores 25 𝜇m 25 𝜇m 25 𝜇m 25 𝜇m 2 1 0 Ct rl CsA Srl Ct rl CsA Srl Con v 3 w 9 w ∗∗∗ ∗∗ Total scores Glo m er ula r s co rin g ##
Periodic acid of Schiff staining
Masson’s trichrome staining
(b1) (b2) (b3) (b4) (b5) 25 𝜇m 25 𝜇m 25 𝜇m 25 𝜇m 2 1 0 Ct rl CsA Srl Ct rl CsA Srl Con v 3 w 9 w ∗∗∗ ∗∗ # T u b u la r s co rin g
Periodic acid of Schiff staining
Masson’s trichrome staining
(c1) (c2) (c3) (c4) (c5) Total scores 25 𝜇m 25 𝜇m 25 𝜇m 25 𝜇m
Figure 2: Total score of vascular (a1), glomerular (b1), and tubulointerstitial (c1) lesions and representative photomicrographs of kidney histomorphologic sections with PAS and Masson’s trichrome stainings. The image (a2) represents a normal kidney arteriole from the control group and A3an arteriolosclerosis lesion present in all the rats treated with CsA. (b2) and (b3) represent a normal capsule and a vascular pole hyalinization and Bowman’s capsule thickening from the CsA group, respectively. (c2) and (c3) images match normal tubules and tubular calcification in the kidney of CsA-treated rats, respectively. Representative photomicrographs of kidney histomorphologic sections with Masson’s trichrome staining for control ((a4), (b4), and (c4)) and CsA ((a5), (b5), and (c5)). CsA promotes collagen fibers deposition around arterioles, Bowman’s capsules, and tubules (fibrosis). Values are mean± SEM.∗𝑃 < 0.05,∗∗𝑃 < 0.01, and∗∗∗𝑃 < 0.001 versus the control group;#𝑃 < 0.05 and##𝑃 < 0.01 versus cyclosporin.
0.001), CRP (𝑃 < 0.01), TNF-alpha (𝑃 < 0.05), and VEGF
(𝑃 < 0.01) was found (Figure 6). However, IL-2, COX-2,
mTOR, and IL-1𝛽 remain unchanged. Furthermore, there was a significant overexpression of proliferating cell nuclear antigen (PCNA) and tumor protein p53 (TP53) mRNA (𝑃 < 0.001), accompanied by a slight increase (𝑃 < 0.05) in the
expression of TGF-𝛽1 and NF-𝜅B. On the other hand, the
mTOR inhibitor only stimulated the expression of TP53 gene
and downregulated some inflammatory markers (TNF-𝛼, COX-2, and IL-1𝛽). In the long-term CsA treatment, almost all the genes presented normal mRNA expression, when compared with the control group. However, a significant upregulation of IL-2, mTOR, and Mki67 was encountered. In the SRL and conversion groups only mTOR and Mki67 remained overexpressed, in contrast to what was observed with the short-term exposures.
Ctrl CsA Srl Ctrl CsA Srl Conv 3 w 9 w Serum creatinine 50 40 30 20 10 0 S er um cr ea tinine ( 𝜇 mol /L) (a)
Blood urea nitrogen 8 6 4 2 0 B UN (mmo l/L) Ctrl CsA Srl Ctrl CsA Srl Conv 3 w 9 w (b) GFR (mL/h) GFR 50 100 150 0 Ctrl CsA Srl Ctrl CsA Srl Conv 3 w 9 w (c) Creatinine clearance 200 150 100 50 0 Cr c le ara nce (mL/h) Ctrl CsA Srl Ctrl CsA Srl Conv 3 w 9 w (d)
Urea nitrogen clearance 100 80 60 40 20 0 B UN c le ara nce (mL/h) Ctrl CsA Srl Ctrl CsA Srl Conv 3 w 9 w (e) Ctrl CsA Srl Ctrl CsA Srl Conv 3 w 9 w Urinary protein 500 400 300 200 100 0 U rina ry p ro tein (m g/dL) ∗# (f) Kidney TBARs 1.2 0.9 0.6 0.3 0.0 K idne y TB ARs ( 𝜇 g/g tissue) Ctrl CsA Srl Ctrl CsA Srl Conv 3 w ∗ 9 w (g) TBARs clearance 5 4 3 2 1 0 TB ARs c le ara nce (mL/h/ra t) Ctrl CsA Srl Ctrl CsA Srl Conv 3 w 9 w ∗ (h) Kw/Bw 5 4 3 2 1 0 L eft kidne y/b o d y w eig h t (g/kg) ∗ Ctrl CsA Srl CtrlCsA Srl Conv 3 w 9 w (i)
Figure 3: Serum, urine, and kidney markers of renal function. Creatinine serum levels (a) and clearance (d), blood urea nitrogen levels (c) and clearance (f), glomerular filtration rate (c) and urinary protein (f), kidney lipid peroxidation (malondialdehyde levels) (g), malondialdehyde clearance (h), and kidney weight/body weight ratio (i), at week 3 and week 9 for all treatments. Values are mean± SEM.∗𝑃 < 0.05 versus control;#𝑃 < 0.05 versus cyclosporin.
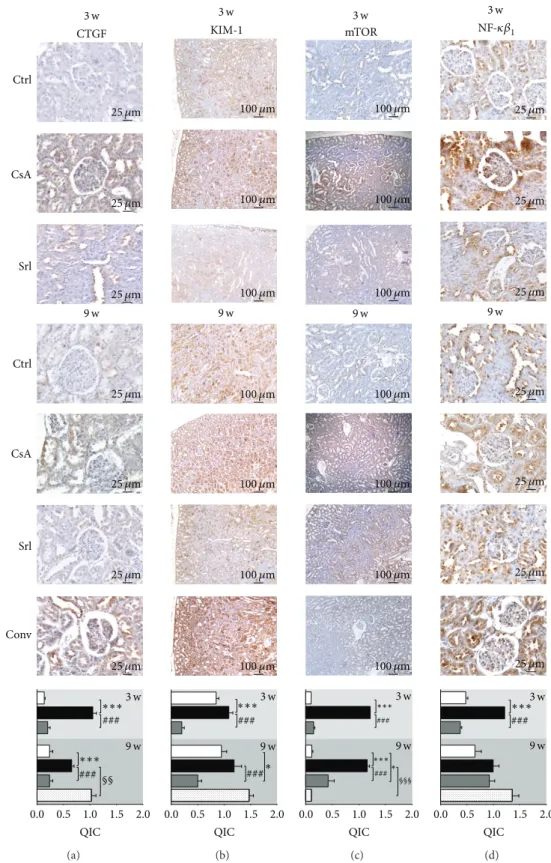
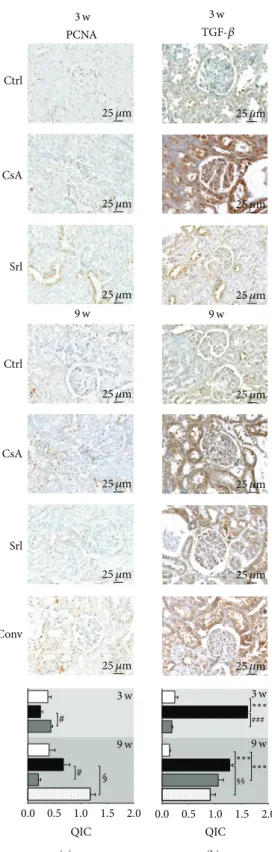
3.5. Kidney Protein Expression Evaluation. Short-term CsA
treatment increased CTGF, KIM-1, mTOR, NF-𝜅𝛽1 , and
TGF-𝛽 (𝑃 < 0.001) protein expression, when compared to control, while SRL treatment was unable to promote
changes on the expression of these proteins (Figures 7
and8). Long-term treatment with CsA promoted increased
expression of mTOR, TGF-𝛽, and CTGF, versus the con-trol group, but the last two proteins present less area and stain intensity (QIC score) when compared to the short-term (3 weeks) CsA treatment. Kidney KIM-1,
NF-𝜅𝛽1, and PCNA expression were unchanged in the
CsA-treated rats when compared with the control animals. SRL treatment promoted, after 9 weeks, a decreased KIM-1 expression and overexpression of TGF-𝛽. In the conver-sion protocol, CTGF and PCNA protein overexpresconver-sion was obtained, but mTOR and TGF-𝛽 expression were sig-nificantly reduced when compared with the CsA group
(Figures7and8).
4. Discussion
Monitoring immunosuppressive therapy in solid organ trans-plant patients is based on measuring putative indicators of allograft rejection, as well as on regularly assessing drug blood levels, which should be maintained within the estab-lished therapeutic range for the drug in order to maintain immunosuppressive efficacy without excessive/undesirable side-effects. Drug-related nephrotoxicity evaluation has been mainly based on classical serum measures of renal function, which are easier to perform and less expensive; however, an increasing amount of evidence suggests that these markers cannot accurately reflect the renal function status at a given time point of drug use. In fact, traditional markers of nephrotoxicity, such as increased BUN or serum creatinine, have been reported as insensitive, only indicating damage
when 70–80% of renal epithelial mass has been lost [31,32].
Urine NGAL 3 2 1 0 U rine N GAL (pg/mL) ∗∗∗ Ctrl CsA Srl Conv 9 w # (a) Serum NGAL 0.4 0.3 0.2 0.1 0.0 S er um N GAL (pg/mL) Ctrl CsA Srl Conv 9 w # ∗ ∗∗ (b) NGAL clearance 6 4 2 0 N GAL c le ara nce (mL/h) Ctrl CsA Srl Conv 9 w ∗ (c) Ctrl:r = −0.162; P = 0.759 CsA:r = 0.409; P = 0.494 Ctrl CsA Srl Conv Ctrl CsA Srl Conv 0.5 0.4 0.3 0.2 0.1 0.0 0 1 2 3 4 S er um N GAL ( 𝜇 g/mL)
Serum-urine NGAL Pearson’s correlation
Urine NGAL (𝜇g/mL)
Srl:r = 0.627; P = 0.183
Conv:r = 0.905; P = 0.034
(d)
Figure 4: Serum and urine NGAL correlation as kidney marker of toxicity. Urine (a), serum NGAL (b), and clearance (c) at week 9. Values are mean± SEM. Correlation and 𝑃 value of urine and serum NGAL are shown in (d).∗𝑃 < 0.05,∗∗𝑃 < 0.01, and∗∗∗𝑃 < 0.001 versus the control group;#𝑃 < 0.05 versus cyclosporin A.
as a choice to access drug-related toxicity; however, detection of enzymes and other proteins can be difficult due to their
instability and high variability levels in urine [32]. Identifying
potentially useful biomarkers in peripheral blood and urine, compared to kidney tissue markers (gene or protein), will be clinically very important. The current study was intended to clarify the pathways of nephropathy evolution in a protocol of conversion from CsA to SRL in the rat, focusing on serum, urine, and renal (gene and protein) tissue samples, as well as to elucidate the involvement of several emergent biomarkers of renal damage which are putative candidates to act as players in the evolution from renal dysfunction to nephrotoxicity.
In our study, the classical serum and urine markers were unable to accurately reflect the changes on renal function after both the short- and long-term treatments, despite the presence of renal lesion, which were more pronounced for the longer CsA exposure; that failure demonstrates the need of better biomarkers of renal dysfunction/damage. Regarding
renal pathology characterization, we found that vessels are the first renal structures affected by CsA use, after just 3 weeks of treatment, as shown by the presence of some lesions, such as vascular hyperemia and arteriolar vacuoliza-tion (that might be related to hypertension appearance); the lesions were further aggravated with prolonged CsA exposure. This data complements the information that the first CsA pathologic events are related to afferent arteriolar vasoconstriction, thrombotic microangiopathy, and isomeric
tubular vacuolization [33]. In addition, acute CsA events are
related to decreased vasodilation and unopposed vasocon-striction and free radical formation, which are among the main mechanisms underlying development of hypertension
and decreased GFR [34]. SRL has been described as a less
nephrotoxic agent than CsA [20], which explains the fact
that mTOR inhibitors have been used to replace CsA [9,11].
According to our data, SRL induces less toxicity in vascular, glomerular, and tubular fields than CsA, and this factor leads to a better profile in the conversion group; however, tubular
C-reactive protein 120 90 60 30 0 S er um CRP ( 𝜇 g/mL) Ctrl CsA Srl Ctrl CsA Srl Conv 3 w 9 w (a) Interleukin-1𝛽 80 60 40 20 0 S er um IL -1𝛽 (pg/mL) Ctrl CsA Srl Ctrl CsA Srl Conv 3 w 9 w ∗ (b) Interleukin-2 S er um IL -2 (pg/mL) 50 40 30 20 10 0 Ctrl CsA Srl CtrlCsA Srl Conv 3 w 9 w ∗∗ ∗∗ ∗∗ ∗∗ ## (c) VEGF 6 4 2 0 S er um VEGF (pg/mL) Ctrl CsA Srl CtrlCsA Srl Conv 3 w 9 w ∗ ∗ (d) TGF-𝛽1 500 400 300 200 100 0 S er um T G F -𝛽1 (pg/mL) Ctrl CsA Srl Ctrl CsA Srl Conv 3 w 9 w (e) Interleukin-7 100 80 60 40 20 0 S er um IL -7 (pg/mL) Ctrl CsA Srl Ctrl CsA Srl Conv 3 w 9 w ∗∗ ## (f)
Figure 5: Serum markers of inflammation, proliferation, and angiogenesis. C-reactive protein (a), interleukin-1𝛽 (b), interleukin-2 (c), vascular endothelial growth factor (d), transforming growth factor beta-1 (e), and interleukin-7 (f). Values are mean± SEM.∗𝑃 < 0.05 versus control;#𝑃 < 0.05 versus cyclosporin A.
vascular congestion and hyperemia were not prevented when using SRL after CsA. Overall, we can conclude that total vascular scoring in the conversion group remained similar to the CsA group, but glomerular and tubular lesions scores were clearly reduced due to conversion to SRL. In addition, in the CsA-treated rats there was development of kidney fibrosis through collagen formation and deposition around vessels and tubules, together with bowman’s capsules thickening. SRL, per se, or even after CsA treatment, was unable to present fibrosis or collagen deposition.
After 3 weeks of CsA exposure very slight changes on tissue structure were found, with absent or only mild lesions; however, after the long-term CsA exposure, signifi-cant glomerular, tubular, and vascular lesions were observed. In spite of that, at week 9 renal markers used in clinical practice (GFR, creatinine and BUN contents and clearances) appeared only modestly changed. Additionally, we observed an interesting variation of MDA clearance levels between 3 and 9 weeks of CsA treatment, when renal lesions were clearly noted. Knight et al. detected high MDA levels in urine of transplanted patients, but they were unable to
explain their importance [35]. Our data suggests that MDA
clearance could be a predictive marker of CsA-induced nephrotoxicity, as increased MDA clearance appears at the same time point as the first kidney lesions. Oxidative stress can promote the formation/release of a variety of vasoactive
mediators [36] that can affect renal function directly by
causing renal vasoconstriction or decreasing the glomerular capillary ultrafiltration coefficient, thus reducing the GFR. Moreover, the relationship between proteinuria and CsA-evoked nephrotoxicity is complex, limiting its power as an
early marker [13]. Lipid peroxidation occurs as a result
of multiunsaturated lipids reacting with oxidizing agents,
promoting oxidative stress in the kidney structures. Urinary MDA reflects the presence of renal damage, which may be the cause or the consequence of lipid peroxidation, and the correlation between MDA clearance and kidney lesion grade could be a good strategy to identify early CsA-induced nephrotoxicity. The presence of slight or low grade lesions on the chronic SRL treatment and in the conversion protocol groups reinforces this idea, because no significance increase was found in MDA clearance for both groups.
The development of noninvasive biomarker that could diagnose renal dysfunction early and also monitor the response to therapy, as well as the ability to predict severity and outcome, would be very valuable. It is also important to recognize that changes in serum creatinine and BUN con-centrations primarily reflect functional changes in filtration
capacity and are not genuine injury markers [37]. During the
last years, there has been an effort to identify better accurate biomarkers of acute CsA-induced nephrotoxicity. Gelatinase-associated lipocalin (NGAL) has been indicated as an acute
marker of nephrotoxicity [38,39]. NGAL in urine and plasma
could have a 10,000-fold and 100-fold concentration rise, respectively, from normal levels in cases of renal injury. This could make NGAL a potentially very sensitive marker of different degrees of renal wound. However, according to our data, short- and long-term CsA treatments (clearly described as a nephrotoxic drug) were unable to promote increased serum and urine NGAL levels. Curiously, urine and serum samples presented linearity in the SRL group and a strong correlation in the conversion group. SRL is described in the literature as a less nephrotoxic agent than the calcineurin inhibitors, but one of the effects better described is the
devel-opment of SRL-evoked proteinuria [40, 41]. The elevation
∗∗∗ Ctrl CsA Srl Ctrl CsA Srl Conv 3 w 9 w PCNA 2.0 1.5 1.0 0.5 0.0 −0.5 −1.0 PCN A (CNR Q) ### (a) ∗∗∗ Ctrl CsA Srl Ctrl CsA Srl Conv 3 w 9 w TP53 1.5 1.0 0.5 0.0 −0.5 TP 53 (CNR Q) # ∗ (b) mTOR 2 1 0 −1 −2 m T O R (CNR Q) Ctrl CsA Srl Ctrl CsA Srl Conv 3 w 9 w # ∗ ∗ (c) Ctrl CsA Srl Ctrl CsA Srl Conv 3 w 9 w ### TGF-𝛽1 1.5 1.0 0.5 0.0 −0.5 −1.0 TG F -𝛽1 (CNR Q) ∗ (d) NF-𝜅𝛽 1.0 0.5 0.0 −0.5 −1.0 Ctrl CsA Srl Ctrl CsA Srl Conv 3 w 9 w ###∗ ∗ NF -𝜅𝛽 1 (CNR Q) (e) Mki67 2 1 0 −1 −2 Mki 67 (CNR Q) ∗∗∗∗∗∗ ∗∗∗ Ctrl CsA Srl Ctrl CsA Srl Conv 3 w 9 w ### (f) CRP 0.5 0.0 −0.5 −1.0 −1.5 CRP (CNR Q) Ctrl CsA Srl Ctrl CsA Srl Conv 3 w 9 w ### ∗∗ (g) TNF-𝛼 1 0 −1 −2 −3 −4 TNF -𝛼 (CNR Q) ∗∗∗ Ctrl CsA Srl Ctrl CsA Srl Conv 3 w 9 w ∗ (h) IL-2 3 2 1 0 −1 IL -2 (CNR Q) Ctrl CsA Srl Ctrl CsA Srl Conv 3 w 9 w # ∗ (i) COX-2 1.5 1.0 0.5 0.0 −0.5 −1.0 −1.5 CO X -2 (CNR Q) ∗ Ctrl CsA Srl Ctrl CsA Srl Conv 3 w 9 w (j) IL-1𝛽 1.0 0.5 0.0 −0.5 −1.0 −1.5 IL -1𝛽 (CNR Q) Ctrl CsA Srl Ctrl CsA Srl Conv 3 w 9 w ∗∗ ## (k) VEGF 1.0 0.5 0.0 −0.5 −1.0 VEGF (CNR Q) ### ∗∗ Ctrl CsA Srl Ctrl CsA Srl Conv 3 w 9 w (l)
Figure 6: Kidney mRNA expression of proliferation, inflammation, and angiogenesis mediators. PCNA (a), TP53 (b), mTOR (c), TGF-𝛽1
(d), NF-𝜅B (e), and Mki67 (f) as proliferation status markers; CRP (g), TNF-𝛼 (h), IL-2 (i), COX-2 (j), and IL-1𝛽 (k) as inflammation status markers and VEGF (l) as angiogenesis status marker. Values are mean of CNRQ (calibrated normalized relative quantities) of the control ± SEM.∗𝑃 < 0.05,∗∗𝑃 < 0.01, and∗∗∗𝑃 < 0.001 versus control;#𝑃 < 0.05,##𝑃 < 0.01, and###𝑃 < 0.001 versus cyclosporin A. COX-2,
ciclooxigenase-2; CRP, C-reactive protein; IL-1𝛽, interleukin-1 beta; IL-2, interleukin-2; MKi67, antigen identified by monoclonal antibody Ki-67; mTOR, mammalian target of rapamycin; NF-𝜅B, nuclear factor kappa B; PCNA, proliferating cell nuclear antigen; TGF-𝛽1, transforming growth factor beta 1; TNF-𝛼, tumor necrosis factor alpha; TP53, tumor protein p53; VEGF, vascular epidermal growth factor.
our study could be related to the proteinuria appearance. Recently, a mouse mTOR knockout model revealed accumu-lation of autolysosomal vesicle in podocytes that potentiated
proteinuria appearance [41] and reduced AKT activity, thus
affecting podocyte cytoskeleton [42]. Moreover, concerning
the tubular field, mTOR inhibition by using rapamycin has a role in the protein transport because it reduces tubular protein reabsorption that contributes to increasing urinary
protein levels [43]. Furthermore, angiotensin II receptor
blocker can counteract the effect of sirolimus, not only through hemodynamic changes but also partly by repairing
the injury of podocytes [40].
In our study, a trend to increased serum and kidney
TGF-𝛽1 was found in the CsA-treated rats, starting after just 3
weeks and aggravating with prolonged exposure, suggesting this factor as a putative good biomarker of nephrotoxicity
∗∗∗ ### ∗∗∗ ### 3 w 3 w 9 w 9 w 0.0 0.5 1.0 1.5 2.0 QIC CTGF Ctrl CsA Srl Ctrl CsA Srl Conv §§ 25 𝜇m 25 𝜇m 25 𝜇m 25 𝜇m 25 𝜇m 25 𝜇m 25 𝜇m (a) ∗∗∗ ### ### 3 w 9 w ∗ 0.0 0.5 1.0 1.5 2.0 QIC 3 w 9 w KIM-1 100 𝜇m 100 𝜇m 100 𝜇m 100 𝜇m 100 𝜇m 100 𝜇m 100 𝜇m (b) 3 w 9 w 3 w 9 w ∗∗∗ ∗∗∗ ### ### ∗ 0.0 0.5 1.0 1.5 2.0 QIC mTOR §§§ 100 𝜇m 100 𝜇m 100 𝜇m 100 𝜇m 100 𝜇m 100 𝜇m 100 𝜇m (c) 3 w 9 w ∗∗∗ ### 0.0 0.5 1.0 1.5 2.0 QIC 3 w 9 w NF-𝜅𝛽1 25 𝜇m 25 𝜇m 25 𝜇m 25 𝜇m 25 𝜇m 25 𝜇m 25 𝜇m (d)
Figure 7: Kidney protein expression by immunohistochemistry. CTGF (a), KIM-1 (b), mTOR (c), and NF-𝜅B1 (d). Each figure is
representative of the groups at week 3 (control, cyclosporin A, and sirolimus) and 4 groups at week 9 (control, cyclosporin A, sirolimus, and conversion). CTGF, connective tissue growth factor; KIM-1, kidney injury molecule-1; mTOR, mammalian target of rapamycin; NF-𝜅B1, nuclear factor kappa beta-1.
# # 0.0 0.5 1.0 1.5 2.0 QIC 3 w 9 w 3 w 9 w Ctrl CsA Srl Ctrl CsA Srl Conv PCNA § 25 𝜇m 25 𝜇m 25 𝜇m 25 𝜇m 25 𝜇m 25 𝜇m 25 𝜇m (a) ∗∗∗ ∗∗∗ ∗∗∗ ### 0.0 0.5 1.0 1.5 2.0 QIC 3 w 9 w 3 w 9 w TGF-𝛽 §§ 25 𝜇m 25 𝜇m 25 𝜇m 25 𝜇m 25 𝜇m 25 𝜇m 25 𝜇m (b)
Figure 8: Kidney protein expression by immunohistochemistry. PCNA (a) and TGF-𝛽1(b). Each figure is representative of the groups at week 3 (control, cyclosporin A, and sirolimus) and 4 groups at week 9 (control, cyclosporin A, sirolimus, and conversion). PCNA, proliferating cell nuclear antigen; TGF-𝛽1, transforming growth factor beta 1.
progression. Interestingly, similar pattern was encountered for serum IL-7 levels, showing significant correlation with
serum TGF-𝛽1 contents in the short- and long-term
treat-ments. IL-7 is produced constitutively by stromal cells and consumed by the available pool of resting T cells, all of which express the IL-7 receptor (IL-7R) at high levels except
for CD4+ CD25+ regulatory T cells. Circulating IL-7 levels
increase during periods of lymphopenia to maintain na¨ıve T-cell homeostasis and support the thymic-independent peripheral expansion and maintenance of mature T cells
[44] because they upregulate bcl-2 protein that has
anti-apoptotic properties [45, 46]. CsA treatment decreases the
immune system, specially T-cells number and activation, but alternatively the remaining immune cells can counterwork the immunologic depression by increasing IL-7 levels which could be correlated with the progression of chronic kidney disease in this study.
Changes in messenger RNA expression are considered to be one of the earliest events, which may occur in response to cellular and tissue damage; it has been speculated that these biomarkers might help to predict adverse effects before dam-age is indicated by the current gold standard markers (clinical chemistry and histopathology). Current theories point that renal damage is caused by nonimmunological factors, such as ischemia, which lead to activation of various proinflam-matory and profibrotic mediators. A parallel concept of how CsA might induce renal injury was described by Li and Yang, suggesting that kidney damage involves activation of the innate immune response that causes NF-𝜅𝛽 activation and induces dendritic cell maturation and T-lymphocyte infiltration into the graft, with both pathways ultimately resulting in interstitial inflammation and interstitial fibrosis
that contributes to chronic nephropathy [47]. In agreement,
our data confirm that CsA toxicity might start with increased NF-𝜅𝛽 gene (RT-qPCR) and protein (immunohistochem-istry) overexpression after 3 weeks of CsA treatment, an effect that is then downregulated with prolonged exposure. SRL treatment reduced mRNA levels, resulting in normal protein expression, when compared to control, both in short-and long-term treatments, indicating that this nuclear factor could have an important impact in the development of nephrotoxicity. At the end of the conversion protocol (CsA replaced by SRL), no difference was found in gene expression but protein overexpression remained in the tubulointerstitial region, most probably because of the previous CsA exposure. In our animal model, the short-term CsA treatment was
mainly associated with upregulation of TGF-𝛽1and PCNA
in the kidney tissue, which has been identified as the key
mediator of fibrosis and proliferation [47, 48]. However,
these changes were accompanied by a putative compensatory response, since markers of inflammation (including COX2, TNF-𝛼, and CRP), as well as of cellular proliferation (MKi67) and angiogenesis (VEGF), were downregulated, perhaps responsible for the attenuation of the cytotoxic effects of CsA in the short term. The overexpression of NF-𝜅𝛽 and TP53 might be included in this compensatory response, since
they inhibit mTOR [49]. Short-term SRL treatment revealed
acute anti-inflammatory, antifibrotic, and antiproliferative properties, viewed by the downregulation of kidney mRNA
levels of TNF-𝛼, COX2, IL-1𝛽, TGF-𝛽1, NF-𝜅𝛽, and mTOR.
Nevertheless, during prolonged CsA exposure, nephrotoxic-ity evolves, as viewed by the degree of increased histological lesions, which seems to be associated with other molecular pathways and mediators. In fact, there was a significant overexpression of MKi67, contrary to what was observed after the short-term treatment, suggesting a depletion of counter-regulatory responses, which was accompanied by a parallel increase in mTOR expression, a serine/threonine protein kinase, important in regulating cell growth, proliferation,
motility, survival, protein synthesis, and transcription [48].
As Lieberthal and Levine demonstrated, mTOR plays an important role in mediating the process of regeneration and recovery, depending on the kidney damage extension
[50]. Moreover, mTOR activity is low or absent in the
normal kidney but increases markedly after acute kidney injury. In agreement, mTOR inhibition has been associated with amelioration of kidney fibrosis, glomerulosclerosis, and interstitial inflammation, having an important role in distinct
renal diseases [50–52]. In our study, protein expression
assessed by immunostaining revealed increased mTOR in the CsA-treated rats, which is in agreement with a previous study that suggested mTOR overexpression in CsA-treated rats, resulting in podocyte epithelial to mesenchymal transition
leading to glomerular damage [53]. In addition, while normal
kidney mTOR expression was found in the SRL-treated rats, there was an important decreased kidney expression in the conversion protocol group, which might explain the reduced lesions found when compared with the CsA monotherapy group.
In the last years, some toxicological studies showed hypo-thetical biomarkers that could predict acute nephropathy
[32,37,54]. However, those studies were unable to assess if
they could be viewed also as markers of chronic toxicity. Due to its functional reserve, minor effects on kidney function are too difficult to detect. Kidney injury molecule-1 (KIM-1) is a type 1 transmembrane protein expressed in the proximal tubules and further excreted in the urine; in the last years, KIM-1 has been pointed as a possible marker of renal injury in acute models. This factor has a role in proliferation and
tissue repair [32,55] because it confers phagocytic capacity to
clear cell debris [56]. In our study, KIM-1 staining occurred
in proximal tubule epithelial cells and might putatively be indicated as one of the most sensitive markers of tissue injury, in agreement with the previous suggestion of Rached et al.
when studying nephrotoxin ochratoxin A [32]. In our study,
after 3 weeks of CsA treatment, intense KIM-1 staining was found in the proximal tubules, but not after 9 weeks, when less stain intensity was found in all proximal tubules, suggesting that KIM-1 could be viewed as a putative good marker of acute CsA toxicity (without structural lesions), but not as a biomarker of chronic CsA treatment nephrotoxicity. KIM-1 is downexpressed in the kidneys of SRL-treated rats; however, when SRL was used to replace CsA (conversion group), a similar expression was found to that encountered for the CsA-treated rats after 3 weeks, suggesting that previous CsA exposure damaged some proximal tubules in an irreversible manner.
Connective tissue growth factor (CTGF) is a polypeptide implicated in the extracellular matrix synthesis that belongs
to a profibrotic signalling (TGF-𝛽1downstream modulator)
and has been pointed as a possible biomarker of CsA-evoked damage. In our model, kidney CTGF expression increased after short- and long-term treatment with CsA, in
agreement with the kidney overexpression of TGF-𝛽1viewed
by immunohistochemistry. After a longer CsA exposure the kidney expression of CTGF was slightly reduced, which might be explained by an increased urinary elimination, as previously suggested by O’Connell et al. in another
experi-mental study [18]. SRL treatment per se does not promote
any significant CTGF expression when compared with the control, in agreement with the absence of fibrosis or collagen deposition in the SRL-treated rats, as previously mentioned. However, SRL treatment after CsA therapy (Conversion pro-tocol) was unable to restore basal levels of CTGF, suggesting that, once again, some of the lesions induced by CsA are maintained after the conversion for SRL.
In chronic kidney disease, rapamycin was able to slow the progression of renal fibrosis and delayed the onset of renal failure, through reduction of glomerular hypertrophy, decrease of proinflammatory and profibrotic cytokines
pro-duction, and decline in interstitial inflammation [48]. As
previously suggested, rapamycin is less fibrogenic than CsA
[20], which is in agreement with the reduced kidney damage
in the conversion protocol of our study. Our results reinforce the rationale for the early substitution of CsA by SRL, not only because longer CsA exposure is notoriously more deleterious, promoting structural kidney deterioration, but also because mTOR overexpression seems to be a feature of the chronic CsA exposure.
5. Conclusions
This experimental study demonstrated that CsA-induced nephrotoxicity is significantly aggravated over time and distinct mechanisms seem to underlie short- and long-term renal toxicity. The currently used clinical techniques and biomarkers, namely of biochemical impairment (such as serum and urine creatinine and BUN contents and clearance), if coupled with genetic and protein analysis in different samples, will bring more accuracy to early detect and follow up the appearance and development of nephrotoxicity. Conversion to SRL prevented CsA-induced renal damage evolution, which is better viewed by nontraditional, emergent biomarkers including serum TGF-𝛽 and IL-7, TBARs clear-ance, and kidney TGF-𝛽 and mTOR, while NGAL (serum versus urine) seems to be a feasible indicator of substitution to the mTOR inhibitor.
Conflict of Interests
The authors declare that they have no conflict of interests.
Authors’ Contribution
Jos´e Sereno, Fedrerico Teixeira, and Fl´avio Reis conceived and designed the study protocol. Jos´e Sereno, Sara Nunes,
Paulo Rodrigues-Santos, Helena Vala, Petronila Rocha-Pereira, Jo˜ao Fernandes, and Alice Santos-Silva performed experiments. Jos´e Sereno, Frederico Teixeira, and Fl´avio Reis analysed the data and prepared the paper. All authors have read and approved the paper.
Acknowledgment
This work was supported by the Ph.D. research Grant from the Portuguese Foundation for Science and Technology (SFRH/BD/63962/2009), Strategic Project PEst-C/SAU/UI-3282/2011-COMPETE.
References
[1] E. W. Young, C. N. Ellis, J. M. Messana et al., “A prospective study of renal structure and function in psoriasis patients treated with cyclosporin,” Kidney International, vol. 46, no. 4, pp. 1216–1222, 1994.
[2] K. Paziana, M. del Monaco, E. Cardonick et al., “Ciclosporin use during pregnancy,” Drug Safety, vol. 36, pp. 279–294, 2013. [3] Y. Lebranchu, A. Thierry, E. Thervet et al., “Efficacy and safety
of early cyclosporine conversion to sirolimus with continued MMF-four-year results of the postconcept study,” The American Journal of Transplantation, vol. 11, no. 8, pp. 1665–1675, 2011. [4] S. C. Textor, S. J. Taler, V. J. Canzanello, L. Schwartz, and
J. E. Augustine, “Posttransplantation hypertension related to calcineurin inhibitors,” Liver Transplantation, vol. 6, no. 5, pp. 521–530, 2000.
[5] K. C. Mange, B. Cizman, M. Joffe, and H. I. Feldman, “Arterial hypertension and renal allograft survival,” Journal of the Amer-ican Medical Association, vol. 283, no. 5, pp. 633–638, 2000. [6] D. Cattaneo, N. Perico, F. Gaspari, and G. Remuzzi,
“Nephro-toxic aspects of cyclosporine,” Transplantation Proceedings, vol. 36, supplement, no. 2, pp. S234–S239, 2004.
[7] C. D. Dummer, V. N. Carpio, L. F. S. Gonc¸alves, R. C. Manfro, and F. V. Veronese, “FOXP3+ regulatory T cells: from sup-pression of rejection to induction of renal allograft tolerance,” Transplant Immunology, vol. 26, no. 1, pp. 1–10, 2012.
[8] A. G. Barbari, A. G. Stephan, and M. A. Masri, “Calcineurin inhibitor-free protocols: risks and benefits,” Saudi Journal of Kidney Diseases and Transplantation, vol. 18, no. 1, pp. 1–23, 2007.
[9] A. Mota, “Sirolimus: a new option in transplantation,” Expert Opinion on Pharmacotherapy, vol. 6, no. 3, pp. 479–487, 2005. [10] A. Gordois, M. Nobes, M. Toohey, and G. Russ,
“Cost-effectiveness of sirolimus therapy with early cyclosporin with-drawal vs. long-term cyclosporin therapy in Australia,” Clinical Transplantation, vol. 20, no. 4, pp. 526–536, 2006.
[11] J. M. Campistol, P. Cockwell, F. Diekmann et al., “Practi-cal recommendations for the early use of m-TOR inhibitors (sirolimus) in renal transplantation,” Transplant International, vol. 22, no. 7, pp. 681–687, 2009.
[12] M. R. Weir, F. Diekmann, S. M. Flechner et al., “MTOR inhibi-tion: the learning curve in kidney transplantation,” Transplant International, vol. 23, no. 5, pp. 447–460, 2010.
[13] S. O’Connell, C. Slattery, M. P. Ryan, and T. McMorrow, “Iden-tification of novel indicators of cyclosporine A nephrotoxicity in a CD-1 mouse model,” Toxicology and Applied Pharmacology, vol. 252, no. 2, pp. 201–210, 2011.
[14] L. J. Lesko and J. Atkinson A.J., “Use of biomarkers and surrogate endpoints in drug development and regulatory deci-sion making: criteria, validation, strategies,” Annual Review of Pharmacology and Toxicology, vol. 41, pp. 347–366, 2001. [15] Y. Jiang, D. L. Gerhold, D. J. Holder et al., “Diagnosis of
drug-induced renal tubular toxicity using global gene expression profiles,” Journal of Translational Medicine, vol. 5, article 47, 2007.
[16] S. J. Hu, R. Fernandez, and J. W. Jones Jr., “Cyclosporine A stimulates proliferation of vascular smooth muscle cells and enhances monocyte adhesion to vascular smooth muscle cells,” Transplantation Proceedings, vol. 31, no. 1-2, pp. 663–665, 1999. [17] F. N. F. Reis, “The unsolved cyclosporine-induced kidney injury:
is paricalcitol a feasible new renoprotective option?” Kidney international, vol. 77, no. 12, pp. 1055–1057, 2010.
[18] S. O’Connell, N. Tuite, C. Slattery, M. P. Ryan, and T. McMor-row, “Cyclosporine A-induced oxidative stress in human renal mesangial cells: a role for ERK 1/2 MAPK signaling,” Toxicolog-ical Sciences, vol. 126, no. 1, pp. 101–113, 2012.
[19] B. H. Chung, S. W. Lim, K. C. Doh, S. G. Piao, S. B. Heo, and C. W. Yang, “Human adipose tissue derived mesenchymal stem cells aggravate chronic cyclosporin nephrotoxicity by the induction of oxidative stress,” PLoS ONE, vol. 8, Article ID e59693, 2012.
[20] L. Luo, Z. Sun, and G. Luo, “Rapamycin is less fibrogenic than Cyclosporin A as demonstrated in a rat model of chronic allograft nephropathy,” Journal of Surgical Research, vol. 179, pp. E255–E263, 2013.
[21] D. A. Hesselink, R. Bouamar, and T. Van Gelder, “The phar-macogenetics of calcineurin inhibitor-related nephrotoxicity,” Therapeutic Drug Monitoring, vol. 32, no. 4, pp. 387–393, 2010. [22] L. Luo, Z. Sun, W. Wu, and G. Luo, “Mycophenolate mofetil
and FK506 have different effects on kidney allograft fibrosis in rats that underwent chronic allograft nephropathy,” BMC Nephrology, vol. 2, pp. 13–53, 2012.
[23] N. Pallet, M. Rabant, Y.-C. Xu-Dubois et al., “Response of human renal tubular cells to cyclosporine and sirolimus: a toxicogenomic study,” Toxicology and Applied Pharmacology, vol. 229, no. 2, pp. 184–196, 2008.
[24] S. Berzal, M. Alique, M. Rui Ortega, J. Egido, A. Ortiz, and A. M. Ramos, “GSK3, snail, and adhesion molecule regulation by cyclosporine A in renal tubular cells,” Toxicological Sciences, vol. 127, pp. 425–437, 2012.
[25] N. Martin-Martin, C. Slattery, T. McMorrow, and M. P. Ryan, “TGF-𝛽1 mediates sirolimus and cyclosporine a-induced alter-ation of barrier function in renal epithelial cells via a non-canonical ERK1/2 signaling pathway,” The American Journal of Physiology—Renal Physiology, vol. 301, no. 6, pp. F1281–F1292, 2011.
[26] J. Sereno, B. Parada, P. Rodrigues-Santos et al., “Serum and renal tissue markers of nephropathy in rats under immunosuppres-sive therapy: cyclosporine versus sirolimus,” Transplantation Proceedings, vol. 45, no. 3, pp. 1149–1156, 2013.
[27] J. Sereno, A. M. Rom˜ao, B. Parada et al., “Cardiorenal benefits of early versus late cyclosporine to sirolimus conversion in a rat model,” Journal of Pharmacology and Pharmacotherapeutics, vol. 3, no. 2, pp. 143–148, 2012.
[28] S. Pestel, V. Krzykalla, and G. Weckesser, “Measurement of glomerular filtration rate in the conscious rat,” Journal of Pharmacological and Toxicological Methods, vol. 56, no. 3, pp. 277–289, 2007.
[29] J. Vandesompele, K. de Preter, F. Pattyn et al., “Accurate nor-malization of real-time quantitative RT-PCR data by geometric averaging of multiple internal control genes,” Genome Biology, vol. 3, research0034.1, 2002.
[30] K. J. Livak and T. D. Schmittgen, “Analysis of relative gene expression data using real-time quantitative PCR and the 2-ΔΔCT method,” Methods, vol. 25, no. 4, pp. 402–408, 2001. [31] W. K. Han, V. Bailly, R. Abichandani, R. Thadhani, and J.
V. Bonventre, “Kidney Injury Molecule-1 (KIM-1): A novel biomarker for human renal proximal tubule injury,” Kidney International, vol. 62, no. 1, pp. 237–244, 2002.
[32] E. Rached, D. Hoffmann, K. Blumbach, K. Weber, W. Dekant, and A. Mally, “Evaluation of putative biomarkers of nephro-toxicity after exposure to ochratoxin a in vivo and in vitro,” Toxicological Sciences, vol. 103, no. 2, pp. 371–381, 2008. [33] M. Naesens, D. R. J. Kuypers, and M. Sarwal, “Calcineurin
inhibitor nephrotoxicity,” Clinical Journal of the American Soci-ety of Nephrology, vol. 4, no. 2, pp. 481–508, 2009.
[34] J. B. Roullet, H. Xue, D. A. McCarron, S. Holcomb, and W. M. Bennett, “Vascular mechanisms of cyclosporin-induced hypertension in the rat,” Journal of Clinical Investigation, vol. 93, no. 5, pp. 2244–2250, 1994.
[35] J. A. Knight, A. K. Cheung, R. K. Pieper, and K. Servilla, “Increased urinary lipoperoxide levels in renal transplant patients,” Annals of Clinical and Laboratory Science, vol. 19, no. 4, pp. 238–241, 1989.
[36] E. C. Garcia-Cohen, J. Marin, L. D. Diez-Picazo, A. B. Baena, M. Salaices, and M. A. Rodriguez-Martinez, “Oxidative stress induced by tert-butyl hydroperoxide causes vasocon-striction in the aorta from hypertensive and aged rats: role of cyclooxygenase-2 isoform,” Journal of Pharmacology and Experimental Therapeutics, vol. 293, no. 1, pp. 75–81, 2000. [37] A. Urbschat, N. Oberm¨uller, and A. Haferkamp, “Biomarkers of
kidney injury,” Biomarkers, vol. 16, supplement 1, pp. S22–S30, 2011.
[38] J. Mishra, M. A. Qing, A. Prada et al., “Identification of neu-trophil gelatinase-associated lipocalin as a novel early urinary biomarker for ischemic renal injury,” Journal of the American Society of Nephrology, vol. 14, no. 10, pp. 2534–2543, 2003. [39] J. Mishra, K. Mori, Q. Ma, C. Kelly, J. Barasch, and P.
Devara-jan, “Neutrophil gelatinase-associated lipocalin: a novel early urinary biomarker for cisplatin nephrotoxicity,” The American Journal of Nephrology, vol. 24, no. 3, pp. 307–315, 2004. [40] Y. Cai, Y. Chen, S. Zheng, B. Chen, Y. Yang, and P. Xia,
“Sirolimus damages podocytes in rats with protein overload nephropathy,” Journal of Nephrology, vol. 24, no. 3, pp. 307–312, 2011.
[41] D. P. Cin`a, T. Onay, A. Paltoo et al., “MTOR regulates autophagic flux in the glomerulus,” Autophagy, vol. 8, no. 4, pp. 696–698, 2012.
[42] J. Vassiliadis, C. Bracken, D. Matthews, S. O’Brien, S. Schiavi, and S. Wawersik, “Calcium mediates glomerular filtration through calcineurin and mTORC2/Akt signaling,” Journal of the American Society of Nephrology, vol. 22, no. 8, pp. 1453–1461, 2011.
[43] L. Straathof-Galema, J. F. M. Wetzels, H. B. P. M. Dijkman, E. J. Steenbergen, and L. B. Hilbrands, “Sirolimus-associated heavy proteinuria in a renal transplant recipient: evidence for a tubular mechanism,” The American Journal of Transplantation, vol. 6, no. 2, pp. 429–433, 2006.