Universidade de Aveiro 2011 Departamento de Biologia
Eduardo Manuel
Silva Loureiro
Alves Ferreira
Biodiversidade e conservação da herpetofauna do
médio-Araguaia
Biodiversity and conservation of the
middle-Araguaia herpetofauna
Dissertação apresentada à Universidade de Aveiro para cumprimento dos requisitos necessários à obtenção do grau de Doutor em Biologia, realizada sob a orientação científica do Prof. Doutor Carlos Manuel Martins dos Santos Fonseca, Professor Auxiliar com Agregação do Departamento de Biologia da Universidade de Aveiro e co-orientação da Prof. Doutora Adriana Malvasio, Professora Adjunta da Universidade Federal do Tocantins (Brasil).
Apoio financeiro da FCT e do FSE no âmbito do III Quadro Comunitário de Apoio (Bolsa de Doutoramento SFRH/BD/23191/2005
Dedico este trabalho a todos os que sobrevivem na fronteira entre as sociedades humanas e a Natureza.
o júri
presidente Prof.ª Doutora Ana Maria Vieira da Silva Viana Cavaleiro
professora catedrática da Universidade de Aveiro
Prof. Doutor Amadeu Mortágua Velho da Maia Soares
professor catedrático da Universidade de Aveiro
Prof. Doutor Guarino Rinaldi Colli
professor associado do Instituto de Ciências Biológicas da Universidade de Brasília, Brasília, Brasil
Prof. Doutor Carlos Manuel Martins Santos Fonseca
professor auxiliar com agregação da Universidade de Aveiro
Prof. Doutor Luís Manuel Souto de Miranda
professor auxiliar convidado da Universidade de Aveiro
Prof.ª Doutora Adriana Malvasio
professora adjunta da Universidade Federal do Tocantins, Palmas, Brasil
Prof. Doutor Yuri Luiz Reis Leite
professor adjunto da Universidade Federal do Espírito Santo, Vitória, Brasil
Prof.ª Doutora Leonora Pires Costa
professora adjunta da Universidade Federal do Espírito Santo, Vitória, Brasil
Prof. Doutor Fernando Jorge Guimarães Sequeira
investigador de pós-doutoramento do Centro de Investigação em Biodiversidade e Recursos Genéticos da Universidade do Porto
agradecimentos Se algo aprendi ao longo destes cinco anos foi a admirar e a celebrar a diversidade que existe nesta língua que se espalhou pelo Atlântico e mais além. Desta e de tantas outras com que se cruzou... Que o futuro seja feito mais de encontros que de desencontros! Obrigado a todos e todas que contribuíram para essa descoberta!
Fugindo aos protocolos agradeço, em primeiro lugar, a ti Ritinha! Se as teses pudessem ser escritas em co-autoria, o teu nome estaria na capa... Esta tese também é tua e, ao cabo de cinco anos de convivência, muito foi partilhado e, espero, muito haverá ainda para partilhar!
Ao meu orientador, Prof. Doutor Carlos Fonseca, o meu obrigado pela solidariedade que sempre demonstrou ao longo deste meu percurso sinuoso. Obrigado também ao impulsionador desta epopeia, Prof. Doutor Amadeu Soares. Era uma vez uma reunião de laboratório no longínquo ano de 2005 e as voltas que a minha vida deu desde então! A ambos, muito obrigado pelo apoio, principalmente nos momentos mais difíceis. À Prof. Doutora Liliana Pena Naval, o meu muito obrigado pelo apoio e pela atenção devotados, e que foram além do que me atreveria a pedir! À minha co-orientadora, Prof. Doutora Adriana Malvasio, e a todos os “jovens” CROQUEs, o meu obrigado pelo companheirismo e boa disposição com que sempre fui recebido! Um obrigado também a todos os que na Naturatins, Parque Estadual do Cantão, Fazenda Santa Fé, Fazenda Lago Verde sempre providenciaram o apoio logístico necessário e se interessaram pelo desenvolvimento deste projecto. Agradeço também ao Instituto ECOTROPICAL (parceria Universidade de Aveiro e Instituto Ecológica) pelo apoio logístico. Ao Prof. Doutor Guarino Colli e ao grupo de herpetologia da UnB, o meu muito obrigado pelo carinho e pela atenção com que sempre fui recebido... poucas foram as oportunidades, mas sempre bastante enriquecedoras e bem-dispostas. À Prof. Doutora Leonora Pires Costa e ao Prof. Doutor Yuri Leite, por me terem recebido na UFES durante o último ano e por me terem tratado como um “legítimo capixaba”, o meu muito obrigado! Ao Yuri, à Leo, à Carol, ao João, à Ju, ao André, à Ana Paula e a todos no LAMAB e no NGACB, com vocês do lado foi fácil enfrentar as maratonas de laboratório...e as cervejinhas de sexta à noite! Valeu pelas amizades que brotaram apesar do pouco tempo que aí passei! As amizades por vezes surgem das coisas mais simples, das conversas à mesa ou de uma cerveja depois de um dia a limpar mato e abrir buracos... Roberto, Sulene, Sr. António, Josi, Sr. Joaquim, Sr. Cimar, Sra. Maria, obrigado pelo apoio e pela camaradagem revelada na frente de batalha! Nuno, companheiro, ainda me lembro do dia 1 de Maio de 2006, em que cheguei a Palmas, de como chovia e de como nos recebeste em tua casa...e por lá fomos ficando mais de mês! Amigo, por tudo, o meu sincero obrigado! Aos amigos de longa data que ficaram por Aveiro, o meu obrigado por, mesmo após tantos anos de ausência, continuar a sentir-me acarinhado por todos! À minha família de emigração: Jacky, Susy, Chico, Beto, Sérgio, Andrea... agora há um pouco de mim espalhado por esse mundo fora, e um pouco de vocês onde eu estiver! Aos meus pais, Manuel e Amélia, e aos meus manos Carlos, Violeta e João, obrigado por estarem sempre presentes e por me apoiarem
incondicionalmente...assim tudo se torna mais fácil! Sem vocês, não teria levado este barco a bom porto! Aos meus amigos da velha guarda... após tantos encontros e desencontros, parece que a nossa amizade veio para ficar! Um amigo é um porto de abrigo e um farol e revela-se em dias de tempestade! Aos meus “Amor e Meio”... Jaqueline e David... mi ê dod na bsot! Obrigado por terem tomado a minha vida de assalto e por não me deixarem baixar os braços. “O amor se planta e ganha força nas raízes” e, depois de tantas partidas e chegadas, será preciso mais do que três continentes e um oceano para nos separar. Este é o fruto da distância forçada...espero que não tenha sido em vão!
palavras-chave Amazónia, Araguaia, biodiversidade, Cerrado, conservação, herpetofauna.
resumo A conservação da biodiversidade nunca foi uma assunto tão popular como nas últimas décadas, mas esta popularidade crescente é devida à pior das razões: o passo acelerado da extinção de espécies e habitats. Os ecossistemas tropicais são, ao mesmo tempo, os mais diversos e os mais ameaçados, em parte porque muitos países destas regiões emergem ainda de situações de instabilidade social, económica e política. O Brasil é o maior país Neotropical, onde se encontram alguns dos biomas com maior diversidade e mais
ameaçados do planeta. Actualmente, é também um país líder ao nível da planificação e implementação de medidas de conservação da biodiversidade. Vários dos biomas tropicais mais diversos e ameaçados encontram-se em território brasileiro. Dois destes biomas, a Amazónia e o Cerrado, convergem numa região ecotonal sujeita a uma elevada pressão humana, conhecida como o arco do desmatamento. O Araguaia, um dos maiores rios do Brasil, corre ao longo desta paisagem e os efeitos do desmatamento são já evidentes em toda a sua bacia. Por causa do acelerado ritmo de degradação deste ecossistema, torna-se urgente obter uma imagem clara da biodiversidade regional e
compreender como e se a estratégia de conservação para esta região é capaz de lidar com as correntes ameaças e alcançar o seu objectivo a longo prazo: conservar a biota regional. Tendo a herpetofauna como grupo-alvo, os nossos objectivos principais foram: aumentar o conhecimento das comunidades de anfíbios e répteis squamata da região do curso médio do Rio Araguaia; compreender a importância deste rio nos padrões intraespecíficos de estrutura e diversidade genética para diferentes espécies com diferentes características ecológicas; avaliar o potencial de diferentes metodologias para o estudo e monitorização da herpetofauna regional. Os nossos resultados revelam que a amostragem continuada e o uso de diferentes técnicas são essenciais para a obtenção de uma imagem precisa da diversidade da herpetofauna local. As comunidades locais de anfíbios e lagartos apresentaram maior riqueza específica na Área de Protecção Ambiental Bananal/Cantão (APABC), uma área tampão, do no Parque Estadual do Cantão (PEC), uma área de
conservação estrita. A APABC é caracterizada por uma maior heterogeneidade de habitats e os nosso resultados corroboram a teoria da heterogeneidade espacial e resultados recentes que revelam uma maior diversidade de lagartos nas zonas interfluviais do Cerrado, do que nas matas de galeria. Os resultados aqui apresentados não corroboram a hipótese de que os ecótonos apresentam maior diversidade do que os biomas em redor. Os nossos resultados
revelaram ainda que o Rio Araguaia afecta de forma diferente a estrutura genética de várias espécies de anfíbios e lagartos. Estas diferenças poderão estar relacionadas com a ecologia das espécies, nomeadamente com o uso de diferentes habitats, a vagilidade, ou a estratégia alimentar. Sugerimos que a gestão integração de diferentes unidades de conservação, com diferentes estatutos, podem ajudar a preservar melhor a biota regional.
keywords Amazonia, Araguaia, biodiversity, Cerrado, conservation, herpetofauna.
abstract Biodiversity conservation has never been such a popular matter as in the last decades, but this increasing popularity is due to the worst reason: the fast pace of extinction of species and habitats. Tropical ecosystems are both the most diverse and most threatened, in part because many countries from these regions are now emerging from decades of social, economic and political instability. Brazil is the largest country in the Neotropics and one of the world’s megadiverse countries. Nowadays, it is also a leading country in terms of planning and implementing biodiversity conservation measures. Brazil harbors several of the most diverse and threatened tropical biomes. Two of them, Amazonia and Cerrado, converge in an ecotonal region subjected to high human pressure, known as the deforestation arc. Araguaia, one of the largest Brazilian rivers, runs along this landscape and the effects of deforestation are already evident throughout its basin. Because of the fast pace of degradation in this ecosystem, it becomes urgent to get a clear picture of the regional
biodiversity and understand how and if the conservation strategy for the region is able to cope with the current threats and accomplish its long-term objectives of preserving the regional biota. Having herpetofauna as the target group, our main goals are: to improve the knowledge on the amphibian and lizard assemblages in the region of the middle Araguaia River; to understand the intra-specific patterns of genetic structure and diversity for different species with different ecological features; to assess the potential of different
methodologies for the study and monitoring of the regional herpetofauna. Our results revealed that continued sampling and the use of several techniques are essential to achieve an accurate picture of the diversity of the local
herpetofauna. The local lizard and amphibian assemblages presented higher species richness in the Área de Protecção Ambiental do Bananal/Cantão (APABC), a buffer area, than in Parque Estadual do Cantão (PEC), a strict conservation area. APABC is characterized by an higher habitat heterogeneity and our results corroborate the theory of spatial heterogeneity, as well as the conclusions of recent studies that reveal a higher diversity of lizards in the interfluvial áreas of Cerrado, than in gallery forest. The results here presented do not corroborate the hypothesis that ecotones present greater diversity than the surrounding areas. Our results also reveal that River Araguaia differently affects the genetic structure of several species of amphibians and lizards. These differences might be related with species ecology, namely with the use of different habitats, vagility or feeding strategy. We suggest that integrated management of different conservation units, with different conservation statuses might help to better preserve the regional biota.
Table of Contents
i Table of Contents
List of Tables iii
List of Figures iv
Chapter 1: General Introduction and Objectives 1
Introduction 3
Two Biomes: Amazonia and Cerrado 3
Deforestation, Land Use and Conservation Áreas 6
The Araguaia River Basin 9
The Herpetofauna 10
The Riverine Barrier Hypothesis 12
Thesis Objectives 14
References 15
Chapter 2: Biodiversity surveys in the Amazonia/Cerrado ecotone: the usefulness of
different methods for capturing small mammals and herpetofauna 27
Abstract 29 Resumo 29 Introduction 30 Methods 31 Results 34 Discussion 42 Acknowledgments 46 References 47
Chapter 3: On the usefulness of pipe refuges for studying herpetofauna in the
Amazonia/Cerrado ecotone 51 Abstract 53 Introduction 53 Methods 54 Results 56 Discussion 58 Acknowledgments 60 References 60
Chapter 4: On the importance of spatial heterogeneity and buffer areas in conservation: a
story by the herps of the middle Araguaia River 63
Abstract 65
Introduction 65
Table of Contents
Results 73
Discussion 80
Acknowledgments 84
References 85
Chapter 5: Is Araguaia River a genetic barrier for amphibian populations? 91
Abstract 93 Introduction 93 Methods 95 Results 100 Discussion 106 Acknowledgments 110 References 110 Supporting Information 116
Chapter 6: Is Araguaia River a genetic barrier for lizard populations? 121
Abstract 123 Introduction 124 Methods 126 Results 130 Discussion 138 Acknowledgments 144 References 144 Supporting Information 150
Chapter 7: Final Discussion 153
On the study and monitoring of herpetofauna 155
The dynamic relation between river and herps 156
Conservation areas and species assemblages 158
Is there room for everyone? 159
List of Tables
iii List of Tables
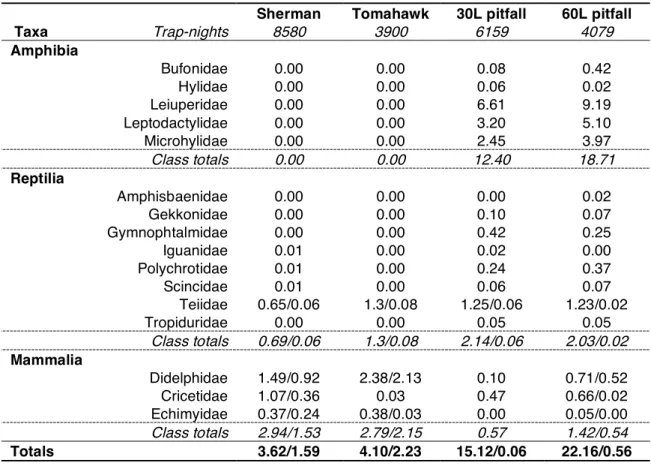
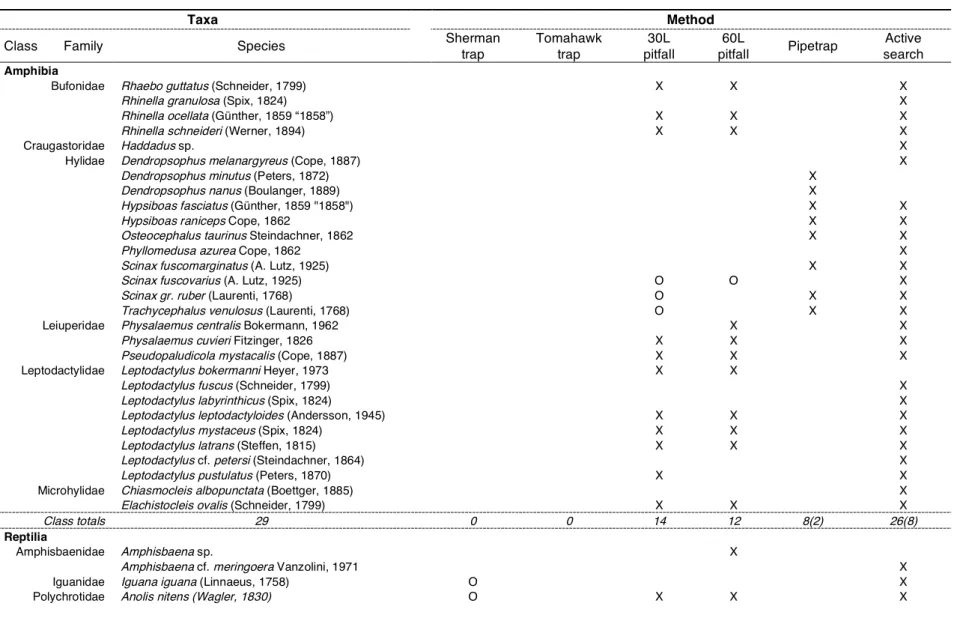
Table 2.1 Capture/recapture rates given by taxa and trap type, expressed as percentage of trap-nights number. When present, recapture rates are given after the dash. 35 Table 2.2 Species captured by method, with reference to class/method totals. Unique species,
defined as those captured by only one method, are presented between brackets. 36 Table 3.1 Mean and SD, minimum and maximum snout-vent length (SVL) and number of
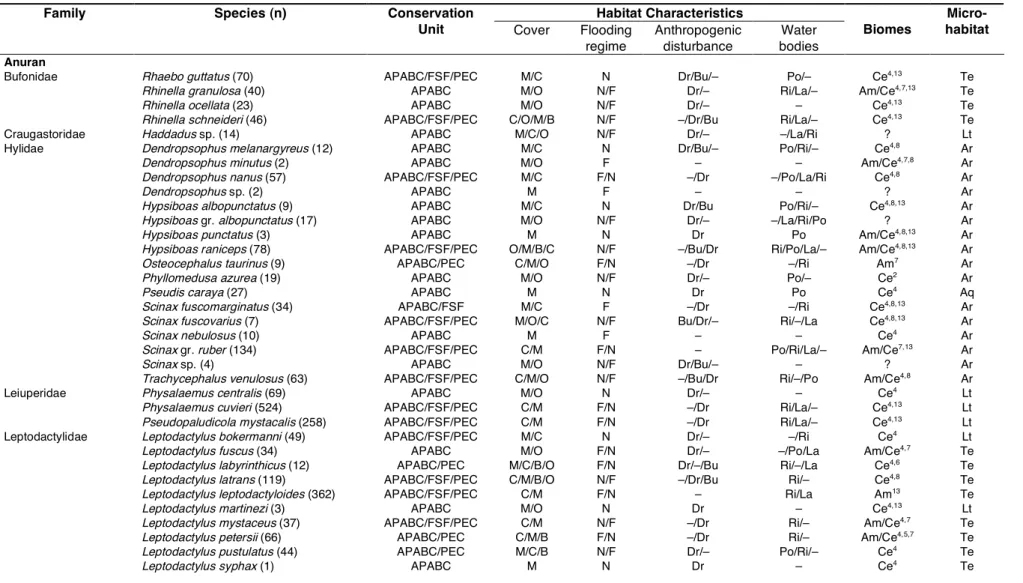
colonizing individuals in arboreal refuges, given per species and refuge colour. 56 Table 4.1 Captured anuran and lizard species (and number of individuals) and conservation
units where they occurred. Information about habitat characteristics of capture locations is presented in decreasing order of frequency. Biomes converging in this ecotonal region, where the listed species are typically found are presented with
references. 74
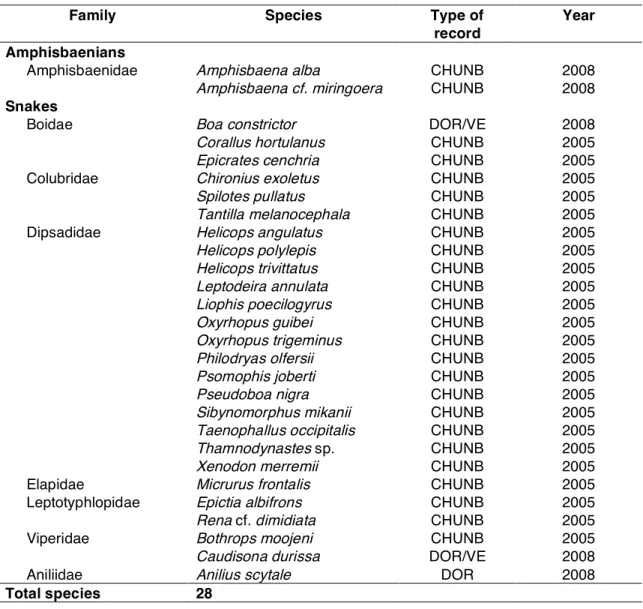
Table 4.2 List of snakes and amphisbaenians recorded in the study areas (APABC/PEC), with
reference to type and year of first record. 76
Table 4.3 Numbers of individuals, observed number of anuran and lizard species for each conservation unit (CU) and for the entire study area. Presented species richness and evenness estimates are based on the total numbers of captured individuals. 80 Table 5.1 Outgroup taxa used in the phylogenetic analyses (Genbank accession numbers). 100 Table 5.2 Molecular diversity indices for cox1, for the sets of samples of the three amphibian
species used in this study. Numbers of individual sequences (N), polymorphic sites/parsimony informative (Np) and haplotypes (H); Haplotype (h) and nucleotide
(π) diversity (± SD). 101
Table 5.3 Average pairwise divergence estimates among E. ovalis clades (lower diagonal) and 95% confidence intervals (upper diagonal), given as percentages. 102 Table 5.4 Average pairwise divergence estimates among T. venulosus clades (lower diagonal)
and 95% confidence intervals (upper diagonal), given as percentages. 102
Table 6.1 Outgroup taxa used in the phylogenetic analyses. 131
Table 6.2 Molecular diversity indices for cox1, nd4 and concatenated data, for the sets of samples of the three lizard species used in this study: numbers of individual sequences (N), polymorphic sites/parsimony informative (Np) and haplotypes (H);
Haplotype (h) and nucleotide (π) diversity (± SD). 132
Table 6.3 Average pairwise divergence estimates (K-2P) between Tupinambis clades. Divergence estimates are presented below diagonal and confidence intervals (95%) are presented above the diagonal. Clade numbers correspond to those in figure 4.
List of Tables
Table 6.S1 Information about the external molecular data (ND4 gene) used in this study, with reference to original source and to Genebank accession number. Haplotype
denomination correspond to the one in figure 4. 150
Table 6.S2 Average and maximum snout-vent length (SVL) and weight for each species. Data are based in measurements made during this study and are presented separately for males, females and for all individuals, including non-sexed individuals, but excluding
juveniles. 151
Table 7.1 Anthropogenic pressure in the study area. Figures are relative to annual values for
List of Tables
v List of Figures
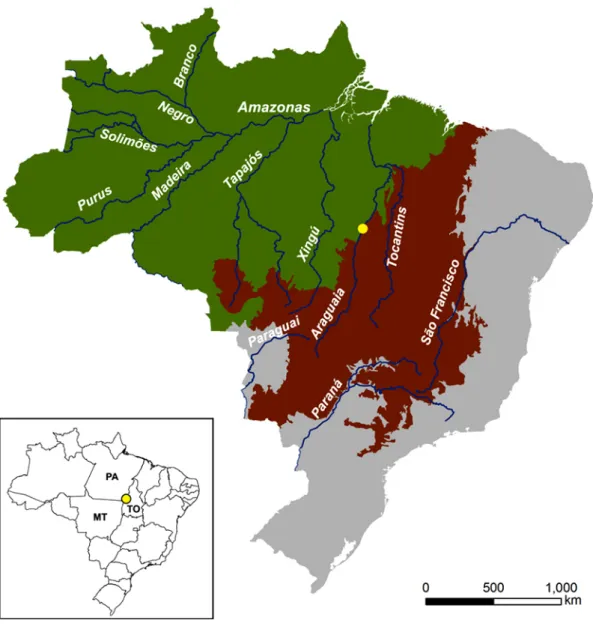
Figure 1.1 Location of the study area (yellow dot) within the context of Amazonia (green) and Cerrado (brown) biomes, and Brazilian federal units: MT – sate of Mato Grosso; PA – state of Pará; TO – state of Tocantins. Major Brazilian rivers are also depicted. 4 Figure 1.2 Deforested areas within Legal Amazonia boundaries. The region known as
deforestation arc corresponds to the continuous deforested area (yellow and purple) extending from São Luís (state of Maranhão) to Rio Branco (state of Acre). Reproduced
with permission from Girardi (2008). 7
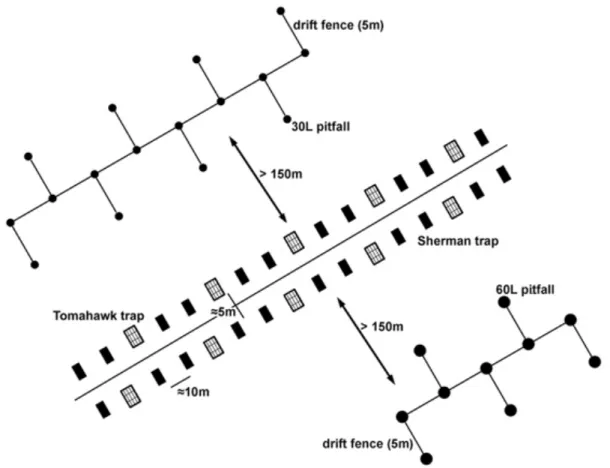
Figure 2.1 Sampling design used in each one of the 20 sampling points. Lines of pitfalls and
cage-traps were placed at least 150m apart. 32
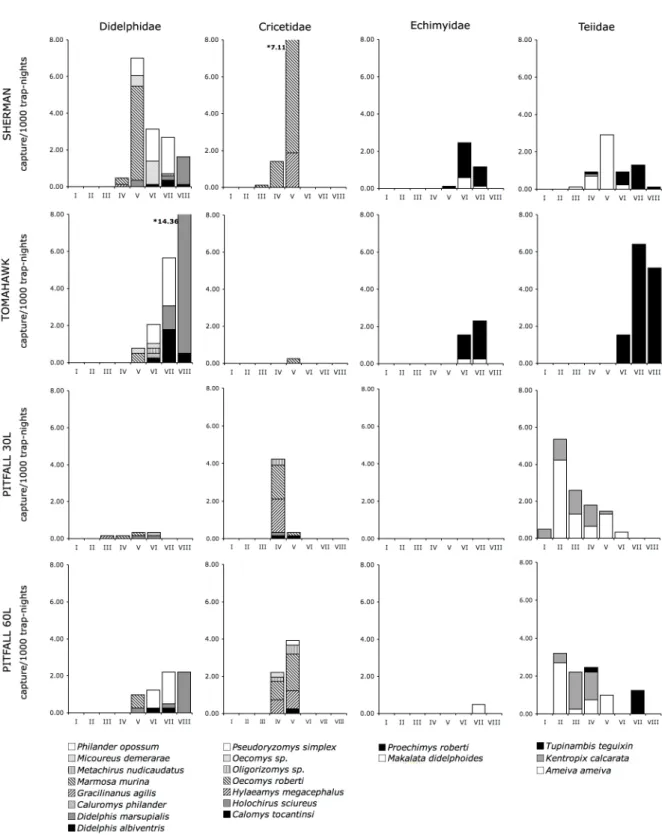
Figure 2.2 Capture rates (captures/1000 trap-nights) for all families captured in all methods under comparison, presented by weight class. Species are identified by shades of grey and black and white patterns. Asterisks stand for off-scale values – actual capture rates for
these two species are shown at the side of the bar. 38
Figure 2.3 Capture rates (captures/1000 trap-nights) for families captured only in pitfalls, presented by weight class: 3a) abundant amphibian species; 3b) rare amphibian species; 3c) lizard species. Species are identified by shades of grey and black and white patterns. AMP – Amphisbaenidae; BUF – Bufonidae; GEK – Gekkonidae; GYM – Gymnophtalmidae; LEI – Leiuperidae; LEP – Leptodactylidae; MIC – Microhylidae; POL
– Polychrotidae; SCI – Scincidae; TRO – Tropiduridae 39
Figure 2.4 Results from odds-ratio pairwise meta-analysis: 60L pitfall versus 30L pitfall (4a); Sherman traps versus Tomahawk trap (4b); live-trap versus pitfall trap (4c). Black solid squares represent ratios for each family; open rhombuses represent combined ratios and horizontal lines indicate 95% confidence intervals. Values are presented in the right side of the graphs. Size of squares is proportional to contribution of each family to
combined ratios. 41
Figure 3.1 RDA correlation biplot. Species – black solid lines; environmental variables (EV) – dotted grey lines and capitalized letters; Centroids from classes “tree” and “shrub” of
nominal EV “vegetal type” – grey-filled circles. 57
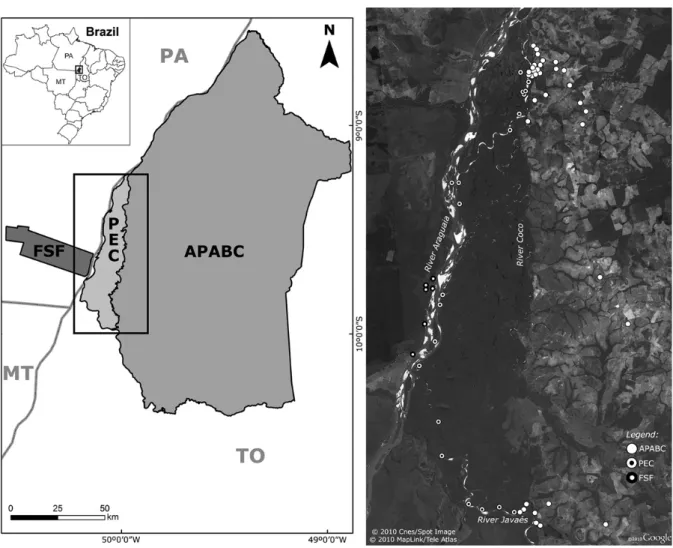
Figure 4.1 Map of the study area showing sampled locations (including all sampling methods) and major rivers in the region. Sampled locations depicted in red. States: MT – Mato Grosso; PA – Pará; TO – Tocantins. Conservation areas: APABC – Área de Protecção Ambiental da Ilha do Bananal/Cantão; FSF – Fazenda Santa Fé; PEC – Parque
Estadual do Cantão. 69
Figure 4.2 Individual-based rarefaction curves for anurans and lizards. Separate curves are presented for each one of the three sampled areas (A and C) and for the middle Araguaia region (B and D). Bars represent standard deviation of estimates. 77
Figure 4.3 Richness estimator curves for anurans and lizards. A to D: ACE estimator (solid lines) and standard deviation (bars). E to H: Chao 1 estimator (solid lines) and 95%
confidence intervals (dashed and dotted lines). 78
Figure 4.4 Buzas and Gibson’s evenness estimator curves for anurans (A) and lizards (B). Separate curves are presented for each one of the three sampled areas and for the
middle Araguaia region. 79
Figure 5.1 Study area in the mid-Araguaia River basin. Location of study area in Brazil (bottom left corner); Map including all the sampled conservation units (left) and detail of sampling points near River Araguaia (right). Grayscale and hatched patterns correspond to those in figures 5.2, 5.3 and 5.4. Federal Units: ES – Espírito Santo; MT – Mato Grosso; PA – Pará; TO – Tocantins. Major rivers and direction of flow are also depicted. Sample areas: PEC – Parque Estadual do Cantão; APABC – Área de Protecção Ambiental do Bananal/Cantão; FSF – Fazenda Santa Fé; FLV – Fazenda Lago Verde. 96 Figure 5.2 Elachistocleis ovalis. Left: Bayesian inference (BI) majority-rule 50% consensus tree.
Centre: Neighbour-joining (NJ) bootstrap consensus tree. Posterior probability (BI) or bootstrap support (NJ/MP) is presented above each node. Only nodes with strong support are labelled. Right: Median-Joining (MJ) networks – haplotype pies correspond to those in BI trees. Grayscale/hatched patterns correspond to those in figure 1. Clade names (in gray) correspond to those in Table III. Numbers of mutations between haplotipes in the MJ network are indicated except for links corresponding to one
mutation. 103
Figure 5.3 Leptodactylus latrans. Left: Bayesian inference (BI) majority-rule 50% consensus tree. Centre: Neighbour-joining (NJ) bootstrap consensus tree. Posterior probability (BI) or bootstrap support (NJ/MP) is presented above each node. Only nodes with strong support are labelled. Right: Median-Joining (MJ) networks – haplotype pies correspond to those in BI trees. Grayscale/hatched patterns correspond to those in figure 1. Numbers of mutations between haplotipes in the MJ network are indicated except for
links corresponding to one mutation. 104
Figure 5.4 Trachycephalus venulosus. Left: Bayesian inference (BI) majority-rule 50% consensus tree. Centre: Neighbour-joining (NJ) bootstrap consensus tree. Posterior probability (BI) or bootstrap support (NJ/MP) is presented above each node. Only nodes with strong support are labelled. Right: Median-Joining (MJ) networks – haplotype pies correspond to those in BI trees. Grayscale/hatched patterns correspond to those in figure 1. Clade names (in gray) correspond to those in Table IV. Numbers of mutations between haplotipes in the MJ network are indicated except for links corresponding to
one mutation 105
Figure 5.S1a Ventral, posterior and lateral view of several E. ovalis individuals captured at the study area, around the Araguaia River. The haplotipe and snout-vent length of each individual
List of Tables
vii at the study area, around the Araguaia River. The haplotipe and snout-vent length of each individual is presented rightmost picture.
Figure 5.S1c (continued) Ventral, posterior and lateral view of several E. ovalis individuals captured at the study area, around the Araguaia River. The haplotipe and snout-vent length of
each individual is presented rightmost picture. 118
Figure 5.S2 View of the dorsal pattern of several T. venulosus individuals, captured in the study area, around Araguaia River. The haplotipe and snout-vent length of each individual is presented in each picture. Pictures A, B and C correspond to pattern “zonata”, and pictures D, E and F correspond to pattern “bufonia” in Lutz (1973). 119 Figure 6.1 Figure 6.1 – Study area in the mid-Araguaia River basin. Location of study area in
Brazil (bottom left corner); Map including all the sampled conservation units (left) and detail of sampling points near River Araguaia (right). Grayscale and hatched patterns correspond to those in figures 6.2, 6.3 and 6.4. Federal Units: ES – Espírito Santo; MT – Mato Grosso; PA – Pará; TO – Tocantins. Major rivers and direction of flow are also depicted. Major rivers and direction of flow are also depicted. Sample areas: PEC – Parque Estadual do Cantão; APABC – Área de Protecção Ambiental do Bananal/Cantão; FSF – Fazenda Santa Fé; FLV – Fazenda Lago Verde. 127 Figure 6.2 Anolis nitens brasiliensis. Left: Neighbour-joining (NJ) bootstrap consensus tree.
Posterior probability (BI) and bootstrap support (MP/NJ) for nodes are presented bellow each node; only nodes supported by at least two of the methods are labelled. Right: Median-joining (MJ) network – haplotype pies correspond to those in NJ trees. Grayscale/hatched patterns correspond to those in figure 1. Numbers of mutations between haplotipes in the MJ network are indicated except for links corresponding to a
single mutation. 135
Figure 6.3 Ameiva ameiva. Left: Neighbour-joining (NJ) bootstrap consensus tree. Posterior probability (BI) and bootstrap support (MP/NJ) for nodes are presented bellow each node; only nodes supported by at least two of the methods are labelled. Right: Median-joining (MJ) network – haplotype pies correspond to those in NJ trees. Grayscale/hatched patterns correspond to those in figure 1. Numbers of mutations between haplotipes in the MJ network are indicated except for links corresponding to a
single mutation. 136
Figure 6.4 Tupinambis. Left: Neighbour-joining (NJ) bootstrap consensus tree from genus Tupinambis, including samples from the studies by Fitzgerald et al (1999) and Pellegrino et al (2005) – see Table S2. Centre: detail from clade 1, corresponding to T. teguixin from the middle Araguaia basin. Posterior probability (BI) and bootstrap support (MP/NJ) for nodes are presented bellow each node; only nodes supported by at least two of the methods are labelled. Right: Median-joining (MJ) network – haplotype pies correspond to those in clade 1. Grayscale/hatched patterns correspond to those in figure 1. Numbers of mutations between haplotipes in the MJ network are indicated except for links corresponding to a single mutation. 137
1
“Sempre pensara em ir
caminho do mar.
Para os bichos e rios
nascer já é caminhar.
Eu não sei o que os rios
têm de homem do mar;
sei que se sente o mesmo
e exigente chamar […]”
João Cabral de Melo Neto,
in Morte e Vida Severina
CHAPTER 1
Chapter 1
Chapter 1 cover photos (from left to right): Araguaia River after the rain season; Coco River at the peak of dry season; sunset at Javaés River.
General Introduction and Objectives
3 1.1 – Introduction
One of the major obstacles to the conservation of the biodiversity, at the global scale, is that we live in a world in use. The destiny of millions of species is dependent on the will of a species, with thousands of millions, which inhabits the planet and uses its resources, but not like all the other species. This species, Homo sapiens, does not adapt itself to the environment; it adapts the environment to its needs, at a level without known parallel in the history of the planet.
Recent hypotheses about human dispersal place the Americas as the last region to be colonized by humans (Fagundes et al., 2007, 2008; Mulligan et al., 2008). Even though, this continent was colonized long before the modern paradigm of land-use and of the concept of natural world as a source of commodities. Contrarily to earlier believe, the peoples inhabiting Amazonia before European contact were also familiarized with plant domestication. However, the use and management of useful plants was not based on forest clearing and crop plantation, but on “landscape domestication” (Clement, 2006; Junqueira et al., 2010). In Cerrado, archeological evidences suggest that hunter-gatherer peoples were the first to colonize the biome, and were dependent on native plant and game species (Klink and Moreira, 2006). Common to both approaches was the sustainability of the coexistence between human populations and its environment.
At the present state of development, it is naïve to believe that such coexistence is still possible, or even desirable for the majority of human populations. Modern societies are dependent on domesticated plants and animals for almost everything and generally ignore the importance of wild species and habitats for the survival of peripheral human communities (Redford and Robinson, 1991a). The success of conservation efforts will depend on understanding and conciliating the needs of people living at the edge of these pristine areas with the need to preserve biodiversity (Fragoso et al., 2004; Schmink, 2004; Rudel, 2005). Meanwhile, biodiversity is being lost, sometimes even before being discovered (Fouquet et al., 2007). Species and ecosystems are not equally vulnerable and some adapt themselves to a rapidly changing world; others do not.
1.2 – Two Biomes: Amazonia and Cerrado
Forests used to be seen as pristine landscapes, while grasslands were traditionally considered as a transitional state in the succession to an equilibrium forest state (Bond and Parr, 2010). However, according to these authors, the tropical and subtropical long-
Chapter 1
Figure 1.1 – Location of the study area (yellow dot) within the context of Amazonia (green) and Cerrado (brown) biomes, and Brazilian federal units: MT – sate of Mato Grosso; PA – state of Pará; TO – state of Tocantins. Major Brazilian rivers are also depicted.
standing grasslands are better explained in a framework of alternative ecosystem states. The main difference might be related with differences regarding shade tolerance, with shade-intolerant species dominating savannas and shade-tolerant species abounding in forests (Bond and Parr, 2010). A forest-dominated ecosystem, Amazonia, and a grassland/savanna-dominated ecosystem, Cerrado, merge along an ecotonal region that extends throughout several thousand kilometers, in central Brazil (Figure 1.1). In addition, several large savanna patches occur within the Hylean forests (Ratter et al., 2006), while
General Introduction and Objectives
5
gallery forests extend the Amazon influence along the watercourses in Cerrado (Oliveira-Filho and Ratter, 2002). In fact, a large portion of Cerrado biome is located within the limits of the legally defined Amazonia (Ratter et al., 2006).
Amazonian rainforest is the world’s largest major wilderness area (Mittermeier et al., 1998) and about two thirds of this biome are located within the Brazilian borders (Silva et al., 2005). Amazonia is far from being a uniform tract of forest; rather it encompasses a wide variety of landforms such as the Andean foothills, the tepuis in the north, the várzeas, terra firme and igapó forests (Rudel, 2005). Different areas of endemism for terrestrial vertebrates, separated by the major Amazonian rivers, were recognized within the biome, of which Tapajós, Xingú, Belém and Roraima areas of endemism are exclusively or almost exclusively within Brazil (Silva et al., 2005). The climate varies along the Amazonian biome, with a marked seasonality in rainfall in the eastern regions that is absent in the western ones (Rudel, 2005). Amazonian habitats are largely dominated by trees and lianas (Ribeiro et al., 1994; Ivanauskas et al., 2004). Exception is made to the savanna enclaves that present higher proportions of grasses and shrubs, similarly to the open formations of the Cerrado biome (Ratter et al., 1997; Filgueiras, 2007). These enclaves of Amazonian savanna are however much less diverse than the core of Cerrado (Ratter et al., 2003), which is also true for faunal communities (Gainsbury and Colli, 2003). The natural or anthropogenic origin of Cerrado has been a matter of debate (Ledru, 2002). There are strong evidences of a worldwide expansion of tropical and subtropical grasslands and savannas dominated by C4 grasses (such as Cerrado), starting around 8 million years ago, after a global decrease of atmospheric CO2 (Cerling et
al., 1997; Mayle et al., 2004; Simon et al., 2009; Bond and Parr, 2010). On the other hand, palynological records suggest that the earliest record of cerrado-type vegetation in Brazil dates back to 32,000 years before present, in the Central Brazilian Plateau (Ledru, 2002). Even though, according to this author, the fire-adapted vegetation of Cerrado probably existed before people arrived to South America. In either way, Cerrado is considered a global biodiversity hotspot for plants and vertebrates (Mittermeier et al., 1998; Myers et al., 2000). Species richness estimates for the Cerrado woody flora point to 950 to 1000 species, but the biome is widely dominated by only a small fraction of this assemblage (Ratter et al., 2003; Bridgewater et al., 2004). A strong geographical pattern in the distribution of the flora was found in Cerrado, which allowed the recognition of several distinct floristic regions within this biome (Oliveira-Filho and Ratter, 2002; Ratter et al., 2003). The Cerrado biome comprises several physiognomies ranging from grasslands
Chapter 1
with or without trees (campo sujo or campo limpo, respectively), to gradually more forested areas (campo cerrado and cerrado sensu stricto) until almost closed woodland (cerradão) areas (Oliveira-Filho and Ratter, 2002). The previous physiognomies are present in dry areas but Cerrado also includes gallery forests along the watercourses, and seasonally flooded forests and grasslands (Oliveira-Filho and Ratter, 2002).
1.3 – Deforestation, Land Use and Conservation Areas
Habitat fragmentation is one of the major causes of worldwide current biodiversity crisis (e.g., Skole and Tucker, 1993; Anderson and Jenkins, 2006), and the current main cause of habitat loss and fragmentation in tropical areas is deforestation. Recent studies showed that deforestation altered the patterns of species richness, diversity and abundance of the herpetofauna (Gardner et al., 2006; Bernarde and Macedo, 2008; Cano and Leynaud, 2010). On the other hand, some studies reveal that low-scale selective logging activities (Vallan et al., 2004) or silvicultural activities (Lopes, 2010) might present low impact on local herpetofauna.
Total deforested area, and sometimes the deforestation rates, is higher in Cerrado than in Amazonia (Klink and Machado, 2005). Estimates of total deforested area in Cerrado vary between 39% (Sano et al., 2010) and 80% (Myers et al., 2000), depending on the criterion: only clear cutted areas; clear cutted and edge areas; or all areas under human influence, such as natural pastures. Considering the most optimistic estimative, if secondary growth forests and exploited native pastures are included as areas under direct human intervention, then the lower threshold rises to 53%, approaching the estimates provided by Klink and Machado (2005). In the year of 1988, estimates of effectively deforested area in Amazonia corresponded to 6% of the total area of the biome, but the area affected by deforestation was already about 15% (Skole and Tucker, 1993). Cumulative deforested area in Legal Amazonia, which includes areas covered by Cerrado, reached 17% in the year of 2006 and most of the deforestation was concentrated in the border between Amazonia and Cerrado (Reid and Sousa, 2005; Foley et al., 2007). This area is known as the Deforestation Arc (Figure 1.2), which extends along the eastern and southern borders of Amazonia, cutting through the states of Maranhão, Tocantins, Pará, Mato Grosso, Rondônia, Acre and Amazonas (Vieira et al, 2008).
General Introduction and Objectives
7 Figure 1.2 – Deforested areas within Legal Amazonia boundaries. The region known as deforestation arc corresponds to the continuous deforested area (yellow and purple) extending from São Luís (state of Maranhão) to Rio Branco (state of Acre). Reproduced with permission from Girardi (2008).
One of the reasons for the difference between the deforestation rates in the two biomes is that the Brazilian law (Klink and Machado, 2005). According to these authors, the latter requires that 80% of each holding in Amazonia should be preserved, but in Cerrado, this percentage is only 20%. In Cerrado, higher deforestation rates are reported for the southern states were only 13 to 32% of native areas still remain intact (Sano et al., 2010). According to the same authors, Tocantins is the northern state with the greatest percent of deforested areas (21%). In Amazonia, deforestation rates also vary among the major endemism areas (Silva et al., 2005). The Xingu area of endemism, at the core of the deforestation arc (Figure 1.2), is the most severely affected area, with almost 27% of its native area already converted for human use (Silva et al., 2005).
Chapter 1
The most frequently appointed causes for deforestation are extensive agriculture and cattle ranching (Klink and Moreira, 2002; Fearnside, 2005; Vieira et al., 2008). In a recent study in the Cerrado biome, Carvalho and collaborators (2009) concluded that croplands are more damaging than pasturelands for the conservation of biodiversity. The soils under Cerrado and Amazonia are relatively infertile (Klink and Moreira, 2002; Stepan, 2006) and, in a context of large-scale crop and cattle production, cleared areas soon become exhausted and new large areas must be cleared. Other related causes for deforestation have also been suggested, and Fearnside (2005) pointed the role of clearing in the establishment of land claims as one of the root problems. In addition, government loans and subsidies were primarily oriented to large-scale agriculture and logging activities, and allocated based on the size of planted area, encouraging extensive and inefficient agriculture practices (Klink and Moreira, 2002; Rudel, 2005; Clement, 2006).
In this not very encouraging context, the great effort of Brazilian researchers, conservation professionals and governments in establishing a large and effective conservation program must be recognized (Rylands and Brandon, 2005). Brazil’s present system of protected areas includes strictly protected areas, such as parks, biological reserves and ecological stations; and sustainable use areas, which allow different types and levels of human use, and include national forests, environmental protection areas and extractive reserves, among others (Rylands and Brandon, 2005). According to these authors, in 2005, there were 478 federal and state strictly protected areas and 436 sustainable-use areas, covering an area of about 37 million and 74.6 million hectares, respectively. Recent data from the Program of Amazonian Protected Areas (ARPA) reveal that 31 strict conservation areas and 30 conservation areas for sustainable use are presently included in this program, covering 32 million hectares of Amazonian forest (ARPA, 2011).
As suggested by Peres (2004), the long-term persistence of the Amazonian biome depends on a large and integrated system of strict conservation and sustainable use areas. Unfortunately, in the Amazonian area of endemism of Xingu, for example, only 0.29% is under strict protection and 2.72% are sustainable use areas (Silva et al., 2005). In the latter case, according to the authors, if indigenous areas are considered, 27.1% of this region is somehow preserved. The situation is not better in Cerrado, where only about 2.2% of its total extent is under any legal conservation statuses (Klink & Machado, 2005). Conservation efforts could benefit from the integration of indigenous and smallholder
General Introduction and Objectives
9
very large areas (Silvius, 2004; Campos and Nepstad, 2005). Large efforts for integrated protection of large extents of pristine areas are also being conducted by Brazilian conservation agencies, universities and international non-governmental organizations, by promoting the creation of ecological corridors. Some examples are: the “Corredor Jalapão – Oeste da Bahia”, in the transition between Cerrado and Caatinga biomes, in the border of the states of Tocantins, Piauí, Maranhão and Bahia; or the “Corredor Sul da Amazônia”, which includes all the forests located between the right margin of Madeira River and the central region of the state of Maranhão (CI-Brasil, 2011).
1.4 – The Araguaia River Basin
The Araguaia River (Figure 1.1) is the main fluvial system in Cerrado and, together with Tocantins River, constitutes the fourth largest drainage basin of South America (Aquino et al., 2008; Latrubesse et al., 2009). The basin extends through both Amazonia and Cerrado biomes (Aquino et al., 2008). Araguaia presents an anabranching pattern that is characteristic of many large rivers (Latrubesse, 2008). Anabranching rivers consist of multiple channels separated by vegetated semi-permanent alluvial islands excised from preexisting floodplain or formed by within-channel or deltaic accretion (Nanson and Knighton, 1996).
The Araguaia basin was recognized as a priority area for conservation (Azevedo-Ramos and Galatti, 2002; Cavalcanti and Joly, 2002), and a plant diversity hotspot that, despite the outlying location, is mainly composed of typical Cerrado species (Oliveira-Filho and Ratter, 2002). The area is now the core of political, scientific and social debates, because of the intensive deforestation in Cerrado and the expansion of agribusiness in the region (Aquino et al., 2008). One of the controversial issues is related with the damming projects for Araguaia, which is one of the last undammed large rivers in Brazil (Reid and Sousa, 2005; Latrubesse et al., 2009).
River damming can have direct impact on local fauna and habitats (Fearnside, 2001; Brandão and Araújo, 2008). Dams can degrade socially valued riverine and riparian ecosystems, and the services they provide (Esselman and Opperman, 2010). As an example of direct impacts on fauna, dam-induced changes such as siltation of ponds, increased water velocities and lowered water temperatures were shown to be pottentially deleterious to turtle populations (Reese, 1996). Flooding of dam reservoir also may lead to depletion of amphibian species in local amphibian communities in the islands formed from
Chapter 1
hill remnants, during the flooding of the reservoir (Brandão and Araújo, 2008). Habitat alteration caused by river damming was also shown to negatively affect native amphibian species, while promoting dominance by invasive species like Rana catesbeiana (Fuller et al, 2010).
However, direct human intervention in Araguaia is just one of the matters of concern. There are evidences that deforestation in Cerrado is triggering erosion all over the basin of Araguaia and other Brazilian rivers (Coe et al., 2009; Latrubesse et al., 2009; Coe et al., 2011) and this erosion has been affecting mostly large arboreal vegetation in the floodplain (Latrubesse and Stevaux, 2006). The middle Araguaia extends for 1160Km and corresponds to 79% of its total drainage area (Aquino et al., 2008). The floodplains in the middle river course retain about 30% of Araguaia’s output during the flooding season, in part because of a complex lake system and because of the arboreal vegetation that slows down the flooding wave (Aquino et al., 2008). The question remains on how this dynamic is going to be affected by deforestation in the long term. Changes in land-cover are changing hydrology (Klink and Machado, 2005). The Araguaia basin still ensures the preservation of large Cerrado remnants (Latrubesse et al., 2009) but, in the long-term, this role might be compromised by the present deforestation rates.
1.5 – The Herpetofauna
Tropical regions present particularly rich amphibian and reptile faunas. Among amphibian taxa, the highest diversity of anurans and caecilians is found in the tropics, and only order Caudata is more diverse in temperate climates (Duellman, 1994; Wells, 2007). All reptilian taxa are represented in the tropics and some, such as crocodilians and several squamate families, are more diverse or even restricted to tropical and subtropical regions (Zug et al., 2001; Pough et al 2004). According to the Brazilian Society of Herpetology, there are currently 877 recognized species of amphibians (SBH, 2011a) and 721 recognized species of reptiles (SBH, 2011b), known to occur in Brazil, with several new species being described each year.
Several taxonomic rearrangements of squamate and amphibian taxa have been proposed in the last years, directly affecting the taxonomy of Neotropical taxa. The rearrangements included the establishment of new families, genera and species and the replacement and splitting of previously non-monophyletic taxa. Some examples are:
General Introduction and Objectives
11
relatives (Grant et al., 2006); Gekkota (Gamble et al., 2007); Terrarana (Hedges et al., 2008); or snakes (Adalsteinsson et al 2009; Zaher et al., 2009).
All the three groups of extant amphibians are present in Brazil, but anuran taxa are hegemonic in all biomes, both in the number of species, as in the number of families (Colli et al., 2002; Azevedo-Ramos & Gallati, 2002; Rodrigues, 2003; Avila-Pires et al., 2007; Cruz and Feio, 2007; Strüssman et al., 2007). The order Gymnophiona is represented by two families – Caeciliidae (26 species) and Rhinatrematidae (one species) – and the plethodontid Bolitoglossa paraensis is the only representative of order Caudata (SBH, 2010a). On the other hand, anurans constitute more than 96% of all amphibian species in Brazil, distributed into 19 families. The most diverse family of anurans in Brazil is by far the family Hylidae, with 339 recognized species, followed by: Leptodactylidae (74), Cycloramphidae (68), Bufonidae (67) and Leiuperidae (55) (SBH, 2010a). The same pattern also occurs in Cerrado and Amazonia, where hylids and leptodactylids are the most numerous families (Colli et al., 2002; Bastos, 2007; Ávila-Pires et al, 2007)
Most of world’s non-avian reptilian species are squamates (Pough et al., 2004) and the same occurs for Brazilian biomes (Colli et al 2002; Ávila-Pires et al 2007; Rodrigues, 2003). Brazilian herpetofauna includes six crocodilian species, all from family Alligatoridae, and 36 chelonian species, distributed into eight families, including marine, terrestrial and fresh water representatives (SBH, 2010b). However, these two ancient taxa are outnumbered by squamates, which include 67 species of amphisbanids, 241 species of lizards and 371 species of snakes (SBH, 2010b). Autarchoglossa (133) is the most diverse lizard group, followed by Iguania (73) and Gekkota (34). At the family level, Gymnophtalmidae leads the ranking, with 82 valid species (SBH, 2010b). In Amazonia, this family also presents the highest number of species (Ávila-Pires, 2007), but the diversity of lizards in Cerrado is more evenly distributed, with Teiidae being the most speciose group (Colli et al., 2002).
Higher species richness does not warrant a higher perceived importance. Despite amphibian and squamate species clearly outnumber chelonians and crocodilians, the latter two groups are more familiar to common people in South America. In fact, they are the economically most important reptile taxa in the Neotropics (Redford and Robinson, 1991b; Vichers, 1991; Fachín-Teran et al., 2004; Seijas, 2004; Verdade and Piña, 2007). The same patern is verified locally, in the middle Araguaia basin, where turtles and their eggs are frequently consumed (Salera Jr., 2005; Salera Jr. et al., 2007; Ataídes 2009), as well as crocodilian meat, as reported by local people.
Chapter 1
Large lizards, like iguanas or teiids, are important for some human communities in the Neotropics, as a protein source (meat and eggs) but also as a source of monetary income, because of skin trade (Fitzgerald et al., 1991; Werner, 1991; Fitzgerald et al. 1994). Some anuran species are also used for human consumption (Pough et al., 2004), which is the case of the large Leptodactylus species, in the Araguaia basin. Toxins from frog skins are traditionally used in rituals or hunting by indigenous people in the Amazon basin (Myers et al., 1978, Daly et al., 1992). Presently, amphibian toxins are also being used in medical and pharmaceutical research (Shwartz et al., 2007). Moreover, amphibians, lizards and snakes are much appreciated in the international pet market (Schlaepfer et al., 2005; Wells, 2007).
The first works about Cerrado herpetofauna (Duellman, 1979; Vanzolini, 1998; Sites, 1995) suggested its low differentiation, rate of endemism and lack of distinctiveness, but Colli and collaborators (2002) refuted these claims, stating that the horizontal habitat variability in Cerrado balanced the vertical variability typical of forested habitats, resulting in similar levels of local species richness. Recent studies reporting the highly habitat-structured nature of lizard assemblages in Cerrado supported this view (Nogueira et al., 2005; Costa et al., 2007; Nogueira et al., 2009). Some studies point to a greater diversity of anurans in the central and southeastern regions of Cerrado (Diniz-Filho et al., 2006, 2007) but Bini and collaborators (2006) suggest that a more intense sampling in the northern areas of the biome would probably expand the distribution of known anuran species and eventually contribute with the description of new species. In the case of Amazonia, Avila-Pires (1995) and Azevedo-Ramos and Galatti (2002) suggested the existence of distinctive amphibian and lizard assemblages across the biome. Vitt and collaborators (1999) found that Amazonian herpetofauna was also structured relatively to microhabitat and diet.
1.6 – The Riverine Barrier Hypothesis
The herps from the mid-Araguaia basin live in a river-dominated landscape. Besides the Araguaia itself, two major tributaries are present in this area: Coco and Javaés. The idea that these rivers could play an important role in the evolutionary history of herps is easily born in mind. However, this idea is not new. The role of rivers as barriers to animal populations and, thus, as a mechanism responsible for the diversification of the
General Introduction and Objectives
13
1852, by Alfred Russell Wallace (Colwell, 2000). The idea that rivers could have shaped Amazonian biodiversity resulted from the observation that: (1) large rivers are common in the Neotropics since the Pleistocene; (2) they dissect the tropical forest in fragments of various sizes (Gascon et al., 1998); (3) and different species occurred in opposite banks of the same river. Several alternative hypotheses for the diversification of Amazonian diversity were proposed since then and reviews on this subject are available (Haffer, 1997; Moritz et al., 2000; Zeisset & Beebee, 2008; Haffer, 2008; Antonelli et al., 2010).
Some authors elaborated predictions that should be proven true, in the case of river-mediated diversification (Haffer, 1997; Moritz et al, 2000; Patton et al., 2000). For example, Patton et al (2000) suggested three possible scenarios of river mediated divergence: (1) reciprocally monophyletic and sister clades on opposite sides of the river would indicate primary diversification; (2) reciprocally monophyletic but not sister clades on opposite sides of the river would suggest secondary contact; (3) paraphyletic relationship from one bank relatively to the other would correspond to an event of dispersal across the river.
Patterns of species distribution or the phylogenetic patterns of vertebrate species sometimes appeared to fit the predictions of the Riverine Barrier Hypothesis. Some examples are: the distribution patterns of amphibians and other vertebrate groups in lowland Amazonia (Ron, 2000); and the phylogenetic patterns of amphibians (Noonan and Wray, 2006; Funk et al, 2007), lizards (Pellegrino et al., 2005; Rodriguez-Robles et al., 2008), birds (Bates et al., 2004), tamarins and rodents (Patton et al, 2000). However, several other (or even the same) studies reveal examples of distribution and phylogenetic patterns that contradict the predictions of this hypothesis (Gascon et al., 1998; Lougheed et al., 1999; Gascon et al., 2000; Patton et al., 2000; Symula et al., 2003). Several authors agree that no single model could adequately explain Amazonian diversity, and that different mechanisms should be relevant in speciation processes of different faunal groups (Noonan and Wray, 2006; Zeisset and Beebee, 2008; Haffer, 2008; Antonelli et al., 2010).
Alternative hypothesis for the origin of the Neotropical diversity have been tested in the last years. For example, the hypothesis of the Pleistocene refuge received support from the study by Carnaval and Moritz (2008), who found that paleoclimate modelling predicted the presence of historical refugia that matched current centres of endemism and biodiversity patterns. On a different study, Carnaval et al. (2009) found that areas of historical stability within Atlantic Forest presented higher genetic diversity than populations from unstable areas, providing support for the Pleistocene refuge hypothesis. Some
Chapter 1
support was also found for the role of Pleistocene climatic fluctuations in shaping phlylogeographic pattern and historical demography of the Neotropical rattlesnake, Crotalus durissus (Wüster et al., 2005; Quijada-Mascareñas et al., 2007). However, evidence from Amazonian lizard and amphibian taxa showed that, in the studied cases, interspecific, and even intraspecific diversification occurred well before the Pleistocene, dismissing the Pleistocene refugia as the mechanism for Amazonian diversification (Glor, 2001; Elmer et al. 2007; Gamble et al., 2008). There is also recent evidence contradicting the influence of historical refugia in the diversification of an Atlantic forest anuran (Thomé et al., 2010). An alternative hypothesis, the disturbance-vicariance hypothesis, received some support from the study of the phylogeographic patterns of the poison frog Dendrobates tinctorius (Noonan and Gaucher, 2006). Several authors agree that no single model could adequately explain Amazonian diversity, and that different mechanisms should be relevant in speciation processes of different faunal groups (Noonan and Wray, 2006; Zeisset and Beebee, 2008; Haffer, 2008; Antonelli et al., 2010).
1.7 – Thesis Objectives
In face of the intensification of deforestation and agriculture pressure in Cerrado and Amazonia, most precisely in the deforestation arc and the transitional area between these two biomes, it becomes essential to have a clear picture of the regional biodiversity. There are plans for the establishment of a corridor of conservation areas in the middle Araguaia basin, involving several parks, sustainable use and indigenous areas, which also requires understanding how and if the conservation strategy for the region will be able to cope with the current threats and accomplish its long-term objectives of preserving the regional biodiversity.
Having this in mind, and choosing herpetofauna as the target faunal group, our main objectives are: to improve the knowledge on the amphibian and lizard assemblages in the region of the middle Araguaia River, namely how these are distributed across different conservation areas with different conservation statuses; to understand the intra-specific patterns of genetic structure and diversity for different species with different ecological features, within this region; and to to assess the potential of different methodologies for the study and monitoring of the regional herpetofauna.
General Introduction and Objectives
15
that I considered relevant in the context of this thesis: the two merging biomes; the economic and political context with focus on land use, current threats and conservation units; the characterization of the Araguaia hydrodynamics and the human impacts upon it; the characterization of the herpetofauna of Cerrado and Amazonia, within the Brazilian context, and finally the potential influence of rivers upon species diversification. Chapters II and III are presented with the objective of providing some information on the methods used during the collection of biological data. Fieldwork occupied more than two years of this study and is generally one of the most time-consuming tasks when studying biodiversity. We hope that the systematization of this kind of information might prove to be valuable for future researchers. Chapter IV focus on the distribution of amphibian and squamate species across the different conservation units, in an attempt to understand what is in fact being preserved and what is being left at the mercy of the fast-growing regional development. Chapters V and VI are focused on the role of the Araguaia on the diversification, respectively, of amphibian and lizard populations. In Chapter VII I try to summarize the main findings of the previous chapters and integrate them again in the larger context of the mid-Araguaia basin.
References
Adalsteinsson S.A., Branch W.R., Trape S., Vitt L.J. and Hedges S.B. (2009). Molecular phylogeny, classification, and biogeography of snakes of the family Leptotyphlopidae (Reptilia, Squamata). Zootaxa 2244:1-50.
Anderson A.B., Jenkins C.N. (2006). Applying Nature’s Design – Corridors as a strategy for biodiversity conservation. Columbia University Press, New York.
Antonelli A., Quijada-Mascareñas A., Crawford A.J., Bates J.M., Velazco P.M. and Wüster W. (2010). Molecular studies and phylogeography of Amazonian tetrapods and their relation to geological and climatic models. In: Hoorn C. and Wesselingh F.P. Amazonia: Landscape and Species Evolution – a Look into the Past, 1st edition, Wiley-Blackwell, West Sussex.
Aquino S., Latrubesse E.M. and Sousa Filho E.E. (2008). Relações entre o regime hidrológico e os ecossistemas aquaticos da planície aluvial do Araguaia. Acta Sci. Biol. Sci 30(4):361-369. ARPA (2011). Programa Áreas Protegidas da Amazônia – Conservation Units. Available at
http://www.programaarpa.org.br/en/conservation-units.html. ARPA. Captured on 31 of March, 2011.
Ataídes A.G. (2009). Parâmetros populacionais, aspectos reprodutivos e importância socioeconômica de Podocnemis unifilis (Troschel, 1848) (Testudines, Podocnemididae),
Chapter 1
no entorno do Parque Nacional do Araguaia, Tocantins. MSc Thesis, Universidade Federal do Tocantins, 154pp.
Ávila-Pires T.C.S. (1995). Lizards of Brazilian Amazonia (Reptilia:Squamata). Zoologische Verhandelingen, 299:1-706.
Ávila-Pires T.C.S., Hoogmoed M.S. and Vitt L.J. (2007). Herpetofauna da Amazônia. In: Nascimento L.B., Oliveira M.E. (eds). Herpetologia no Brasil II. Sociedade Brasileira de Herpetologia, Belo Horizonte, pp 13-43.
Azevedo-Ramos C. and Galatti U. (2002). Patterns of amphibian diversity in Brazilian Amazonia: conservation implications. Biological Conservation 103: 103-111.
Bastos R.P. (2007). Anfíbios do Cerrado. In: Nascimento L.B., Oliveira M.E. (eds). Herpetologia no Brasil II. Sociedade Brasileira de Herpetologia, Belo Horizonte, pp. 87-100.
Bates J.M., Haffer J. And Grismer E. (2004). Avian mitochondrial DNA sequence divergence across a headwater stream of the Rio Tapajós, a major Amazonian river. Journal of Ornithology 145:199-205.
Bernarde P.S., Macedo L.C. (2008). Impacto do desmatamento e formação de pastagens sobre a anurofauna de serapilheira em Rondônia. Iheringia Serie Zoologia 98(4):454-459.
Bini L.M., Diniz-Filho J.A., Rangel T.F.L.V.B., Bastos R.P. and Pinto M.P. (2006). Challenging Wallacean and Linnean shortfalls: knowledge gradients and conservation planning in a Biodiversity hotspot. Diversity and Distributions 12(5): 475-482.
Bond W.J. and Parr C.L. (2010). Beyond the forest edge: ecology, diversity and conservation of the grassy biomes. Biological Conservation (in press) doi:10.1016/j.biocon.2009.12.012. Brandão R.A. and Araújo A.F.B. (2008). Changes in anuran species richness and abundance
resulting from hydroelectric dam flooding in Central Brazil. Biotropica 40(2):263-266. Bridgewater S., Ratter J.A. and Ribeiro J.F. (2004). Biogeographic patterns, Beta-diversity and
dominance in the cerrado biome of Brazil. Biodiversity and conservation 13: 2295-2318. Campos M.T., Nepstad D.C. (2006). Smalholders, The Amazon’s New Conservationists.
Conservation Biology 20(5):1553-1556.
Cano P.D., Leynaud G.C. (2010). Effects of dire and cattle grazing on amphibians and lizards in northeastern Argentina (Humid Chaco). European Journal of Wildlife Research 56:411-420. Carnaval A.C. and Moritz C. (2008). Historical climate modelling predicts patterns of current
biodiversity in the Brazilian Atlantic forest. Journal of Biogeography 35(7): 1187-1201. Carnaval A.C., Hickerson M.J., Haddad C.F.B., Rodrigues M.T. and Moritz C. (2009). Stability
predicts genetic diversity in the Brazilian Atlantic forest hotspot. Science 323: 785-789. Carvalho F.M.V., De Marco P.Jr., Ferreira L.G. (2009). The Cerrado into-pieces: Habitat
fragmentation as a function of landscape use in the savannas of Central Brazil. Biological Conservation 142:1392-1403.
General Introduction and Objectives
17 Cavalcanti R.B. and Joly C.A. (2002). Biodiversity and Conservation priorities in the Cerrado region. In Oliveira P.S., Marquis R.J. (eds): The Cerrados of Brazil – Ecology and Natural History of a Neotropical Savanna. Columbia University Press, New York, 351-367.
Cerling T.E., Harris J.M., MacFadden B.J., Leakey M.G., Quade J., Eisenmann V. and Ehleringer J. (1997). Global vegetation change through the Miocene/Pliocen boundary. Nature 389:153-158.
CI-Brasil (2011). Conservação Internacional Brasil – Mapa de projectos. Available at http://www.conservation.org.br/onde/. Conservação Internacional Brasil. Captured on 31 of March, 2011.
Clement C.R. (2006). Demand for two classes of traditional agroecological knowledge in modern Amazonia. . In: Posey D.A. and Balick M.J. (eds). Human Impacts on Amazonia – the role of traditional ecological knowledge in conservation and development. Columbia University Press, New York.
Coe M.T., Costa M.H. and Soares-Filho B.S. (2009). The influence of historical and potential future deforestation on the stream flow of the Amazon River – Land surface processes and atmospheric feedbacks. Journal of Hydrology 369:165-174.
Coe M.T., Latrubesse E.M., Ferreira M.E. and Amsler M.L. (2011). The effects of deforestation and climate variability on the stream flow of the Araguaia River, Brazil. Biogeochemistry, DOI 10.1007/s10533-011-9582-2.
Colli G.R., Bastos R.P. and Araujo A.F.B. (2002). The character and dynamics of the Cerrado Herpetofauna. In Oliveira P.S., Marquis R.J. (eds): The Cerrados of Brazil – Ecology and Natural History of a Neotropical Savanna. Columbia University Press, New York, 223-241. Colwell R.K. (2000). A barrier runs through it…or maybe just a river. Proceedings of the National
Academy of Sciences 97(25):13470-13472.
Costa G.C., Nogueira C., Machado R.B and Colli G.R. (2007). Squamate richness in the Brazilian Cerrado and its environmental–climatic associations. Diversity and Distributions 13(6): 714-724.
Cruz C.A.G. and Feio R.N. (2007). Endemismos em anfíbios em áreas de altitude na Mata Atlântica no sudeste do Brasil. In: Nascimento L.B., Oliveira M.E. (eds). Herpetologia no Brasil II. Sociedade Brasileira de Herpetologia, Belo Horizonte, pp. 117-126.
Daly J.W., Caceres J., Moni R.W., Gusovsky F., Moos M.Jr., Seamon K.B., Milton K. and Myers C.W. (1992). Frog secretions and hunting magic in the upper Amazon: identification of a peptide that interacts with an adenosine receptor. Proceedings of the National Academy of Sciences 89:10960-10963.
Diniz-Filho J.A.F., Bini L.M., Pinto M.P., Rangel T.F.L.V.B., Carvalho P. and Bastos R.P. (2006). Anuran species richness, complementarity and conservation conflicts in Brazilian Cerrado. Acta Oecologica 29:9-15.
Chapter 1
Diniz-Filho J.A.F., Bini L.M., Pinto M.P., Rangel, T.F.L.V.B., Carvalho P., Vieira S.L. and Bastos R.P. (2007). Conservation biogeography of anurans in Brazilian Cerrado. Biodiversity and Conservation 16:997-1008.
Duellman W.E. (1979). The South American herpetofauna: its origin, evolution and dispersal. The Museum of Natural History, The University of Kansas, Lawrence.
Duellman W.E. and Trueb L. (1994). Biology of Amphibians. The Johns Hopkins University Press, Baltimore.
Elmer K.R., Dávila J.A. and Lougheed S.C. (2007). Cryptic diversity and deep divergence in an upper Amazonian Leaflitter frog, Eleutherodactylus ockendeni. BMC Evolutionary Biology 7:247.
Esselman, P.C., and Opperman J.J. (2010). Overcoming information limitations for the prescription of an environmental flow regime for a Central American river. Ecology and Society 15(1):6. Fachín-Teran A., Vogt R.C. and Thorbjarnarson J.B. (2004). Patterns of use and hunting of turtles
in the Mamirauá sustainable development reverse, Amazonas, Brazil. In : Silvius K.M., Bodmer R.E., Fragoso J.M.V. (eds) People in nature – Wildlife conservation in South and Central America. Columbia University Press, New York.
Fagundes N.J.R., Kanitz R. and Bonatto S.L. (2008). A reevaluation of the native American MtDNA genome diversity and its bearing on the models of early colonization of Beringia. PLOS One 3(9):e3157.
Fagundes N.J.R., Ray N., Beaumont M., Neuenschwander S., Salzano F.M., Bonatto S.L. and Excoffier L. (2007). Statistical evaluation of alternative models of human evolution. Proceedings of the Natural Academy of Sciences 104(45):17614-17619.
Faivovich J., Haddad C.F.B., Garcia P.C.A., Frost D.R., Campbell J.A. and Wheeler W.C. (2005). Systematic review of the frog family Hylidae, with special reference to Hylinae: phylogenetic analysis and taxonomic revision. Bulletin of the American Museum of Natural History 294, 240pp.
Fearnside P.M. (2001). Environmental impacts of Brazil’s Tucuruí dam: unlearned lessons for hydroelectric development in Amazonia. Environmental Management 27(3):377-396. Fearnside P.M. (2005). Deforestation in Brazilian Amazonia: history, rates, and consequences.
Conservation Biology 19(3):680-688.
Filgueiras T.S. (2007). Herbaceous Plant Communities. In Oliveira P.S., Marquis R.J. (eds): The Cerrados of Brazil – Ecology and Natural History of a Neotropical Savanna. Columbia University Press, New York, 91-120.
Fitzgerald L.A., Chani M.J. and Donadío O.E. (1991). Tupinambis lizards in Argentina: Implementing management of a traditional exploited resource. In: Robinson J.G. and Rdford K.H (eds). Neotropical wildlife use and conservation, The University of Chicago Press, Chicago.