MODELING OF A HYDROGEN
PRODUCTION PLANT SUPPORTED
BY WIND AND SOLAR
PHOTOVOLTAIC SOURCES
Research Dissertation Report of the Master’s
Degree in Biological and Chemical Engineering
ADVISOR
Doctor Fátima Serralha
SUPERVISOR
Doctor Rui Borges
October 2020
FLÁVIA INÊS DE
SOUSA FRANCO
ii
FLÁVIA INÊS DE
SOUSA FRANCO
MODELING OF A HYDROGEN
PRODUCTION PLANT SUPPORTED
BY WIND AND SOLAR
PHOTOVOLTAIC SOURCES
JURY
President: Doctor Lurdes Gameiro, ESTBarreiro/IPS Supervisor: Doctor Rui Borges, Direção Geral de
Energia e Geologia
Member: Engineer João Marques, Lisboagás –
Sociedade Distribuidora de Gás Natural de Lisboa, S.A. – yielded to Galp Energia S.A.
“I cannot teach anybody anything. I can only make them think.” Socrates
i
A
CKNOWLEDGMENTSI want to leave a special thanks to all those who accompanied me on this journey and who have somehow contributed to its realization.
First of all, I want to thank my family for everything, for the affection, love and especially for patience.
To Pedro for all the love, affection and patience over the last few months.
To Raquel and Viriato for their unconditional support and encouragement throughout all the years of friendship.
To Nuno, Alexandre, Sofia and the others for the companionship and consideration in these last 2 years.
To my advisor Rui Borges for the tireless help, the support provided throughout the time and for the learning opportunity.
To my co-advisor Fátima Serralha for affection, support and always good mood.
To the DGEG team for the prompt readiness to receive me and for all the help provided.
To the Secretary of State, João Galamba, and his team for participating in the discussion of results.
iii
R
ESUMOCada vez mais é notório o impacto ambiental ao qual o planeta Terra se encontra sujeito devido ao consumo energético da humanidade. Uma das consequências deste consumo energético são as alterações climáticas, provocadas pelas emissões e acumulação de gases com efeito de estufa na atmosfera, em particular de CO2. Por essa razão, as alterações
climáticas tornaram-se um tema fulcral do debate político, que se tem centrado na discussão do tipo de medidas a adotar para mitigar o impacto das alterações climáticas, mas também para, no médio/longo prazo, controlar as suas causas. Portugal sendo um dos membros integrantes da União Europeia e duplo signatário do Acordo de Paris adotou objetivos ambiciosos para atingir a neutralidade carbónica até 2050, permitindo a criação de modelos de consumo energético mais sustentáveis, resilientes e ordenados para os objetivos pretendidos.
Neste âmbito, o hidrogénio apresenta-se como um pilar sustentável e complementar do sector energético, podendo ser utilizado na estratégia de transição para uma economia descarbonizada. Deste modo, Portugal aprovou recentemente uma Estratégia Nacional para o Hidrogénio, que entre os seus objetivos prevê a instalação de um projeto industrial de produção de H2 através da eletrólise da água, alimentado por parques renováveis dedicados
(com base em energia solar fotovoltaica e/ou energia eólica) e que terá sede em Sines.
Esse projeto industrial constitui o objeto de estudo da presente dissertação. Neste trabalho usámos o software energyPLAN para construir um modelo de simulação do funcionamento desse projeto industrial. Primeiramente foram elaborados diversos cenários para a avaliação do projeto tendo em conta diferentes condições meteorológicas e modos de produção. De seguida procedeu-se à análise em termos técnico e económicos.
Os resultados obtidos permitiram concluir, do ponto de vista técnico que a fonte eólica apresenta-se como uma fonte de produção mais rentável do que a potência fotovoltaica. A instalação de uma central de produção de hidrogénio requer vultuosos investimentos sendo os eletrolizadores a componente mais exigente do ponto de vista de investimento de capital. Por essa razão, as soluções em que se obtém maior produção anual de H2 não são
verificando-iv
se que os resultados economicamente mais rentáveis requerem somente 1 GW de eletrolisador alimentados por energia solar fotovoltaica. Numa perspetiva futura, conclui-se que, do ponto de vista dos custos de produção por unidade de produto, há uma gama relativamente ampla de expectativas de retorno do investimento para a qual o hidrogénio verde será capaz de competir com o hidrogénio produzido através de combustíveis fósseis.
v
A
BSTRACTThe environmental impact to which planet Earth is subject is increasingly evident due to the energy consumption of humanity. One of the consequences of this energy consumption is climate change, caused by emissions and the accumulation of greenhouse gases in the atmosphere, in particular CO2. For this reason, climate change has become a central theme
of the political debate, which has focused on discussing the type of measures to be taken to mitigate the impact of climate change, but also, in the medium/long term, to control its causes. Portugal, being one of the European Union's members and a double signatory to the Paris Agreement, adopted ambitious goals to achieve carbon neutrality by 2050, allowing the creation of more sustainable, resilient and orderly energy consumption models for the intended objectives.
In this context, hydrogen presents itself as a sustainable and complementary pillar of the energy sector and can be used in the strategy of transition to a decarbonized economy. In this way, Portugal recently approved a National Hydrogen Strategy, which among its objectives foresees the installation of an industrial H2 production project through water electrolysis,
powered by dedicated renewable parks (based on photovoltaic solar energy and/or wind energy) and will be based in Sines.
This industrial project is the object of study of this dissertation. In this work we used the energyPLAN software to build a simulation model for the operation of this industrial project. First, several scenarios were developed for the evaluation of the project taking into account different weather conditions and production methods. Then, the analysis was carried out in technical and economic terms.
The results obtained allowed us to conclude, from a technical point of view, that the wind source is presented as a more profitable production source than the photovoltaic power. The installation of a hydrogen production plant requires large investments, with electrolyzers being the most demanding component in terms of capital investment. For this reason, the solutions in which greater annual H2 production is obtained are not necessarily the most interesting
solutions from an economic point of view, as the most economically profitable results require only 1 GW of electrolyzer powered by photovoltaic solar energy. In a future perspective, it is
vi
concluded that, from the point of view of production costs per unit of product, there is a relatively wide range of expectations of return on investment for which green hydrogen will be able to compete with hydrogen produced by fuels fossils.
vii
G
ENERALC
ONTENTS ACKNOWLEDGMENTS ... i RESUMO ... iii ABSTRACT ... v LIST OF FIGURES ... ixLIST OF TABLES ... xiii
SYMBOLS AND ABBREVIATIONS ... xv
Contents
1. Introduction ... 12. State of the art... 3
2.1 The Portuguese energy system ... 3
2.1.1 Future perspectives on the energy system ... 8
2.2 Hydrogen ... 13
2.2.1 Hydrogen production... 15
2.2.1.1 Hydrogen from fossil sources ... 16
2.2.1.2 Hydrogen from renewable energy sources ... 17
2.2.1 Hydrogen applications ... 21
2.3 Hydrogen in Portugal ... 24
3. Energy system modeling... 27
3.1 Energy modeling tools ... 27
3.1.1 energyPLAN ... 31
3.2 Methodology ... 32
3.2.1 Data analysis and selection... 33
3.2.2 Description of H2 production scenarios ... 35
3.2.3 Technical analysis ... 40
3.2.4 Economic analysis ... 40
4. Results ... 45
viii
4.1.1 Scenario A – H2 production in Constant Regime ...45
4.1.2 Scenario B – H2 Production in Self-sufficiency Regime with Single RES ...48
4.1.3 Scenario C – Production in Self-sufficiency Regime with Combined RES ...53
4.1.4 Scenario D – H2 Production in Self-sufficiency Regime with Single RES and a minimum load of 20% of electrolyzer nominal capacity ...56
4.1.5 Scenario E - H2 Production in Combined Self-sufficiency Regime with a minimum electrolyzer load of 20% nominal capacity ...61
4.2 Discussion of Analysis ...63
4.3 Economic analysis ...66
4.3.1 Sensitivity analysis ...79
5. Conclusions and further work ... 87
Bibliography ...91 Annex I - Weather conditions
ix
LIST OF FIGURES
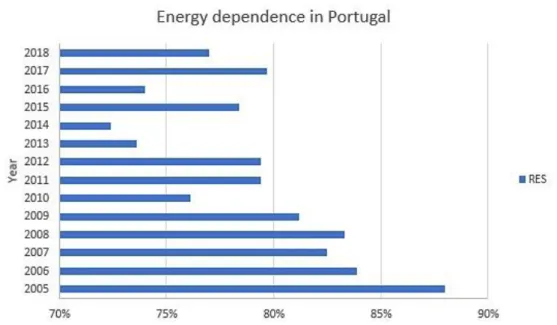
Figure 1: Energy dependence since 2005 until 2018. ... 4
Figure 2: Consumption of primary and final energy. ... 4
Figure 3: Percentage of renewable energy in GFEC. The orange line is the fraction of renewable energy in the GFEC. The blue line is the trajectory defined by the RES Directive. Adapted from DGEG (2019). ... 5
Figure 4: RE in transport. Adapted from DGEG. ... 5
Figure 5: RE in Electricity. Adapted from DGEG. ... 6
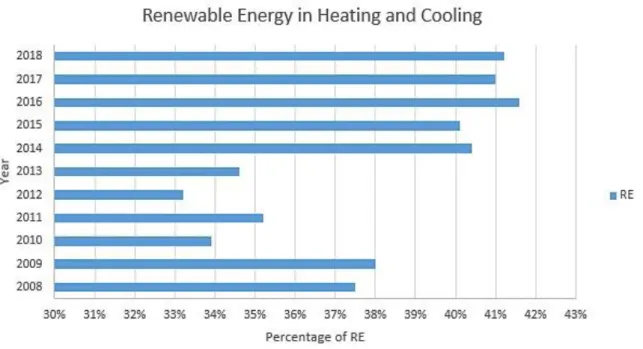
Figure 6: RE in Heating and Cooling. Adapted from DGEG. ... 7
Figure 7: Emissions of CO2 since 1990 until 2017. ... 7
Figure 8: National targets established by Portugal. Own source according to PNEC (2019). 10 Figure 9: Evolution of GHG since 1990 and minimization goals established. Adopted from PNEC (2019). ... 12
Figure 10: The hydrogen cycle. Adopted from AP2H2. ... 14
Figure 11: Different sources for hydrogen production. ... 16
Figure 12: Schematic illustration of the alkaline electrolyzer cell. ... 18
Figure 13: Schematic illustration of the PEM cell. ... 19
Figure 14: Energy storage. ... 22
Figure 15: Illustration of how energyPLAN works. ... 31
Figure 16: Electric energy produced by RES... 33
Figure 17: Hydrogen production scheme. The black arrows represent the origin of the electricity to power the electrolyzer while the gray arrow represents the product obtained. .. 36
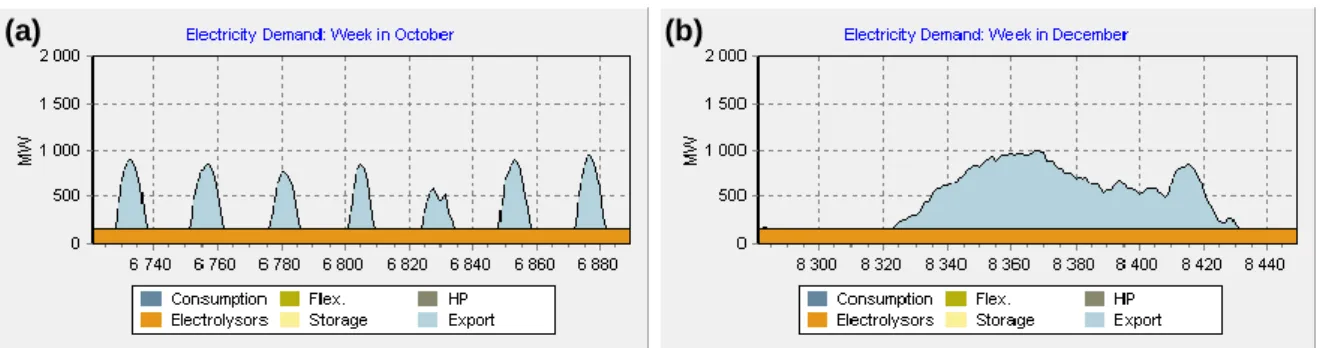
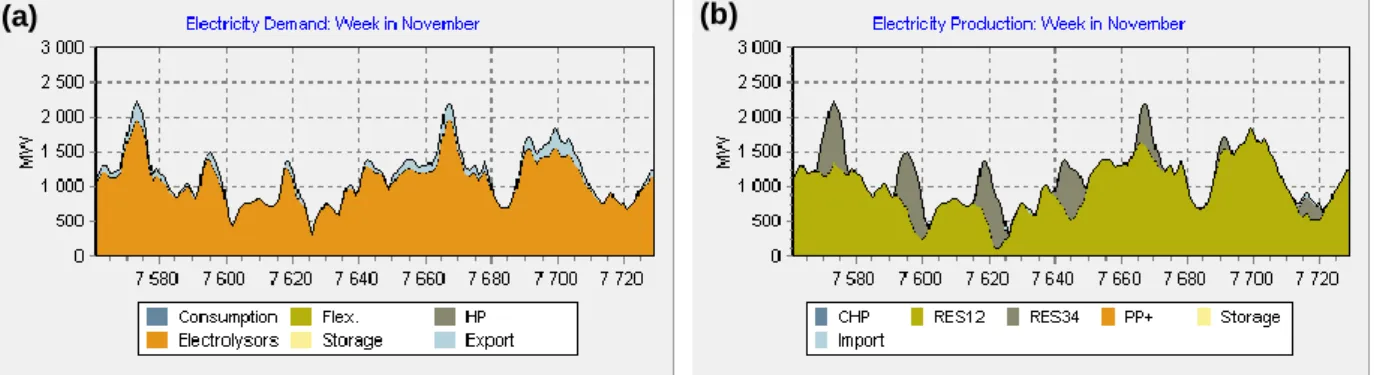
Figure 18: Demand of electricity, in Scenario A, in a sunny year with: (a) photovoltaic power; (b) wind power. ... 37
Figure 19: Electricity production with (a) photovoltaic power and (b) wind power. The blue color represents the imports necessary for the production of H2. The gray and green color represents the production of electricity by the photovoltaic power and wind power, respectively. ... 37
Figure 20: Electrolyzer load (a) and Production (b) of electricity, in Scenario B, with photovoltaic power in a sunny year. ... 38
Figure 21: Electrolyzer load (a) and Production (b) of electricity in Scenario C, in a sunny year. ... 38
Figure 22: Electrolyzer load (a) and Production (b) of electricity in Scenario D with photovoltaic power, in a sunny year. ... 39
Figure 23: Electrolyzer load (a) and Production (b) of electricity in Scenario E in a sunny year. ... 39
x
Figure 24: Electricity imports and exports in a sunny year for a 1 GW electrolyzer powered by photovoltaic power with 1 GW. In this case, the point where electricity imports and exports are equal corresponds to an annual production of 1.3 kton of H2. ... 46
Figure 25: Import Balance in a sunny year with: (a) photovoltaic power; (b) wind power. ... 46 Figure 26: H2 production in Constant Regime. ... 47
Figure 27: (a) Electricity production with 1 GW of photovoltaic power; (b) Load curve for a 1 GW electrolyzer. ... 48 Figure 28: (a) Electricity production with 1 GW of wind power; (b) Load curve for a 1 GW electrolyzer. ... 49 Figure 29: H2 production in Self-sufficiency Regime with photovoltaic power in sunny and windy
year... 49 Figure 30: Electricity production by 3GW of photovoltaic power with: (a) 2 GW of electrolyzer; (b) 3 GW of electrolyzer. ... 50 Figure 31: H2 production in Self-sufficiency Regime with wind power in sunny and windy year.
... 51 Figure 32: Example of a distribution curve, in a sunny year, with 1 GW of electrolyzer and 1 GW of photovoltaic power. ... 52 Figure 33: Example of a distribution curve, in a sunny year, with 1 GW of electrolyzer and 1 GW of wind power. ... 52 Figure 34: Import Balance in Self-sufficiency Regime with Singles RES, in a sunny year, with: (a) photovoltaic power; (b): wind power. ... 53 Figure 35: (a): Example of electricity production with 1 GW of photovoltaic power combined with 1 GW of wind power. Green color represents the wind power and grey color the photovoltaic power; (b): Load curve for 1 GW of electrolyzer. ... 54 Figure 36: H2 production in Self-sufficiency Regime with Combined RES in a: (a) sunny year;
(b): windy year. ... 54 Figure 37: Import Balance in Self-sufficiency Regime with Combined RES, in sunny year. .. 55 Figure 38: Example of a distribution curve for Combined RES (1 GW of photovoltaic with 1 GW of wind power) with 1 GW of electrolyzer, in a sunny year. ... 56 Figure 39: (a): Example of electricity production with 1 GW of photovoltaic power; (b): Load curve for 1 GW of electrolyzer. The production has a minimum of 200 MW. ... 57 Figure 40: H2 production with photovoltaic power in a sunny year with: (a): Production in
Self-sufficiency Regime with Single RES in scenario B; (b): Production in Self-Self-sufficiency Regime with Single RES and a minimum load of 20% of electrolyzer nominal capacity. ... 58 Figure 41: H2 production with wind power in a sunny year with: (a): Production in
Self-sufficiency Regime with Single RES; (b): Production in Self-Self-sufficiency Regime with Single RES and a minimum load of 20% of electrolyzer nominal capacity. ... 59 Figure 42: H2 Production in Self-sufficiency Regime with Single RES and a minimum load of
20% of electrolyzer nominal capacity, in a windy year, with: (a) photovoltaic power; (b): wind power. ... 59 Figure 43: Distribution curve for 1 GW of wind power, in a sunny year, with 1 GW of electrolyzer and 20% of minimum production. ... 60 Figure 44: Import balance, in a sunny year, with photovoltaic power in: (a) Self-sufficiency Regime with Single RES; (b): Self-sufficiency Regime with Single RES and a minimum load of 20% of electrolyzer nominal capacity. ... 60
xi
Figure 45: Import balance, in a sunny year, with wind power in: (a) Self-sufficiency Regime with Single RES; (b): Self-sufficiency Regime with Single RES and a minimum load of 20% of
electrolyzer nominal capacity. ... 61
Figure 46: Example of electricity production with 1 GW of photovoltaic power combined with 1 GW of wind power; (b): Load curve for 1 GW of electrolyzer. The production has a minimum of 200 MW. ... 61
Figure 47: H2 production in a sunny year with: (a): Production in Self-sufficiency Regime with Combined RES; (b): Production in Self-sufficiency Regime with Combined RES and a minimum load of 20% of electrolyzer nominal capacity. ... 62
Figure 48: Import balance, in a sunny year, in: (a) Self-sufficiency Regime with Combined RES; (b): Self-sufficiency Regime with Combined RES and a minimum load of 20% of electrolyzer nominal capacity. ... 63
Figure 49: Example of a nomenclature... 63
Figure 50: The 12 most productive scenarios of the plant with a production higher than 90 ktH2/year. The blue line is the production by electric input power. The orange line is the production by output power. ... 64
Figure 51: Electricity exchanges with the national electricity grid of the 12 technical most productive scenarios. The blue and orange line are the imports and exports, respectively. .. 65
Figure 52: Equivalent full load hours of electrolyzer production in technical analysis. ... 65
Figure 53: Volume of water consumed in the electrolysis reaction in each scenario in millions of m3/year. The grey line is the grid water distribution in the municipality of Santiago do Cacém in 2017. The orange line is the grid water distribution in the municipality of Sines in 2017. .. 66
Figure 54: Total Annualized Costs of the plant for each scenario. ... 67
Figure 55: LCOH of each configuration. The numbers represent the 144 configurations belonging to the 5 scenarios under study. ... 68
Figure 56: Investment productivity of each configuration. ... 69
Figure 57: H2 annual productivity of the 12 best economic configurations. The blue line is the productivity by GW of electric input power. The orange line is the productivity by GW of H2 output power. ... 72
Figure 58: Electricity exchanges with the national grid of the 12 best economic configurations. The blue and orange lines are the imports and exports, respectively. ... 73
Figure 59: Equivalent full load hours of electrolyzer production of the 12 best economic configurations. ... 74
Figure 60: Volume of water consumed by the configurations selected in millions of m3/year. The grey line is the water consumption of the municipality of Santiago do Cacém in 2017. The orange line is the water consumption by the municipality of Sines in 2017. ... 75
Figure 61: Annualized Investment Costs of the 12 selected configurations. ... 76
Figure 62: Total Annual Costs of the 12 selected configurations. ... 77
Figure 63: LCOH of the 12 selected configurations. ... 78
Figure 64: LCOE of the 12 selected configurations is represented with a blue line. According to IRENA, in 2030, electricity can have a LCOE of 21 €/MWh (orange line). It was considered a discount rate of 3%. ... 79
Figure 65: LCOH for different discount rates, being these: 3%, 9% and 15%, with green, blue and yellow color respectively. The dashed delimited section represents the LCOH range, in 2030, for H2 produced from fossil fuels. ... 80
xii
Figure 66: LCOH for a discount rate of: (a) 3% and (b) 9%. ... 81 Figure 67: LCOH for a discount rate of 15%. ... 81 Figure 68: LCOH for different discount rates, being these: 3%, 9% and 15%, with green, blue and yellow color respectively. The dashed delimited section represents the LCOH range, in 2030, for H2 produced from fossil fuels. For this analysis it is considered the use of offshore
wind energy. ... 82 Figure 69: LCOH of the 12 selected configurations. The blue line is the LCOH that does not consider exports to the national grid. The orange line is the LCOH that consider exports to the national grid. It is considered a discount rate of 3%. ... 84 Figure 70: LCOE for different discount rates, being these: 3%, 9% and 15%, with blue, gray and yellow color respectively. According to IRENA, in 2030, the hydrogen can have a LCOE of 21 €/MWh (orange line). ... 85
xiii
LIST OF TABLES
Table 1: Hydrogen characteristics ... 13
Table 2: Study of parameters for different H2 production methods ... 20
Table 3: Parameters of chosen energy modeling systems ... 28
Table 4: Energy sectors included in the modeling systems ... 29
Table 5: Geographical coverage, methodology and resolution of the modeling software ... 30
Table 6: Values considered in modeling ... 35
Table 7: Scenario characteristics. ... 40
Table 8: Value of interest rate and electricity cost defined for the economic data ... 42
Table 9: Values for Investment and Fixed O&M for Renewable Energy and Electrolyzer in 2030 expressed in €2015 ... 42
Table 10: Assumed prices and tariffs for electricity and water in 2030 expressed in €2015 .... 43
Table 11: Nomenclatures for Scenario C ... 53
Table 12: Minimum load value for each electrolyzer nominal capacity ... 57
Table 13: The 12 best economic configurations in terms of the product of investment productivity by H2 output ... 71
xv
SYMBOLS AND ABBREVIATIONS
CCTG Combined cycle gas turbine
CER Chlorine evolution reaction
CH3OH Methanol
CH4 Methane
CO Carbon monoxide
CO2 Carbon Dioxide
DGEG Directorate-General for Energy and Geology EU European Union
FCs Fuel cells
GFEC Gross Final Energy Consumption GHG Greenhouse gas
H&C Heating and cooling H2 Hydrogen
HER Hydrogen evolution reaction KOH Potassium hydroxide
Kt Kilotons kt
LCOE Levelized cost of electricity LCOH Levelized cost of hydrogen
LULUCF Land Use, Land-Use Change and Forestry Mt CO2eq. Million equivalent metric tonnes of carbon dioxide
NaCl Sodium chloride NaOH Sodium hydroxide
xvi
NH3 Ammonia
NZEB Near-zero energy buildings O&M Operation and maintenance OER Oxygen evolution reaction PA Paris Agreement
PEM Polymer electrolyte membrane PSA Pressure swing adsorption PV Solar photovoltaic
RES Renewable energy sources
RNC2050 Roadmap for Carbon Neutrality 2050 STM Steam methane reforming
TMN Transition metal-nitride Toe Tons of oil equivalent
1
1.
Introduction
Over the last few decades, the negative impact of CO2 emissions that the planet has
been subjected to has become more notorious. It is now clear that the energy consumption patterns will have to change very quickly, and on a global scale, if the worst effects of climate change are to be avoided. In 2015, the Paris Agreement (PA) defined that paradigm changes in society are necessary so that the average global temperature does not exceed 1.5°C above the pre-industrial average, in order to control the effects of climate change. Portugal, being a double signatory of the PA prepared a roadmap for identifying decarbonization vectors and their potential of reduction on the diverse national economic sectors. Under the framework of this roadmap, Portugal developed a National Energy and Climate Plan and recently adopted a National Hydrogen Strategy, in which, lays out the role of hydrogen as an integrated and sustainable pillar in the energy transition.
This dissertation work aims to analyze the operation of an H2 production plant from the
electrolysis of water, with characteristics similar to those of the project announced for the Sines region by the National Hydrogen Strategy. Given the fact that this industrial project intends to satisfy most of its energy needs based on dedicated solar and wind power, the analysis involves the dimensioning of renewable production plants of these same resources.
The main objective will be the production of H2 from which various scenarios with
different characteristics of the photovoltaic and wind power plants will be modeled and evaluated.
This dissertation contains 5 chapters. The current chapter presents a brief introduction to the theme under study and the objectives intended for its implementation.
Chapter 2, corresponding to the literature review, is divided into sub-chapters and aims to contextualize the Portuguese energy system and its future perspectives, hydrogen and its properties, and also the expected role of hydrogen in the energy system of Portugal.
The energy system modeling in chapter 3 compares different types of software in modeling and selects the most appropriate one for the analysis of this project. Also, it describes the methodology defined for the technical and economic analysis of the industrial plant.
2
The obtained results from the technical and economic project are described in chapter 4.
3
2.
State of the art
2.1 The Portuguese energy system
Currently, the Portuguese energy system is in a transition period that aims to expand the use of renewable energy sources (RES) in order to reduce greenhouse gas (GHG) emissions and energy imports dependency.
These objectives are framed by a legislative package promoted by the European Union (EU), called 2020 Climate and Energy package, established that by 2020 member states should achieve a reduction of 20% in GHG emissions relative to 2005, the introduction of 20% of RES in Gross Final Energy Consumption (GFEC) with a sectoral target of 10% RES in transport, and 20% savings in Primary Energy Consumption achieved by gains in energy efficiency. These gains are measured against the projections of the EU Reference Scenario (PRIMES2007) for the year 2020. It is also required that each Member State must establish/monitor shares of renewable energy in the production of heat and cold, electricity and also in transport. 1
In 2018, the portuguese energy imports dependency reached 77.0% (Figure 1) making Portugal one of the countries in the EU with the greatest external dependence. It should be noted that this dependency comes largely from the import of fossil fuels, as the portuguese energy system does not use any indigenous fossil energy sources, such as oil or natural gas.
4
According to the synthetic energy balance, the primary energy consumed during 2018 reached 21,7 million tons of oil equivalent (toe) of which 75.5% was supplied by oil, natural gas and coal. In its turn, the final energy consumption was 15,7 ktoe, in which oil and natural gas represented 59.5% as shown in Figure 2. 4
The official data on the penetration of RES is calculated according to a methodology layed out in Directive 2009/28/CE, normally referred to as the “RES directive” or “RED”. Thus, the fraction of RES on GFEC is calculated and published yearly by the Directorate-General for Energy and Geology (DGEG) and can be observed in Figure 3. 4
Figure 2: Consumption of primary and final energy. 4
5
As it is possible to see, the use of RES has increased since 2012 and has always been above the indicative trajectory defined by the RES Directive.
The RES Directive also sets a mandatory target of 10% RES in transport and defines the monitoring of RES penetration in electricity and heating and cooling (H&C). Figure 4 presents the percentage of RE in the transport sector, where it is possible to see the increase over the last decade.
Figure 3: Percentage of renewable energy in GFEC. The orange line is the fraction of renewable energy in the GFEC. The blue line is the trajectory defined by the RES Directive. Adapted from DGEG (2019).
6
The transport sector, due to its heavy technological dependence on the internal combustion engine, offers a particularly difficult challenge for the penetration of RES, registering a total of 9.0% RES in its final energy consumption. This value is due to utilization of biofuels, such as biodiesel and bioethanol in road transport, and also electricity (mainly in rail transport). 56
Currently, the portuguese electricity generation park is changing due to the growing installation of renewable power, specially wind and solar photovoltaic (PV), that is progressively substituting for thermal generation based on fossil fuels. In 2018, the generated electricity had a contribution of 52.6% from RES. Figure 5 presents the percentage of RE in the electricity sector over the last decade.
In the heating and cooling sector, renewable energy sources achieved 41.2%. Figure 6 presents the RE in this sector since 2008.
7
Overall, Portugal seems on track to achieve all the targets set for 2020.
These changes, especially on electric production have favored a decrease in the energy import dependency of 10% during the first decade of the 21st century, although this decrease is not linear because of the strong correlation with the variability of hydrological resources. 7
The GHG emissions, in 2017, stood on 78.0 million equivalent metric tonnes of carbon dioxide (Mt CO2eq.) considering the sector Land Use, Land-Use Change and Forestry (LULUCF). This
value, in Figure 7, corresponds to an increase of 29,12% relative to 1990 emissions, justified by the forest fires of 2017. 8
Figure 7: Emissions of CO2 since 1990 until 2017. 8 Figure 6: RE in Heating and Cooling. Adapted from DGEG. 6
8
However, total emissions show a reduction of 18% compared to 2005 levels, confirming a trajectory of approach to the European targets defined for 2020 and 2030. 8
Despite the efforts made and the notable improvements, Portugal still remains very dependent on the outside for its energy supply, thus impacting in economic and environmental terms. Industry, transport and the electricity generation sector are currently the sectors of activity with the greatest influence on final energy consumption and also on GHG emissions, and those that require the greatest effort for emissions reduction.
2.1.1 Future perspectives on the energy system
In 2015, the Paris Agreement (PA) defined that paradigm changes in society are necessary so that the average global temperature does not exceed 1.5°C above the pre-industrial average, in order to control the effects of climate change. To enter into force at least 55 countries, representing 55% of GHG emissions, would have to deposit their instruments of ratification, approval and acceptance. 9 This was achieved on November 4th, 2016.
Portugal became a double signatory of the PA in April of 2016, due to the fact that it signed for itself and as part of the EU signature. In 2019, the Government prepared the Roadmap for Carbon Neutrality 2050 (RNC 2050) for identifying decarbonization vectors and their potential of reduction on the diverse national economic sectors, collaborating in the most ambitious objectives in the PA.1011
This roadmap has established some visions and guidelines for the evolution of the portuguese energy and LULUCF sectors.10 Part of the Roadmap focuses on renewable resources and
their efficient use, as well as the strengthening of sinks due to their ability to absorb carbon dioxide from the atmosphere. These measures are intended to reduce the costs associated with the effects of climate change and simultaneously creating a more efficient economy.
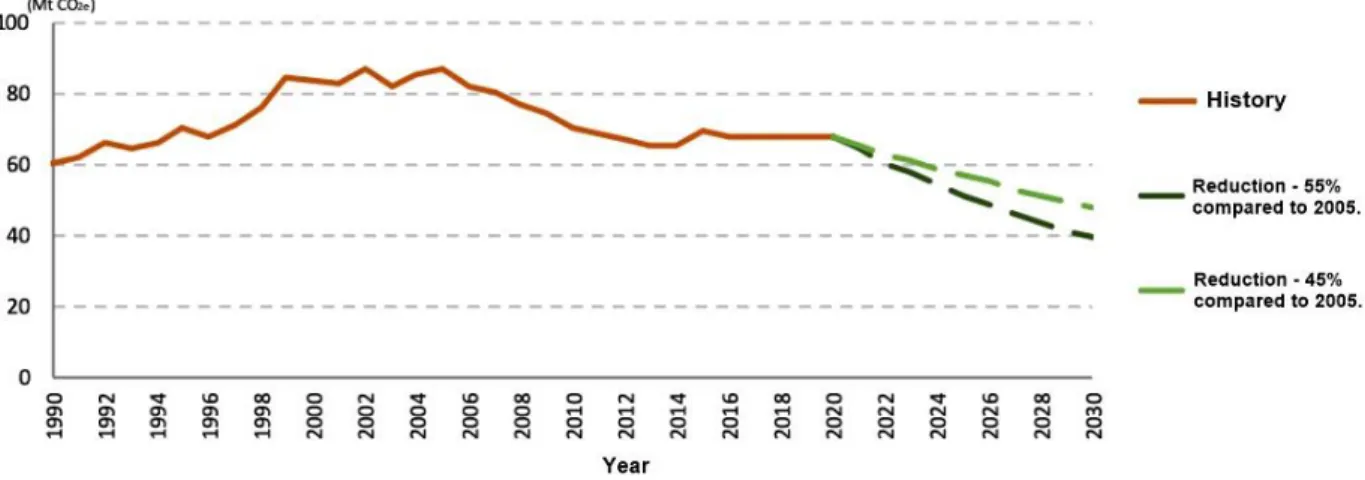
In the decade 2007-2017, Portugal emitted an average liquid total of 60 million tons (Mt) of CO2 and that is the value to reduce till 2050 for achieving carbon neutrality.
For that it will be necessary to get electricity from green resources like wind or solar photovoltaics. The decarbonization of transport will depend on the mass adoption of public transport, electric vehicles and green fuels culminating in a 98% reduction of GHG comparatively to 2005. In buildings, the use of heat exchangers, solar thermal and surface
9
insulation will allow a reduction of 95% in GHG emissions. The use of biomass and electrification as a replacement for fossil fuel burning in industry, can reduce emissions in the sector by 80%. The emissions from animal production can be reduced with the introduction of better feeding and a more efficient management in manure systems. For agriculture GHG emissions will be reduced by the introduction of mineral fertilization and the planting of biodiverse pastures.
The rise of decarbonized energy vectors can contribute to reduce emissions by a further 4%. These vectors include hydrogen produced by electrolysis from renewable sources and biomass for heat generation.
In brief, the RNC2050 allows the identification of guidelines and a long-term planning for achieving a more competitive and carbon neutral economy by 2050. Current technology makes it possible to reach these goals and assure that change is beneficial to all citizens.10
Portugal was the first country in the world to adopt a compromise on carbon neutrality and the RNC 2050 was first presented at the COP22 in Marrakech in 2016.
As a signatory of the PA, the European Commission also has established targets to be achieved by the EU in 2030. These are to reduce, at least, 40% in GHG emissions relative to 1990, to decrease energy consumption by 32.5% by means of energy efficiency gains and increase the share of RES in gross final consumption to 32%. In this way, also strategic packages were adopted that intend to act in the different impacting areas. Here we highlight the Clean Energy Package for all Europeans, the Mobility Package and the Climate 2030 Energy Package. 12
The Clean Energy for all Europeans package aims to provide an energy transition, promote economic growth and stimulate job creation. This legislative package obliges Member States to formulate and deliver to the European Commission a National Integrated Energy and Climate Plan (NECP) for the horizon 2030. The efforts proposed by the different national NECP must combine to reach the overall EU targets described in the previous paragraph. The NECP 2030 document will be the energy and climate policy throughout 2021-2030. 13
In the Portuguese NECP the need to change the economic paradigm and respond to the threats of climate change are aligned with the vision of achieving carbon neutrality in 2050 layed out in the RNC 2050. This strategic choice requires an association of technological
10
possibilities and different policy options, as a carbon neutral economy demands joint action in different areas, in which energy efficiency will be a main priority.
For energy efficiency a transition phase is required, which in Portugal will largely pass through the electricity sector. Portugal can create a decarbonized electricity sector by tapping on endogenous RES, such as sun, wind and water, and also because of the existing virtue of a safe electrical system able to deal with the intermittency of renewable energies. In the electroproduction sector the NECP defines a RES contribution of at least 80% by 2030.
In addition to the evolution of technology, it is considered that informed citizens represent an important vector for the adoption of more efficient and sustainable choices, thus reinforcing the efforts in the fight against global warming.
The natural gas system will also be able to contribute significantly for the achievement of these goals, through the insertion of renewable gases such as hydrogen or biomethane, in the transport and distribution networks. These components, specially hydrogen, can store energy and promote the decarbonization of industry and NECP states the intention of implementing a hydrogen production industry. 14
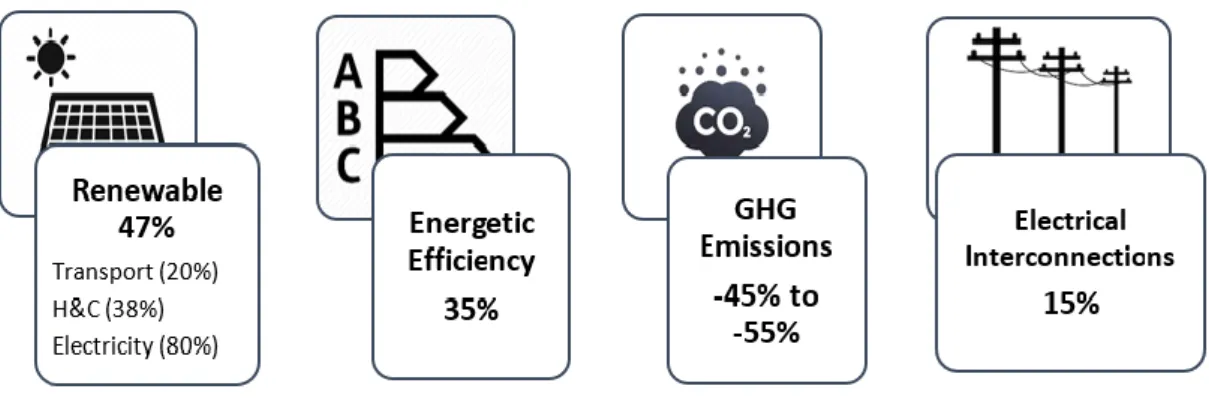
The Portuguese National Energy and Climate Plan has established the following targets for 2030 (Figure 8).
● Renewables (47%): Over time Portugal introduced renewable energies and is today a reference in European leadership. To further increase renewable penetration to 47% of GFEC, the evolution of installed capacity, the production of electricity from renewable sources, the mass adoption of electric vehicles, the insertion of renewable gases and,
11
essentially, innovation and research of green technologies with lower costs are crucial parameters. For that purpose, sectoral targets have been established.
○ Renewables in transport (20%): The promotion of public transport, the expansion of electric mobility, as well the accession to biofuels and hydrogen are indispensable for achieving this target. Road traffic should progressively reduce fossil fuel consumption and incorporate green alternatives, and these measures should also be incorporated in the maritime, aviation and rail transport sectors.
○ Heating and Cooling (38%): The efforts on energy efficiency and electrification of consumption, are expected to induce a reduction in fossil fuels consumption in different sectors. To achieve the established goal it will be necessary to promote the use of biomass, heat pumps (one of the most efficient equipments for heating and cooling), high efficiency cogeneration (that allows significant energy savings and is especially appropriate for highly energy intensive industries), renewable gases (by incorporation on the natural gas transport and distribution networks) and thermal solar (in conjunction with other components such as heat pumps or biomass boilers) on this sector.
○ Electricity (80%): For the decarbonization of electricity production it will be necessary to significantly increase RE capacity, such as onshore/offshore wind, hydroelectricity (reinforcing the conclusion of Alto Tâmega Hydroelectric Complex with capability of 1.2 GW), solar PV, biomass, geothermal and waves.
• Energy Efficiency (35%): Portugal intends to reduce energy consumption, primary or final, by 35% in 2030. This reduction is measured by comparison with the projections of energy consumption in 2030 obtained in the EU Reference Scenario (PRIMES 2007 model).To achieve this goal, it is necessary to optimize some sectors, such as:
○ Buildings: it is necessary to rehabilitate and make buildings more efficient, thus reducing energy needs. The near-zero energy buildings (NZEB) are getting more attention because they have a higher energy performance and their energy needs are almost nonexistent;
○ Industry: it is recommended that resources be used more efficiently assuring the same productivity and competitiveness in industries;
12
○ Transport and mobility: to increase energy efficiency it's crucial investing on public transport and electric mobility;
○ Equipments: the replacement of old and actual equipments for new electrical equipments will allow a reduction in the energy requirements;
○ Agroforestry: the conscious use of energy makes it possible to minimize costs. In this way forestry and agricultural practices can be more efficient and the installation of more effective technologies will be promoted.
• GHG Emissions (-45% a -55%): intends to guarantee the reduction of the national emissions compared to 2005 levels in different sectors, especially in transport, industry, electricity and residual waters. These parameters will have an impact on production and consumption patterns, the organization of spaces and cities and mobility for work or leisure. For effective decarbonization, it is necessary to ensure that all sectors minimize emissions regardless of their technological maturity. Through Figure 9 it’s possible to see the reduction on GHG emissions and a perspective for the future.
• Electrical Interconnections (15%): The establishment of electrical interconnections enables a better development of the Iberian internal market and a better performance through the monitoring and management of energy systems.
The NECP has recently been complemented by the National Hydrogen Strategy. The objectives of the NECP remain unchanged, but hydrogen provides a larger variety of
13
technological pathways to achieve decarbonization. This issue will be addressed in the following section.
2.2 Hydrogen
Molecular hydrogen (H2) can be the key for addressing many environmental challenges given
the fact that it is a non-polluting energy carrier, so for that can be called the Energy of the 21st Century. Hydrogen is the most common and simpler chemical element in the Universe, but its occurrence in the molecular form is rare. In our planet, hydrogen presents itself mostly combined with oxygen and carbon to form water and organic compounds, and therefore it must be separated and extracted.
Molecular hydrogen is characterized as a non-colored, tasteless, odorless, very light (14.4 times lighter than air) and extremely flammable gas at normal temperature and pressure (1 atmosphere and 0 °C respectively). Other physical characteristics are displayed in Table 1. 15 1617
Table 1: Hydrogen characteristics17
Characteristics Value Unit
Molecular weight 2.02 g/mol
Density 0.09 kg/m3
Specific energy
● Higher heating value 142 MJ/kg
● Lower heating value 120 MJ/kg
Melting point - 259.20 °C
Boiling point - 252.77 °C
Critical pressure 13.0 bar
14
H2 cannot be considered a primary energy source, such as natural gas or coal, however, it is
an energy vector 18 produced within the traditional energy system, from fossil fuels or from
renewable sources. 1920
As an energy vector H2 can be used either as a fuel or as a means for storing energy from the
transformation of other forms with high efficiency. H2 can be inserted in the global energy
system (Figure 10), standing out in the storage of excess electric energy production from RES.
21
As a fuel, hydrogen has a higher energy content by mass than any other standard liquid fuel, around three times larger than diesel and gasoline (that have a low heating value of 46 MJ/kg approximately), although with a lower volumetric density. The combustion of H2 has no carbon
emissions while gasoline emits 0.86 kgC/kg. H2 not only has a significant potential as a fuel in
its own right, it can also be used as a product for the fabrication of synthetic fuels when chemically bonded with other components, such as CO2. 1822 The technology that promotes
hydrogen as a fuel is becoming very important, because it allows a cleaner and more renewable energy transition, with evident benefits for the environment.
As an energy vector, H2 can play a major role in future energy systems where the penetration
of RES is expected to be very significant. In such systems, with a high dependence on weather and climate conditions, there can be very large fluctuations in production, with periods when production largely exceeds demand followed by periods when production can be very small. By converting excess energy production into H2, energy could be stored for use in periods of
15
low production. Hydrogen allows storage from the short to the long term and could help smoothing production in highly intermittent energy systems.
For achieving these goals, it is necessary that renewable H2 becomes economically
competitive, having in consideration some parameters like production, storage and distribution.
16
On the production side, it’s important that the negative environmental impacts associated with possible emission of GHG are minimized, that the costs are reduced and the technologies that allow increasing the process efficiency are available. 1618
Storage and transport are two components that strongly influence the value chain of hydrogen. Storage can have different forms depending on H2 use, and its viability depends on safety,
lower weight, volumetric capacity and desorption kinetics. Transport will be influenced by the areas of supply and the availability of infrastructure, also the mode of supply can contribute to the increase in costs and emissions.
2.2.1 Hydrogen production
The production of hydrogen requires physical-chemical processes to synthesize and isolate this molecule.
When produced from RES, H2 is commonly referred to as green hydrogen, when produced
from fossil fuels or from sub products of industrial processes it is designated as brown and grey hydrogen, respectively. 16 The term “blue hydrogen” has been used for H
2 produced from
the reformation of natural gas followed by capture and storage of the emitted CO2.
Worldwide, 96% of hydrogen in utilization has been produced from fossil fuels and only 4% has been produced from RES. Hydrogen can be created using different sources (Figure 11).
16
2.2.1.1 Hydrogen from fossil sources
Of all hydrogen produced from fossil sources, about 18% is produced from coal, 29% from liquid hydrocarbons and 49% from natural gas, with hydrocarbon reforming and gasification as the most common production routes. 18 24 The reforming is the most economical form to
produce hydrogen, achieving values below 2€/kg H2. 16
● Reforming
Hydrocarbon reforming has different ways of producing hydrogen, of which steam reforming (SR) is the most common. Normally the feed is natural gas and the process is designed as steam methane reforming (SMR). This endothermic catalytic process consists of 3 steps: syngas generation; water-gas shift (WGS) and gas purification. In the first stage (eq. 1), an endothermically catalytic reaction of natural gas and steam is converted into syngas (mixture of carbon monoxide (CO) and H2) and requires temperatures between 700 and
900 °C and pressures between 3 and 25 bar.
17
Then the syngas is fed into a WGS reactor (eq. 2) to increase the quantity of hydrogen, culminating in a steam with H2 and CO2.
The final step of the process, gas purification, requires the H2 rich steam to be submitted to
pressure swing adsorption, from which the pure hydrogen gas is obtained.
The heat necessary for the reaction in the SMR process can be supplied by concentrated solar thermal energy, therefore minimizing the associated CO2 emissions. The energy
efficiency of hydrogen production achieves 70 - 85% in industrial scale. 1823
2.2.1.2 Hydrogen from renewable energy sources
Electrolysis is the most common route of production of hydrogen from RES, followed by biomass conversion. Below these two main processes are described.
● Biomass
Biomass is a renewable organic material which includes forest residues, organic municipal solid waste and also animal wastes, agriculture crop residues and dedicated crops. There are two paths for conversion of biomass into hydrogen gas, thermo-chemical conversion and biological conversion. The most commonly used route is the thermo-chemical based on the pyrolysis/gasification process.
Normally the biomass has to be heated in a reactor at high temperatures and under pressure. This step oxidizes the material and produces a gas constituted by H2, CO, CH4
and CO2. The gas stream is subjected again to high temperatures in order to increase
hydrogen content. Subsequently in a pressure swing adsorption (PSA) unit, in which the pressure and partial pressure are alternated to promote adsorption and desorption in order to remove existing impurities, it is produced hydrogen with a high purity level.2526
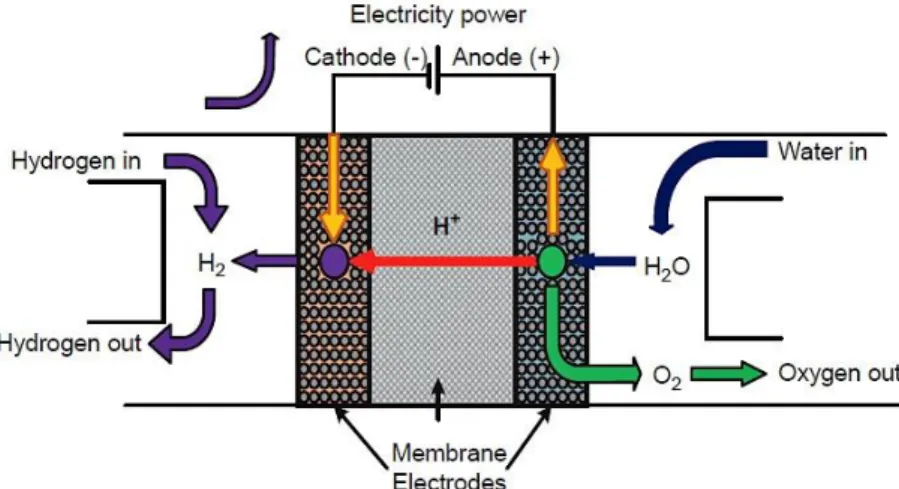
● Electrolysis
Water electrolysis is an electrochemical process based on the use of direct electric current for splitting water into hydrogen and oxygen. An electrolyzer is composed of two electrodes (anode and cathode, positive and negative respectively) and a conductive liquid designed
18
as the electrolyte, in which the electrodes are immersed. Typically, potassium hydroxide (KOH) is added to increase the conductivity of water. 2327
The process is based on the passing of an electric current between anode and cathode through the electrolyte. In this way, the water will split in hydrogen, released from the cathode, and oxygen from the anode. The general chemical equation for the electrolysis reaction is (eq. 3):
The electric current necessary for the process can be produced from renewable energy sources such as wind, biomass or sun. The H2 produced with this technology has a high
level of purity given the fact that the product stream is dried, and the impurities have been removed.
Here we highlight the most common electrolysis technologies such as alkaline electrolyzer and polymer electrolyte membrane (PEM), which differ in efficiency, operational conditions and the material used for electrolyte. 27
Alkaline electrolyzers are the most mature and established technology. They normally
consist of a solution of water and 25% to 30% of KOH, although sodium chloride (NaCl) and sodium hydroxide (NaOH) are also used in the electrolyte. It’s necessary to use a diaphragm for separating the electrodes, keeping the product gases apart and ensuring the efficiency and safety (Figure 12). This component has to be permeable to water molecules and hydroxide ions.
19
The process initiates with the application of electric current between both electrodes. In the cathode the water molecules react with electrons to form OH- ions and H2. The hydroxide
ions pass through the diaphragm towards the anode, where they release the electrons into the electric circuit and combine to form oxygen and water molecules. 2628
Although alkaline electrolysis is the more mature technology, there remain 3 major limiting issues: operating with low pressure, the limited current density due the losses in the diaphragm, and the cross-diffusion of product gases. 27
Polymer electrolyte membrane is the process where H2 is obtained with highest purity.
This system is constituted by a polymer membrane that only allows protons to pass, by the anode and the cathode catalysts, and the electrode layers where the current is applied. Figure 13 shows a schematic representation of a PEM electrolyzer.
This process favors the removal of liquids and gases from the catalyst surfaces. Thus, in the process, the water molecules dissociate into oxygen (O-) and hydrogen ions (H-) on the
anode catalyst. The oxygen is removed, and protons pass through the membrane towards the cathode, where they receive electrons and are converted into hydrogen gas (H2). 27
Nevertheless, this method is limited by the cost of the catalyst and the lifetime of the membrane.
The different types of hydrogen production from renewable or non-renewable sources are compared in Table 2, where it is highlighted the efficiency and also the CO2 emissions of each
process.
20
Table 2: Study of parameters for different H2 production methods
Technology
Fossil Source Renewables Sources
Steam reforming Biomass Alkaline electrolyzer PEM electrolyzer Pa ra m e te rs
Feedstock 29 Hydrocarbons Biomass H2O +
Electricity
H2O +
Electricity
Efficiency 29 70 – 85% 35 – 50% 50 – 60% 55 – 70%
Maturity 29 Commercial Commercial Commercial Near term
Advantages No oxygen requirement 30 Mitigating CO2 emissions 29 No pollution 30 Disadvantages Highest GHG emissions 30 Seasonal availability and high handling
costs 29 High capital costs 30
CO2 Emissions
(measured in
tons) 31
300 million 600 million* 0
*Zero net emissions because biomass pulls CO2 from the air.
Through Table 2 is possible to see that steam reforming is the most common way of production having the highest efficiency, comparatively with the other technologies, and does not consume oxygen for the H2 production. In maturity terms the major methods are in a
commercial scale despite the PEM electrolyzer requiring a high capital cost. An outstanding feature in the hydrogen production technology is that the biomass method allows to mitigate the CO2 emissions and the Alkaline and PEM electrolyzer present zero emissions, quite
advantageous compared with steam reforming that produces large annual emissions of CO2.
However, electrolysis techniques have the disadvantage of using water as raw material. This water is generally of high purity and its production in large volumes is costly. Despite 70% of
21
the world’s surface being covered with water, only 4% of this water is suitable for human consumption. With the continuing growth of the world’s population and its water needs, several suggestions have been considered for the direct production of hydrogen from seawater, since this technology can also produce fresh drinking water, an important production for arid zones.
32
The direct use of seawater for electrolysis still remains a challenge given the reactions that occur with the components of seawater. In this way, one of the problems to overcome is the chlorine evolution reaction (CER), resulting from the splitting of ionic components, that settle on the anode and compete with the oxygen evolution reaction (OER), a process of generating molecular oxygen. The deposition of these elements, such as particles of chlorine or sodium, on the anode limits the equipment and production lifespan. 3233
Another difficulty in this splitting process is the generation of insoluble precipitates on the electrode’s surface. Precipitate such as magnesium hydroxide can intoxicate the hydrogen evolution reaction (HER) catalysts. The reduction in the poisoning of the process has been attempted by using catalysts possessing surface areas with numerous active sites. However, the chloride anions can also corrode the electrodes limiting the development of a seawater splitting process.
Only a small number of studies on water electrocatalysts have been reported, nevertheless a transition metal-nitride (TMN) is a very promising candidate to this process due to its high corrosion-resistance and also for being mechanically strong and electrically conductive. 3233
The scientific literature shows that seawater electrolysis is still al its technological beginnings and it will take some years before it can achieve a technological readiness level compatible with industrial scale applications.
2.2.1 Hydrogen applications
In the future it’s expected that renewable resources produce all electricity, however due to the intermittency of RES, energy storage is really important and H2 can be one of the solutions to
this challenge given its capacity for storage during larger periods of time with larger amounts (Figure 14).34 This characteristic makes H
22
Figure 14 shows that a normal battery can store smaller quantities (1 kW – 1 MW) for shorter periods compared with hydrogen that provides a much larger storage capacity range, from 1 MW to almost 10 GW during long periods, evidencing its advantages over compressed air or pumped hydro storage. In this way, with H2 it is possible to store energy in periods of abundant
production to be used in periods of production scarcity, provide network stabilization services during storms or other events that cause interruptions in the power sources, or provide electricity in remote areas that cannot be reached by electricity grids.
The different storage technologies, such as compressed hydrogen in tanks, underground storage or through chemical compounds allow the transport and conversion back in electricity in locations far from the point of production. 34
In addition to storage capacities H2 also presents different ways of use, thus being able to be
grouped into two large groups: as a feedstock or as an energy vector.
As a feedstock hydrogen has been used for decades in different industrial processes, where it is possible to highlight its use as a raw material for the chemical industry and in metallurgic industry as a reducing agent.
It is an essential building element for the manufacture of ammonia (NH3), hence fertilizers and
methanol (CH3OH), and for processing the intermediates of oil products in refineries. Thereby
it is estimated that 55% of the total H2 production in the world is directed for ammonia synthesis, Figure 14: Energy storage. 34
23
25% for refineries, 10% for the methanol sector and the remaining 10% for other general applications. 35
Hydrogen can be applied for processing crude oil into refined fuels or for removing contaminants, like in hydrocracking. For this application it is estimated that 75% of the hydrogen is obtained from the reforming of natural gas or hydrocarbon fuels. 35
Given its capacity for being an energy vector, this element can be incorporated in the natural gas networks to increase the calorific power or can be converted into CH4 (methane) for the
injection in this network.
Also stored H2 can be converted into electricity through fuel cells (FCs). 3435 In the energy
field H2 is being used into FCs where it is combined with oxygen to produce electricity and
useful heat, having water vapor as its exhaust product. These fuel cells are being introduced in the transport sector, given the fact that they allow the decarbonization of road transport as there are no associated CO2 emissions. The international market has a few models of
passenger cars with hydrogen-powered fuel cells. The prototype passenger cars with these characteristics are now as reliable as traditional combustion engine cars.
In electricity generation, stationary fuel cells are being used for decentralized power supply in off-grid areas. Currently, a main factor very important is the backup power applications, such as firstly emergency power supply or secondly uninterruptible supply. This type of FCs presents a higher electrical efficiency, up to 60%, when compared with conventional thermal power plants. Beyond efficiency, FCs in current operation are characterized for emission-free electricity production and a long autonomous operation and service life that require low maintenance costs. 35
In isolated regions of Portugal there are some applications that require the off-grid use of electricity, such as telecommunication antennas, pumping water systems and buildings far away from the national electric grid. So, in such places hydrogen could be produced through renewable or hydraulic systems, allowing the storage of energy in H2 for further transformation
24
2.3 Hydrogen in Portugal
The Sines Refinery, in southern Portugal, started operation in September of 1978 and is presently one of the largest in Europe. This plant has a distillation capacity of 10.9 million tons per year, which represent 220 thousand barrels per day. 36
The refinery essentially produces diesel (41.5%) and petrol (28.7%) and other components such as jet fuel, liquefied petroleum gas, fuel oil or naphtha (used in the petrochemical industry). Production is based on the refining of two types of crude, the sweet crude that has less than 1% of sulfur, and the sour crude that has the highest content in sulfur.
In 2007, Galp Energy, approved a project for improving the refinery system through the installation of a hydrocracking unit. The unit entered operation in January of 2013.37 The new
unity receives a less noble product, vacuum gas oil (VGO), from other portuguese refineries and also from importation, to convert into more valuable products such as diesel or jet petrol. For this operation it is necessary a hydrocracker, operating in presence of hydrogen and a catalyst, that “cracks” the heavy long-chain molecules of VGO into shorter molecules resulting in a clean-burning fuel. 38 The hydrogen necessary for this process comes from steam methane
reforming, of natural gas, and purified to 99.5% by a pressure swing adsorption unit. This unit also includes a sulfur recuperation unit to eliminate the toxic gases derived from the hydrocracking process. 39
The largest natural gas cogeneration plant in Sines produces steam and electric energy to feed the refinery and also to inject in the electric grid. This plant has operated since October 2009, producing 668 GWh/year of electricity and 1.8 Mton of steam. 37
However, as already stated above, the hydrogen used in the refinery is from a non-renewable source. There is a growing awareness for the need of producing renewable H2 and a number
of projects have been announced recently. A project released by the EDP Group intends to produce hydrogen in Ribatejo CCTG (combined cycle gas turbine) Plant with a non-pollution method. 40 The Ribatejo Thermoelectric Plant was the second largest combined cycle plant,
built during 2004, fed with natural gas and a capacity of approximately 1180 MW. 4142
This pilot project intends the production of hydrogen by an electrolyzer with a capacity of 1 MW and a capacity storage of 12 MW from 2022. This process will consume energy from the grid to produce hydrogen that will be burnt together with the natural gas to generate electricity. 40
25
Beyond this main project, EDP also intends to study the feasibility of production of hydrogen with offshore wind energy. 43
Portugal has recently adopted a National Hydrogen Strategy in 30 July of 2020. This National Strategy intends to advance the use of hydrogen as an integrated and sustainable pillar in the energy sector, promoting an energy transition strategy for a decarbonized economy. The measures and targets for the hydrogen incorporation promote and streamline the consumption and production in different economic sectors.44
This strategy should be understood as an aid for the NECP 2030 not defining a new objective for global decarbonization beyond those already defined. It will be guided by the objectives of incorporating renewables into GFEC and emission reductions. 44
The key projects and future initiatives include: 44
• Anchor project of industrial production of green hydrogen in Sines;
• Decarbonization of transport: promotes and support hydrogen and synthetic fuels as an addition to electricity and biofuels used to decarbonize this sector;
• Decarbonize the national industry: the decarbonization through the hydrogen in many subsectors, such as steel production;
• Use of waste water for hydrogen production;
• Development of a collaborative laboratory: development of R&D activities related to the hydrogen value chains and which allows the emergence of new industries, through the laboratory with national and international references.
Currently, Portugal is in negotiations with the Netherlands for creating a unit that will produce hydrogen just using renewable resources. 45
The project includes the construction of an electrolyzer factory in industrial scale, a solar power station, with 1GW capacity, and a factory for the production of photovoltaic solar panels and also a hydrogen plant. The construction should start in the beginning of 2021, but the hydrogen production is not expected to start until 2025. 46
26
This project will be located in Sines because of the deep-water port, for being one of the places with the lowest price of solar energy and for having a natural gas supply network, being this plant valued at 600 million euros. When in operation, it’s expected to produce up to 100 thousand tons of hydrogen per year, reducing the emissions at 18.6 million tons annually by the decarbonization of transports, heat production and industry. 47
It is expected that the implementation of this project will reduce energy imports and the energy dependence of the country, positioning Portugal as an exporter of green energy. For the export to Northern Europe hydrogen will be stored and transported in a gaseous state, for subsequent use in pharmaceutical, steel or fertilizer industries. 46
This is a project of an unprecedented scale in worldwide terms and with a deep impact in the industry and energy sectors of Portugal. The present study is therefore dedicated to understanding the combination of technologies and operating modes that could render such projects competitive in technical and economic terms. The details of that analysis are presented in the following chapters.
27
3.
Energy system modeling
3.1 Energy modeling tools
Energy planning and security of energy supply are two problems of paramount importance in a modern global economy. Since the energy crisis of the 1970s, energy planning has been in permanent evolution. It was therefore necessary to develop models for analyzing demand patterns, for quantifying pollutant gas emissions or for reducing the services costs. 4849 The
correct addressing of these problems allows development of informed investment strategies in supply and the timely satisfaction of demand. However, modern energy planning is a complex challenge that can only be adequately treated with the assistance of computerized technologies, both software and hardware. 50 These tools are also being adjusted because of
the emergence and strong growth in renewable energy. These adaptations culminated in multiple modeling systems with different characteristics that depend on the desired detail and the main objectives. 51
When modeling a H2 production plant with the characteristics of the object of this study, where
the electricity that powers the electrolyzer is produced by renewable energy sources, one has to take into account the intermittence of those sources. This effect means that major changes in electricity output can occur in very short periods of time, so it is important to use a modeling tool that can accommodate high temporal resolution, typically one hour. The level of intermittence has an impact in the instantaneous electrolyzer operation and energy exchanges with the national electricity grid. On the other hand, the modeling tool will have to allow estimating the contribution of these short time changes over a larger time scale, typically one year. This is generally the time scale for which many parameters are evaluated, such as annual H2 production, annual exchanges with the electricity grid or annualized investment costs.
It was decided to compare the characteristics of three different modeling tools that have been recently used to make prospective studies for the portuguese energy system: EnergyPLAN, MARKAL/TIMES and LEAP. This modeling systems have been used in different energy planning studies: MARKAL/TIMES provided the analytical tool for the development of the RNC2050, that studies different possible paths from the point of view of technical and economic feasibility, for achieving a carbon neutral economy by 2050. LEAP was used to prepare the PNEC2030 by developing a bottom-up model of the portuguese energy system.
28
LEAP was also used in combination with energyPLAN for the development of the National Hydrogen Strategy.
Table 3 presents and compares some relevant characteristics of these three modeling tools.
51
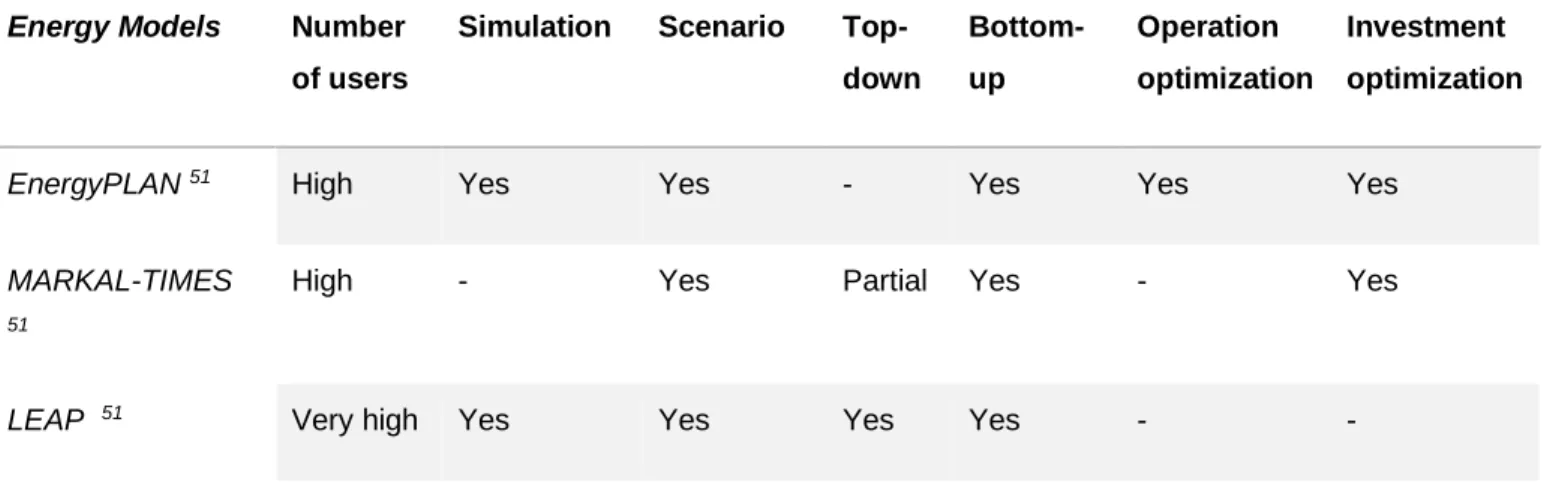
Table 3: Parameters of chosen energy modeling systems
Energy Models Number
of users
Simulation Scenario
Top-down Bottom-up Operation optimization Investment optimization
EnergyPLAN 51 High Yes Yes - Yes Yes Yes
MARKAL-TIMES
51
High - Yes Partial Yes - Yes
LEAP 51 Very high Yes Yes Yes Yes - -
The parameters chosen to compare the different modeling tools can be described as:
• Simulation: represents the operation of an energy system that delivers an amount of energy.
• Scenario: possible evolution of the energy system under a set of well-defined assumptions;
• Top-down: utilizes macroeconomic data for determination of growth in energy demand and prices;
• Bottom-up: identifies the energy technologies, the alternative and investments options for the determination of growth in energy demand and prices.
• Operation optimization: allows to optimize the technological configuration of an energy system;
• Investment optimization: allows the optimization of the investments in an energy system.
29
Through Table 3 it is possible to see that only LEAP and energyPLAN can be used as simulation tools which, as stated above, is a necessary characteristics for analyzing the operation of the H2 production plant in different time scales. They also allow operation and
investment optimization and are bottom-up type.
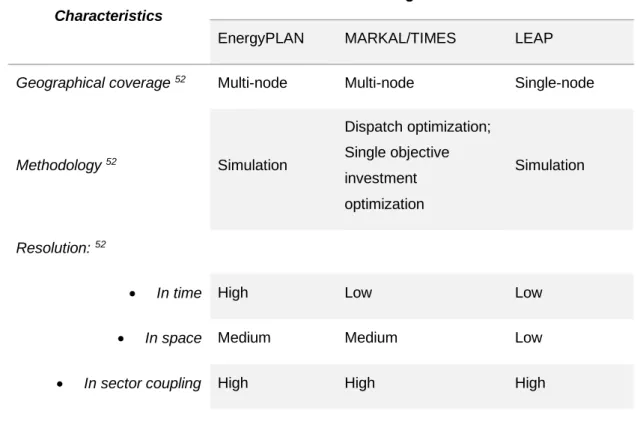
It is also possible to analyze if the different softwares includes the energy sectors through Table 4.
Table 4: Energy sectors included in the modeling systems
Software Energy Consuming Sectors Simulation of RE
penetration
Heat Electricity Transport 100% electricity
100% RE system
EnergyPLAN 51 Yes Yes Yes Yes Yes
MARKAL/TIMES 51 Yes Yes Yes - -
LEAP 51 Yes Yes Yes Yes Yes
In Table 4 one can highlight that LEAP and energyPLAN software are the only two capable of assuming energy systems with 100% of electricity and RE systems.