YIELD POTENTIAL AND GENETIC VARIABILITY OF SEMIEXOTIC MAIZE POPULATIONS AS A BASIS FOR SELECTION
Abstract – In order to verify the genetic and agronomic value, yield potential and inbreeding depression of synthesized composites, as well as quantifying the population variability and incorporating new sources of semiexotic germplasm in maize genetic improvement programs, four populations, identified as FA x HG-71 (P1), NAP-FL x HG-49 (P2), NAP-FB x HG-49 (P3), and NAP-DB x HG-49 (P4), with two levels of inbreeding (S0 and S1), were evaluated in three locations. From the P1 and P4 populations, 100 full-sib progenies were evaluated in only one location. Plant and ear height, lodging, breakage plants, ear length and diameter, resistance to diseases, ears with chalky kernels and grain yield were evaluated. The grain yield of the S0 and S1 populations varied between 5.50 and 6.65 t ha-1 and 3.8 and 4.58 t ha-1, respectively, with an average inbreeding depression between 23.9% and 38.0%. Considering all the locations, the grain yields of the non-inbreeding populations varied between 64.4% and 78.0% in relation to commercial hybrids (controls or checks), indicating a good yield potential for start of improvement program. In the P1 and P4 populations, sufficient genetic variability was identified in most of the traits, which accredits them for recurrent selection. Gains of 13.7% and 17.8% for grain yield and 31.64% and 29.9% for ears with chalky kernels were estimated.
Keywords: Population enhancement, genetic parameters, full siblings, Zea mays L.
POTENCIAL DE PRODUTIVIDADE E VARIABILIDADE GENÉTICA DE POPULAÇÕES SEMIEXÓTICAS DE MILHO COMO BASE PARA SELEÇÃO
Resumo - Com o intuito de verificar o valor genético-agronômico, o potencial produtivo e a depressão por endogamia de compostos sintetizados, quantificar a variabilidade das populações e incorporar novas fontes de germoplasma semiexótico em programas de melhoramento genético de milho, quatro populações, denominadas NAP-FA x HG-71 (P1), NAP-FL x HG-49 (P2), NAP-FB x HG-49 (P3) e NAP-DB x HG-49 (P4), com dois níveis de endogamia (S0 e S1), foram avaliadas em três locais. Das populações P1 e P4 foram avaliadas 100 progênies de irmãos germanos em apenas um local. Foram avaliados altura de plantas e espigas, acamamento, quebramento, comprimento e diâmetro da espiga, resistência a doenças, espigas gessadas e rendimento de grãos. O rendimento de grãos das populações S0 e S1 variaram entre 5,50 e 6,65 t ha-1 e 3,8 e 4,58 t ha-1,
respectivamente, com depressão média por endogamia entre 23,9% e 38,0%. No conjunto dos locais, os rendimentos de grãos das populações não endogâmicas variaram entre 64,4% e 78,0% das testemunhas comerciais, indicando bom potencial produtivo para início de programa de melhoramento. Nas populações P1 e P4, verificou-se variabilidade genética suficiente na maioria dos caracteres, credenciando as mesmas para seleção recorrente. Ganhos de 13,7% e 17,8% para rendimento de grãos e 31,64% e 29,9% para espigas gessadas foram previstos.
Palavras-chave: Melhoramento de populações, parâmetros genéticos, irmãos germanos, Zea mays L.
ISSN 1980 - 6477
Journal homepage: www.abms.org.br/site/paginas
Udenys Cabral Mendes(1)( ), João Antonio da Costa Andrade(2) and José Branco de Miranda Filho(3)
(1) Semeali Sementes Híbridas LTDA E-mail: [email protected]
(2) UNESP - Campus de Ilha Solteira
(3) Departamento de Genética ESALQ/USP
How to cite
MENDES, U. C.; ANDRADE, J. A. C.; MIRANDA FILHO, J. B. Yield potential and genetic variability of semiexotic maize populations as a basis for selection. Revista Brasileira de Milho e Sorgo, v. 19, e1187, 2020.
Brazilian Journal of Maize and Sorghum
Maize (Zea mays L.) is a plant species characterized by a wide genetic variability, which is demonstrated by its adaptation to great variations of latitude, altitude, temperature, abiotic and biotic stresses, and even to small variations in the same environment (Hallauer et al., 2010). Despite that variability, very little of the available germplasm is effectively used in genetic improvement for cultivar development.
Taking into consideration all the germplasm found worldwide, most of the commercial hybrids originate from six large racial groups: 1. Corn Belt dents; 2. Northern flints; 3. South American flints (Cateto); 4. Mexican dents; 5. Caribbean flints (Cristalino); and 6. Tusons. The seed companies’ global strategies for maize improvement programs worldwide may increase the exotic germplasm exchange (Goodman, 2005). In this context, it can also be pointed out that the exchange of elite lines or tropical varieties among the Institutions is the most efficient way to broaden the genetic variability, although being restricted in practical terms (Paterniani et al., 2019).
In Brazil, the maize germplasm is also characterized by a wide variability, including races, local varieties and exotic or semiexotic germplasm from other countries. Brieger et al. (1958) described 52 races of maize in Brazil and neighbouring countries. This material, represented by approximately 3,800 accessions, became the basis of the Brazilian Maize Germplasm Bank, maintained by Embrapa Genetic Resources and Biotechnology. Despite
that, the researchers recognize that the percentage of germplasm actually used for improvement is very low, perhaps less than 5% (Goodman, 2005). The interest in new germplasm sources has arisen due to specific problems, such as the resistance to diseases (Miranda Filho et al., 2000; Miranda Filho & Reis, 2016).
In this scenario, the identification and exploration of new sources of variability are critical for the obtention of new accessions that present desirable allelic forms for traits like grain yield, resistance to diseases, tolerance to water stress, among others. Among the sources of variability, the landrace varieties stand out. Also known as local or traditional varieties, they consist of populations cultivated by rural communities, indigenous people and small-scale family farmers (Silveira et al., 2015).
The use of germplasm with broad genetic base is a primary criterion to ensure positive prospects for gain with selection (Carena, 2013a). The study and the use of semiexotic populations have demonstrated the relevance of this practice in improvement programs. Mendes et al. (2015) identified good prospects in the incorporation of semiexotic germplasm into adapted local populations, which resulted in the enhancement of the basic germplasm for the conditions of the southwestern region of Goiás state. In addition, when trying to find solutions for specific problems, among which the stunt disease complex, Oliveira et al. (2015a, 2015b) reported the performance of three semiexotic populations with potential. They verified that the strategies used were appropriate
to broaden the prospects regarding the use of these populations in improvement programs. The possibility that populations derived from exotic germplasm present greater stability for different environments and abiotic stresses were also emphasized by Carena (2013b).
The basic properties of a population are expressed in terms of allele frequencies and genotype frequencies. In order to estimate the genetic properties of a population, the phenotypic value must be decomposed into its constituent parts, which are attributed to the different causal factors. The use of variances in the study of quantitative traits enables the obtention of genetic parameter estimates, with identification of the nature of the gene actions involved in the control of quantitative traits, as well as the evalution of the efficiency of different selection strategies used to obtain genetic gains and maintain a genetic base. Among the most relevant parameters, the following stand out: additive and non-additive genetic variances, heritability and genetic correlations between characters (Cruz et al., 2014).
Therefore, through the execution of this work, it was possible to evaluate semiexotic populations, newly synthesized, which incorporate new sources of germplasm to be used in maize genetic improvement programs. That selection, previously devised by NAP-Maize (Maize Research Support Center), is of particular interest because it represents the result of specific selection for leaf diseases, described by Miranda Filho et al. (2000). Additionally, this germplasm,
which includes accessions from Brazil and other countries, may be considered exotic, in the sense that it does not belong to the genetic base commonly used in enhancement, and thus being capable of contributing with new alleles (even rare alleles) and promoting the increase of genetic variability that is useful to enhancement.
In this work, the objective was to verify the yield potential and the depressive effect of inbreeding in four newly synthesized populations, in addition to quantifying the genetic variability expression in two of those semiexotic populations.
Material and Methods
The composition of the four populations assessed in this work was described by Miranda Filho et al. (2000). The evaluation was carried out in 1,263 accessions from the Germplasm Bank for purposes of selection as to resistance to five leaf diseases, namely: NAP-PP (resistance to Puccinia polysora); NAP-PZ (resistance to Physopella zeae); NAP- ET (resistance to
Exserohilum turcicum); NAP- PM (resistance
to Phaeosphaeria maydis); and NAP-CE (resistance to the stunt disease complex). In the recombination lots, after harvesting of selected plants, the ears of the remaining plants in each lot were mass harvested. Subsequently, there was a visual selection of individual ears considered to be of higher standard as to grain health, which were identified in four grain types. In each type, the samples varied from 50 to 80 ears, which were
sowed for recombination. After the ear selection in the first cycle, the respective recombination lots were harvested concurrently and, as from that heterogeneous sample, individual ears were selected based on the ear type, grain health, texture and color. The selected ears formed the four populations, with the following denominations: 1 - NAP-FA (yellow flint); 2 - NAP-FL (orange flint); 3 - NAP-FB (white flint); and 4 - NAP-DB (white dent).
The four NAP populations were crossed with six populations symbolized by HG, which are represented by the F2 generation of commercial hybrids harvested in the region of Jataí-GO. The HG populations derive from yellow endosperm and the results obtained from those crosses were used to select the most suitable HG population as the basis for the incorporation of each NAP population. The populations selected based on grain yield, plant and ear height, and leaf diseases were: NAP-FA x 71 (P1), NAP-FL x HG-49 (P2), NAP-FB x HG-HG-49 (P3), and NAP-DB x HG-49 (P4), which were recombined in isolated lots for homogenization and compose the four populations of this work.
In August 2014, three lots of each of the four populations were sowed for multiplication and production of progenies. Within the first lot, 100 plants were intercrossed (sib) and sampling was performed with equal number of ear kernels, forming the non-inbred generation (S0) of each population. In the second lot, 200 plants were self-fertilized, from which a sample with equal number of ear kernels composed the inbred
generation (S1) of each population. The third lot was used to obtain 100 progenies of full-siblings of each population.
In the first part of the work, the four populations were used, with two levels of inbreeding (S0 and S1). They were evaluated in Araçatuba -SP (sowing in March 2015), Jataí-GO (sowing in February 2015), and Chapadão do Sul-MS (sowing in February 2015). The experiments, involving four populations S0, four generations S1 and three commercial hybrids (60XB14, XB 8018 and 30A37PW), were conducted in randomized blocks with three replications, and plots with six rows of 4.0 m, with 0.90 m inter-row spacing and 0.20 m inter-plant spacing, in Jataí-GO and Araçatuba-SP. In Chapadão do Sul-MS, the plots had six rows of 5.0 m, with 0.45 m inter-row spacing and 0.38 m inter-plant spacing. In all locations, the four central rows of each plot were considered in order to avoid the effect of competition caused by inbreeding difference.
The populations NAP-FA x HG-71 (P1) and NAP-DB x HG-49 (P4) were chosen for intra-population variability study aiming at a better characterization for use in improvement program. Then the 100 full-sib progenies obtained in 2014 were evaluated in two experiments (50 progenies each) in Chapadão do Sul-MS. Sowing was done in February 2015, in randomized blocks with three replications, with a commercial control (60XB14 single-cross hybrid) being interspersed every ten plots, in all replications. Two other controls (XB 8018 double-cross hybrid and 30A37 PW single-cross hybrid) were used as
common treatments in the experiment. The plots were formed by one row of 5 m, with 0.45 m
inter-row spacing and 0.38 m inter-plant spacing, with
each plot totaling approximately 13 plants after thinning, which corresponds to the population density of 58,479 plants ha-1.
The following quantitative characters were evaluated in the experiments with full-sib progenies and populations: PH – plant height (cm), measured from the soil surface up to the flag leaf, and EH – ear height (cm), measured from the soil surface up to the main ear insertion, with an average of 12 and 5 plants per plot in the experiments with populations and full-sib progenies, respectively; EL and ED – ear length and ear diameter (cm), obtained as the average measure of five ears per plot; LD% – lodging, percentage of plants inclined with the stem forming an angle higher than 20o
with the vertical in the plot; BR% – breakage, percentage of plants in the plot with stem broken below the ear; and GY – total grain mass in the plot (kg.plot-1) transformed into g plant-1 for the
estimation of variance components. The relative position of ears (EH/PH) was evaluated only in the experiments with populations. In the experiments with full-sib progenies, severity evaluations were performed for Exserohilum turcicum (ET),
Phaeosphaeria maydis (PM), and Cercospora zea maydis (CZ), with the application of a rating
scale developed for assessment of maize leaf diseases, adapted from Ullstrup (s.d.), where: 1 ≡ no damages; 2 ≡ scattered damages in the plants; 3 ≡ up to 50% of the plants with severe damages in 25% of the lower leaves; 4 ≡ up to 75% of the
plants with severe damages in 50% of the lower leaves; 5 ≡ up to 100% of the plants with severe damages in 75% of the lower leaves; and 6 ≡ dead plants in the plot. In these experiments, the
percentage of ears with chalky kernels (EC%) was also evaluated.
GY data were corrected to 13% moisture and ideal stand through the covariance method suggested by Miranda Filho (Vencovsky & Barriga, 1992), which applies the regression coefficient (b) of the observed GY value on the stand variance: Yc*=Yc + b(Si – S), where Yc* is the GY corrected to ideal stand Si; Yc is the GY value previously corrected to moisture; and S is the stand observed in the plot.
In the experiments with progenies, considering an environmental gradient that affects each progeny differently, GY data were also corrected for grouping the experiments based on the interspersed control, using the formula Yδ = Yc* - (Yτ - ), where Yδ represents the grain yield per plot of the progeny in the δ position of the block; Yτ is the grain yield of the interspersed witness in the δ position; and is the general mean of the control in each block.
With the means of S0 populations (m0) and S1 generations (m1), represented by m0 = µ + a + d = A + d, and m1 = µ + a + ½d = A + ½d, respectively, it was possible to estimate the components A = 2m1 – m0 and d = 2(m0 – m1), where A is the expected mean of a random sample of fully homozygous lines extracted from the population; and d is the total contribution of the heterozygotes for the population mean.
𝑌𝑌¯𝜏𝜏
The inbreeding depression was estimated by I =
m1 – m0 for 50% of the expected homozygosity (Oliveira et al., 2015).
The genetic variance between full-sib progenies (non-inbred) is expressed by the equation where and
are the additive and dominance variances, respectively, defined for the base population. Consequently, the components and cannot be estimated separately. However, such estimates were obtained by assuming hypotheses about the relative values of components. The traits PH, EH, EL and ED usually present low average degree of dominance, with / 2A ratios not being
over 0.5 in most cases (Hallauer et al., 2010). In such cases, hypothetical limits for estimation of genetic variance components were considered with the assumptions that 2D = 0 (H1) and
= (H2). On the other hand, the grain yield trait expresses higher degree of dominance in most cases, with < 2D /2A < 1 (Hallauer
et al., 2010), assuming the hypotheses that 2 D
= 12 𝜎𝜎𝐴𝐴2 (H3) and D2 = 2A (H4), according to the approximations used by Rodrigues (2013). The formulas for estimation of the parameters of interest are shown in Table 1.
Results and Discussion
Through the joint analysis of the experiments with populations (Table 2), significant differences were identified between non-inbred generations (S0) for PH, EH, EH/ PH, EL, ED and GY. The inbreeding led to a
standardization of the populations, with the S1 generations being different only as to EH. The commercial hybrids (controls) showed no difference only as to LD. Significant S0 x local interaction was only observed for EL, while no significant interaction was observed between inbred and local generations (S1 x local). However, the control x local interaction was significant for EL, ED, LD, BR and GY. Thus, only the commercial hybrids were influenced in a different way, in the assessment locations, in comparison with the heterogeneous materials (S0 and S1 populations). The genotype x environment interaction is demonstrated by the sensitivity of each genotype to the environmental conditions found in each location (Vencovsky & Barriga, 1992). That sensitivity varied more between the hybrids than between the populations.
In the experiments with populations, the joint means for GY ranged from 5.50 to 6.65 t ha-1 and from 3.8 to 4.58 t ha-1 for S
0 and S1,
respectively (Table 3). The GY of non-inbred populations in relation to controls varied from 73% to 84% in Araçatuba-SP, 49.2% to 72% in Jataí-GO, 63.7% to 76.6% in Chapadão do Sul-MS, and 64.4% to 78.0% in the joint mean. Such results can be considered good, since they are semiexotic populations, poorly adapted, which were not submitted to an intense selection process. Miranda Filho and Reis (2016) evaluated 26 populations with variable quantity of exotic germplasm and found five materials with grain yield of 79.5%, 74.4%, 76.3%, 72.7% and 71.3% in relation to the mean of the
2 p = 21 2 A +41 2 D , 2A 2 D 2 A 2 D 2 D 1 2 𝜎𝜎𝐴𝐴2 1 2 2 D
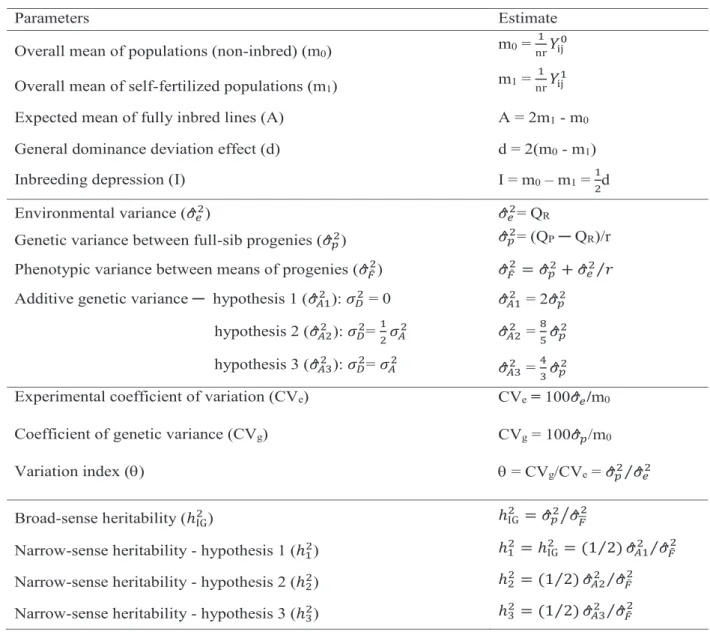
Parameters Estimate Overall mean of populations (non-inbred) (m0) m0 =
1
nr𝑌𝑌ij0
Overall mean of self-fertilized populations (m1) m1 = 1
nr𝑌𝑌ij1
Expected mean of fully inbred lines (A) A = 2m1 - m0 General dominance deviation effect (d) d = 2(m0 - m1)
Inbreeding depression (I) I = m0 – m1 = 12d
Environmental variance (𝜎𝜎^𝑒𝑒2) 𝜎𝜎^𝑒𝑒2= QR
Genetic variance between full-sib progenies (𝜎𝜎^𝑝𝑝2) 𝜎𝜎^𝑝𝑝2= (QP ─ QR)/r Phenotypic variance between means of progenies (𝜎𝜎^𝐹𝐹¯2) 𝜎𝜎^
𝐹𝐹¯2= 𝜎𝜎^𝑝𝑝2+ 𝜎𝜎^𝑒𝑒2⁄ 𝑟𝑟 Additive genetic variance ─ hypothesis 1 (𝜎𝜎^𝐴𝐴12 ): 𝜎𝜎𝐷𝐷2 = 0 𝜎𝜎^𝐴𝐴12 = 2𝜎𝜎^𝑝𝑝2
hypothesis 2 (𝜎𝜎^𝐴𝐴22 ): 𝜎𝜎𝐷𝐷2= 12𝜎𝜎𝐴𝐴2 𝜎𝜎^𝐴𝐴22 = 85𝜎𝜎^𝑝𝑝2 hypothesis 3 (𝜎𝜎^𝐴𝐴32 ): 𝜎𝜎𝐷𝐷2= 𝜎𝜎𝐴𝐴2 𝜎𝜎^𝐴𝐴32 = 43𝜎𝜎^𝑝𝑝2 Experimental coefficient of variation (CVe) CVe = 100𝜎𝜎^𝑒𝑒/m0 Coefficient of genetic variance (CVg) CVg = 100𝜎𝜎^𝑝𝑝/m0
Variation index () = CVg/CVe = 𝜎𝜎^𝑝𝑝2⁄ 𝜎𝜎^𝑒𝑒2
Broad-sense heritability (ℎIG2) ℎIG2 = 𝜎𝜎^𝑝𝑝2⁄ 𝜎𝜎^𝐹𝐹2
Narrow-sense heritability - hypothesis 1 (ℎ12) ℎ12 = ℎ2IG= (1 2⁄ ) 𝜎𝜎^𝐴𝐴12 ⁄ 𝜎𝜎^𝐹𝐹¯2 Narrow-sense heritability - hypothesis 2 (ℎ22) ℎ22 = (1 2⁄ ) 𝜎𝜎^𝐴𝐴22 ⁄ 𝜎𝜎^𝐹𝐹¯2 Narrow-sense heritability - hypothesis 3 (ℎ32) ℎ32 = (1 2⁄ ) 𝜎𝜎^𝐴𝐴32 ⁄ 𝜎𝜎^𝐹𝐹¯2
Table 1. Formulas used for estimation of genetic parameters of interest in the study of the NAP-FA
x HG-71 and NAP-DB x HG-49 maize populations.
n = number of progenies; r = number of replications; Yij0 = observation of progeny i in replication j of non-inbred generation;
Yij1 = observation of progeny i in replication j of inbred generation; QR = Mean square of residue from analysis of variance;
controls in Anhembi-SP. Souza et al. (2018) found higher values (93.8%, 89.4% and 94.6%) for the semiexotic populations 01, CRE-02 and CRE-03. Populations with performance lower than 50% in relation to controls have very limited potential to be used in improvement programs. The overall means of PH and EH of the four populations were 2.03 and 1.08 m for the S0 generation and 1.83 and 0.96 m for the S1, also within normal height standards, when compared to the controls (2.2 and 1.2 m).
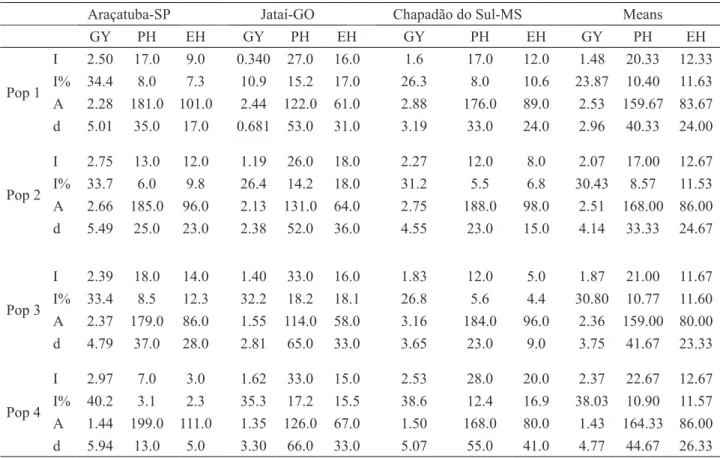
The inbreeding depression for GY of the four populations was 34.4%, 33.7%, 33.4%, 40.2% in Araçatuba; 10.9%, 26.4%, 32.2%, 35.3% in Jataí;
and 26.3%, 31.2%, 26.8%, 38.6% in Chapadão do Sul. For PH values varied from 3.1% to 8.5%, 14.2% to 18.2%, and 5.5% to 12.4%, while for EH values ranged from 2.3% to 12.3%, 15.5% to 18.1%, and 4.4% to 16.9% in Araçatuba, Jataí and Chapadão do Sul, respectively (Table 4). Those values were expected, due to the complexity of the traits and the diversity of the populations’ origin. They originated from commercial hybrids that are genetically divergent, even though having passed through a high selection pressure for adaptation to the cerrado conditions, with reduction of its genetic load. Kist (2006), when studying a population called MPA (Small Farmers
Table 2. Mean squares from joint analysis of variance for plant height (PH cm), ear height (EH cm),
ear length (EL cm), ear diameter (ED cm), lodging percentage (LD), breakage percentage (BR), and grain yield (GY t ha-1), involving four maize populations and three commercial controls in
Araçatuba-SP, Jataí-GO and Chapadão do Sul-MS, 2015.
Source of variation DF PH EH EH/PH EL ED LD BR GY
Blocks/Local 6 0.0095* 0.0023 0.0002 0.2592 0.1499* 2.2396** 0.6984 426,907.9 Non-inbred populations (S0) 3 0.0160* 0.0124* 0.0020** 3.0492** 0.1993* 1.0269 0.6493 2,020,799.4** Inbred populations (S1) 3 0.0108 0.0097* 0.0011 0.9773 0.0359 1.1410 1.7430 1,003,348.3 Controls (C) 2 0.4411** 0.2645** 0.0059** 14.1115** 0.4133** 0.3837 4.5170** 5,912,946.3** Groups 2 0.9651** 0.4786** 0.0068** 53.8237** 4.1298** 12.3953** 7.5670** 147,590,652.9** Local 2 1.3264** 0.5338** 0.0051** 1.0962 3.1572** 146.7574** 39.7928** 77,131,543.5** Local x S0 6 0.0086 0.0033 0.0003 2.0453* 0.0781 0.6292 1.2984 381,236.5 Local x S1 6 0.0036 0.0035 0.0004 1.1156 0.0481 0.1966 0.5799 164,095.8 Local x C 4 0.0033 0.0081 0.0008 3.8476** 0.1411 2.7070** 3.9348** 5,468,775.1** Local x Groups 4 0.0290** 0.0063 0.0001 1.8184* 0.1115 3.2000** 5.9682** 2,767,718.7** Mean error 60 0.0041 0.0035 0.0004 0.7139 0.0575 0.6189 0.6772 418,466.9 CV% ... 3.19 5.49 3.82 5.24 5.02 25.54 29.76 10.67 Means ... 2.00 1.07 0.53 16.12 4.77 3.08 2.76 6,059.87
Movement), that was originated from a composite with more than 30 populations, considered that such genetic breadth may probably generate high frequency of recessive deleterious alleles hidden by heterozygosity. The highly heterozygous condition of the hybrids that originated the populations also contributed to that, although with less intensity,
since the parental lines went through rigorous selection. The variation and magnitude of the inbreeding depression values for plant height traits are much lower than those found in relation to grain yield, which is explained by the lower genetic complexity and the predominance of additive genetic effects (Hallauer et al.,
Table 3. Means of the four populations (non-inbred and inbred) and the commercial hybrids (controls)
evaluated in Araçatuba-SP (L1), Jataí-GO (L2), and Chapadão do Sul-MS (L3) for plant height (PH cm), ear height (EH cm), relative position of the ear (EH/PH), ear length (EL cm), ear diameter (ED cm), lodging percentage (LD), breakage percentage (BR), and grain yield (GY t ha-1). Separate means by location and joint means for GY, and only joint means for the other traits.
Population PH EH EH/PH EL ED LD BR GYv Joint L1 L2 L3 Joint Non-inbred populations (S0) P1 200.3 107.7 0.53 15.8 4.8 3.3 2.8 7.29 (75.0) 3.12 (49.2) 6.08 (63.7) 5.50 (64.4) P2 201.7 110.7 0.55 15.5 4.6 3.6 3.1 8.15 (84.0) 4.50 (70.8) 7.30 (76.6) 6.65 (78.0) P3 200.9 103.1 0.51 16.2 4.6 3.4 2.8 7.16 (73.7) 4.36 (68.6) 6.81 (71.4) 6.11 (71.6) P4 209.3 111.2 0.53 16.9 4.9 2.8 2.5 7.38 (76.0) 4.57 (72.0) 6.56 (68.8) 6.17 (72.3) Mean 203.1 108.2 0.53 16.1 4.7 3.3 2.8 7.50 4.14 6.69 6.11 Inbred populations (S1) P1 180.1 95.6 0.53 15.1 4.5 3.4 2.9 4.78 2.78 4.48 4.02 P2 184.9 98.2 0.53 15.1 4.4 3.9 3.8 5.41 3.31 5.03 4.58 P3 180.0 91.4 0.51 14.6 4.5 3.6 2.8 4.77 2.96 4.99 4.24 P4 186.9 98.6 0.53 15.4 4.6 3.0 3.2 4.41 2.96 4.03 3.80 Mean 183.0 95.9 0.52 15.0 4.5 3.5 3.2 4.84 3.00 4.63 4.16 Controls C1 230.0 127.9 0.55 18.9 5.4 2.0 1.5 9.72 8.66 9.95 9.44 C2 231.1 133.2 0.58 17.7 5.3 2.4 2.0 9.49 6.36 8.96 8.27 C3 192.2 101.2 0.53 16.4 5.0 2.4 2.9 9.93 4.05 9.68 7.88 Mean 217.7 120.8 0.55 17.6 5.2 2.2 2.1 9.71 6.35 9.53 8.53
Populations: P1 - NAP-FA x HG-71; P2 - NAP-FL x HG-49; P3 - NAP-FB x HG-49; P4 - NAP-DB x HG-49; C1 - 60XB14; C2 -
2010). It can be noted that the contribution of
homozygous loci (additive effects) is greater than the contribution of heterozygous loci (dominance deviations), while in the traits related to grain yield, the contribution of heterozygous loci is more substantial, presenting more significant inbreeding depression estimates (Somera et al.,
2018).
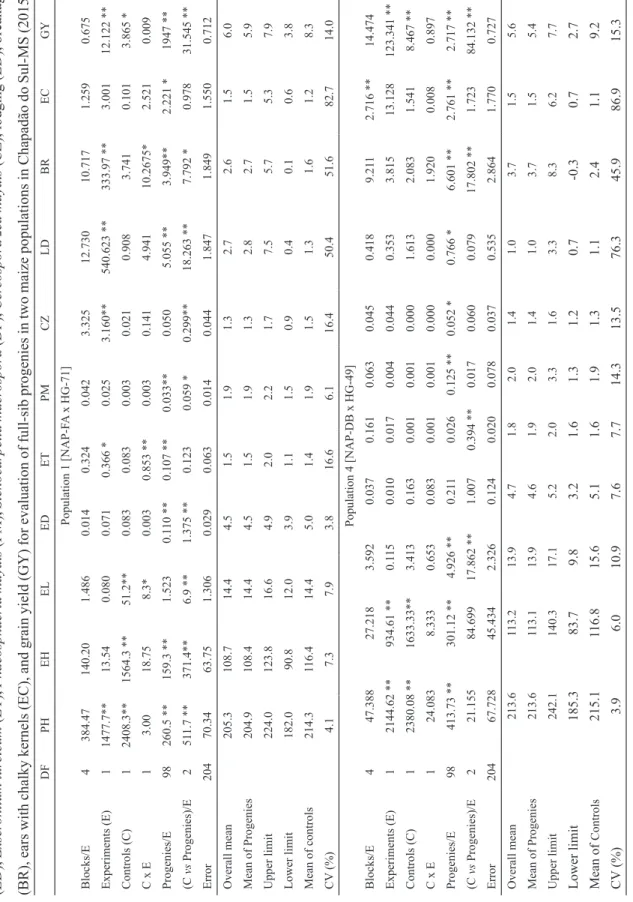
In the intra-population variability study, no significant differences were found between progenies from Pop 1 only for the traits EL and
CZ (Table 5). In Pop 4, the differences between progenies were not significant only for ED and ET. Such results are the first evidence of the existence of genetic variability in the two populations for the traits PH, EH, ET, LD, BR, EC and GY. The contrast between progenies and controls was not significant for ET and EC in Pop 1, and for PH, EH, ED, PM, CZ, LD, EC in Pop 4. Since EC mostly reflects the damages caused by the stunt disease complex, both populations presented the same damage levels as the controls.
Table 4. Estimates of inbreeding depression (I), percentage of inbreeding depression (I%), contribution
of homozygotes (A) and heterozygotes (d) for the mean observed for four populations in three locations for grain yield (GY t ha-1), plant height (PH cm), and ear height (EH cm).
Araçatuba-SP Jataí-GO Chapadão do Sul-MS Means
GY PH EH GY PH EH GY PH EH GY PH EH Pop 1 I 2.50 17.0 9.0 0.340 27.0 16.0 1.6 17.0 12.0 1.48 20.33 12.33 I% 34.4 8.0 7.3 10.9 15.2 17.0 26.3 8.0 10.6 23.87 10.40 11.63 A 2.28 181.0 101.0 2.44 122.0 61.0 2.88 176.0 89.0 2.53 159.67 83.67 d 5.01 35.0 17.0 0.681 53.0 31.0 3.19 33.0 24.0 2.96 40.33 24.00 Pop 2 I 2.75 13.0 12.0 1.19 26.0 18.0 2.27 12.0 8.0 2.07 17.00 12.67 I% 33.7 6.0 9.8 26.4 14.2 18.0 31.2 5.5 6.8 30.43 8.57 11.53 A 2.66 185.0 96.0 2.13 131.0 64.0 2.75 188.0 98.0 2.51 168.00 86.00 d 5.49 25.0 23.0 2.38 52.0 36.0 4.55 23.0 15.0 4.14 33.33 24.67 Pop 3 I 2.39 18.0 14.0 1.40 33.0 16.0 1.83 12.0 5.0 1.87 21.00 11.67 I% 33.4 8.5 12.3 32.2 18.2 18.1 26.8 5.6 4.4 30.80 10.77 11.60 A 2.37 179.0 86.0 1.55 114.0 58.0 3.16 184.0 96.0 2.36 159.00 80.00 d 4.79 37.0 28.0 2.81 65.0 33.0 3.65 23.0 9.0 3.75 41.67 23.33 Pop 4 I 2.97 7.0 3.0 1.62 33.0 15.0 2.53 28.0 20.0 2.37 22.67 12.67 I% 40.2 3.1 2.3 35.3 17.2 15.5 38.6 12.4 16.9 38.03 10.90 11.57 A 1.44 199.0 111.0 1.35 126.0 67.0 1.50 168.0 80.0 1.43 164.33 86.00 d 5.94 13.0 5.0 3.30 66.0 33.0 5.07 55.0 41.0 4.77 44.67 26.33
Pop 4 is similar to the controls in respect to plant and ear height and both populations present lower GY in relation to the controls.
The means of the full-sib progenies for PH in the two populations were 204.9 cm and 213.6 cm (Table 5), which correspond to 95.6% and 99.3% of the controls’s means. The means for EH were 108.4 cm and 113.1 cm, which correspond to 93.1% and 96.8% of the controls’ means. The lower height of the populations is attributed to the incorporation and contribution of HG populations since they are derived from single-cross hybrids that present lower height than NAP populations (Mendes et al., 2015). Oliveira et al. (2015), when studying semiexotic populations, found higher mean values for PH and EH. Those variations are common because different genotypes participate in the introgression in each case.
The EL was 14.4 cm and 13.9 cm in the two populations, close to the controls’ means. The means of progenies for ED were similar in both populations (4.5 and 4.6 cm), which are considered satisfactory values, corresponding to 90.0% of the means of commercial hybrids. Mean values of EL ranging from 15.0 to 17.5 cm and ED from 4.2 to 4.8 cm were presented by Andrade and Miranda Filho (2008) in the ESALQ PB1 population (non-exotic).
In regard to leaf diseases, the climate conditions caused the development of pathogens with low to moderate severity. It also must be taken into consideration that the experiment was implemented among commercial crops, where fungicides were applied, thus reducing
the inoculum potential and, consequently, the incidence of diseases. The average ratings of progenies varied from 1.5 to 1.9; 1.9 to 2.0; 1.3 to 1.4 for ET, PM and CZ in Pop 1 and Pop 4, respectively (Table 5). Oliveira et al. (2015), when assessing leaf diseases in three semiexotic populations, verified intermediate degree of resistance, though some families presented mean values of 2.5, being considered resistant. They highlighted that it was possible to observe genetic variability in the three populations, considering that trait, and estimate gains with selection of more resistant families.
The percentage of lodging ranged from 1.0% to 2.8% and breakage from 2.7% to 3.7% (Table 5). Lodging and breakage are complex phenomena and their expression depends on genetic factors interrelated with other factors: climate, soil, agricultural practices adopted, and damages caused by pests and diseases. The losses resulting from lodging and breakage vary a lot, causing severe damages to grain yield and quality, and thus calling the attention of agronomists and plant breeders throughout the world (Moraes & Brito, 2008).
The EC trait was evaluated with the purpose to verify the severity of stunt complex. Incidence of these diseases was observed, though in small proportion, with mean values of 1.5% EC in the two populations. Those results can be associated with the tolerance of the populations or the low incidence of pathogens, specifically in this experiment. Oliveira et al. (2015) reported the performance of three semiexotic populations
Table 5. Mean squares from joint analysis of variance, means, upper and lower limits for plant height (PH), ear height (EH), ear length (EL), ear diameter (ED), Exser ohilum tur cicum (ET), Phaeosphaeria maydis (PM), Stenocarpella macr ospora (DP), Cer
cospora zea maydis
(CZ), lodging (LD), breakage (BR), ears with chalky kernels (EC), and grain yield (GY) for evaluation of full-sib progenies in two maize populations in Chapadão do Sul-MS (2015). DF PH EH EL ED ET PM CZ LD BR EC GY Population 1 [NAP-F A x HG-71] Blocks/E 4 384.47 140.20 1.486 0.014 0.324 0.042 3.325 12.730 10.717 1.259 0.675 Experiments (E) 1 1477.7** 13.54 0.080 0.071 0.366 * 0.025 3.160** 540.623 ** 333.97 ** 3.001 12.122 ** Controls (C) 1 2408.3** 1564.3 ** 51.2** 0.083 0.083 0.003 0.021 0.908 3.741 0.101 3.865 * C x E 1 3.00 18.75 8.3* 0.003 0.853 ** 0.003 0.141 4.941 10.2675* 2.521 0.009 Progenies/E 98 260.5 ** 159.3 ** 1.523 0.1 10 ** 0.107 ** 0.033** 0.050 5.055 ** 3.949** 2.221 * 1947 ** (C vs Progenies)/E 2 51 1.7 ** 371.4** 6.9 ** 1.375 ** 0.123 0.059 * 0.299** 18.263 ** 7.792 * 0.978 31.545 ** Error 204 70.34 63.75 1.306 0.029 0.063 0.014 0.044 1.847 1.849 1.550 0.712 Overall mean 205.3 108.7 14.4 4.5 1.5 1.9 1.3 2.7 2.6 1.5 6.0 Mean of Progenies 204.9 108.4 14.4 4.5 1.5 1.9 1.3 2.8 2.7 1.5 5.9 Upper limit 224.0 123.8 16.6 4.9 2.0 2.2 1.7 7.5 5.7 5.3 7.9 Lower limit 182.0 90.8 12.0 3.9 1.1 1.5 0.9 0.4 0.1 0.6 3.8 Mean of controls 214.3 116.4 14.4 5.0 1.4 1.9 1.5 1.3 1.6 1.2 8.3 CV (%) 4.1 7.3 7.9 3.8 16.6 6.1 16.4 50.4 51.6 82.7 14.0 Population 4 [NAP-DB x HG-49] Blocks/E 4 47.388 27.218 3.592 0.037 0.161 0.063 0.045 0.418 9.21 1 2.716 ** 14.474 Experiments (E) 1 2144.62 ** 934.61 ** 0.1 15 0.010 0.017 0.004 0.044 0.353 3.815 13.128 123.341 ** Controls (C) 1 2380.08 ** 1633.33** 3.413 0.163 0.001 0.001 0.000 1.613 2.083 1.541 8.467 ** C x E 1 24.083 8.333 0.653 0.083 0.001 0.001 0.000 0.000 1.920 0.008 0.897 Progenies/E 98 413.73 ** 301.12 ** 4.926 ** 0.21 1 0.026 0.125 ** 0.052 * 0.766 * 6.601 ** 2.761 ** 2.717 ** (C vs Progenies)/E 2 21.155 84.699 17.862 ** 1.007 0.394 ** 0.017 0.060 0.079 17.802 ** 1.723 84.132 ** Error 204 67.728 45.434 2.326 0.124 0.020 0.078 0.037 0.535 2.864 1.770 0.727 Overall mean 213.6 113.2 13.9 4.7 1.8 2.0 1.4 1.0 3.7 1.5 5.6 Mean of Progenies 213.6 113.1 13.9 4.6 1.9 2.0 1.4 1.0 3.7 1.5 5.4 Upper limit 242.1 140.3 17.1 5.2 2.0 3.3 1.6 3.3 8.3 6.2 7.7 Lower limit 185.3 83.7 9.8 3.2 1.6 1.3 1.2 0.7 -0.3 0.7 2.7 Mean of Controls 215.1 116.8 15.6 5.1 1.6 1.9 1.3 1.1 2.4 1.1 9.2 CV (%) 3.9 6.0 10.9 7.6 7.7 14.3 13.5 76.3 45.9 86.9 15.3 DF: Degr ee of freedom; **, *: Significa nt at 1% and 5% pr obability by F-test, respectively . Mean squar es in cm 2 for PH, EH, EL
and ED; rating
2 for ET , PM and CZ; (%) 2 for LD, BR and EC; (t ha -1) 2 for GY
. Means in cm for PH, EH, EL
and ED; rating for ET
, PM and CZ; % for LD, BR and EC; t ha
-1 for GY
derived from exotic germplasm with resistance potential to stunt diseases and identified progenies with high resistance level.
For GY, values ranged from 3.8 to 7.9 t ha-1
in Pop 1 and 2.7 to 7.7 in Pop 4 (Table 5). On average, the GY represented 71.0% and 58.6% of the controls’ means in the respective populations. Taking into account the upper limit values, the populations corresponded to 92.7% and 85.8% of the controls’ means, demonstrating their potential for recurrent selection. Alves (2014), when making the same sort of comparison, though using progenies of the fifth selection cycle, observed that 72% of the progenies in Lavras-MG and 83% of the progenies in Lambari-Lavras-MG were superior to the P30F53 hybrid. In relation to the GNZ9501 hybrid, the values were 96% in Lavras-MG and 95% in Lambari-MG. This demonstrates the possibility of success with recurrent selection in Pop 1 and Pop 4.
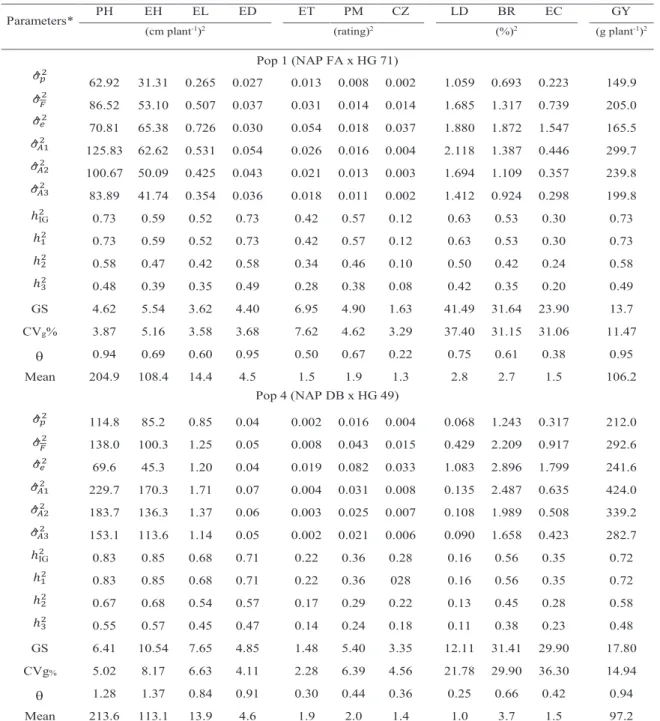
The values of the genetic variance coefficients, in Pop 1 and Pop 4 respectively, were 3.9% and 5.0% for PH, 5.2% and 8.2% for EH, 3.6 and 6.6 for EL, 3.7 and 4.1 for ED, 7.6% and 2.3% for ET, 4.6% and 6.4% for PM, 3.3% and 4.6% for CZ, 37.4% and 21.8% for LD, 31.1 and 29.9% for BR, 31.1 and 36.3% for EC, 11.5% and 14.9% for GY (Table 6). Coefficients of genetic variance over 7% can be considered high, which indicates good participation of genetic factors in the control of GY and EC, and high participation in the control of the EL, LD and BR traits.
The variation index values for PH, EH, ED, PM and GY ranged from 0.7 and 1.0 in Pop 1,
with the minimum value of 0.2 for CZ (Table 6). In Pop 4, values higher than the unit were found for PH (1.3) and EH (1.4) and values close to the unit for EL (0.8), ED (0.9), BR (0.7) and GY (0.9). Variation indices below 0.5 were observed for ET, PM, CZ, LD and EC. This parameter represents additional information for the plant breeder to make decisions related to the selection among progenies. For half-sib progenies, Vencovsky and Barriga (1992) suggest that the values over 1.0 indicate a very favorable condition for selection, as observed for PH and EH in Pop 4. As to GY, the situation can also be considered good in both populations, since the values are close to the unit. Values above the unit were reported by Sohail et al. (2018) for PH (1.1), EH (1.1) and GY (1.4) in the CZP-132011 population.
The values found for PH and EH, in regard to the variance between progenies, were lower in Pop 1 [62.9 and 31.3 (cm plant-1)2] in relation
to Pop 4 [114.8 and 85.2 (cm plant-1)2]. The
same tendency was observed as to the additive variance estimates for any hypothesis considered (Table 6). The additive variance estimates, even considering the hypothesis that 2D = 0, were
125.83 and 62.62 (cm plant-1)2 in Pop 1, and
229.7 and 170.3 (cm plant-1)2 in Pop 4, which are
considered low for those characters in relation to the mean values found by Hallauer et al. (2010), in a survey involving 45 and 56 papers of literature, respectively for PH [212.9 (cm plant-1)2] and
EH [152.7 (cm plant-1)2]. As to EL, the values
of variance between progenies were 0.3 and 0.9 (cm plant-1)2, also with the same tendency as the
Table 6. Estimates of variance between progenies (𝜎𝜎^𝑝𝑝2), phenotypic ( 𝜎𝜎^𝐹𝐹2 ), environmental (𝜎𝜎^
𝛦𝛦2) and additive genetic (𝜎𝜎^𝐴𝐴12 , 𝜎𝜎^𝐴𝐴22 & 𝜎𝜎^𝐴𝐴32 ) variances, heritability coefficients (ℎIG2 , ℎ12, ℎ22 and ℎ32%), gain with selection intensity of 20% (GS %), coefficients of genetic variance (CVg %), variation index (θ) and mean of progenies, for plant height (PH cm), ear height (EH cm), ear length (EL cm), ear diameter (ED cm),
Exserohilum turcicum (ET rating), Phaeosphaeria maydis (PM rating), Cercospora zea maydis (CZ rating), lodging (LD %), breakage (BR %), ears with chalky kernels (EC %)
and grain yield (GY g plant-1) in two maize populations. Chapadão do Sul-MS (2015).
* 𝜎𝜎^𝐴𝐴12 and ℎ22 assuming 𝜎𝜎𝐷𝐷2= 0; 𝜎𝜎^𝐴𝐴22 and ℎ22 assuming 𝜎𝜎𝐷𝐷2= (½)𝜎𝜎𝐴𝐴2; 𝜎𝜎^𝐴𝐴32 and ℎ32 assuming 𝜎𝜎𝐷𝐷2= 𝜎𝜎𝐴𝐴2
Parameters* PH EH EL ED ET PM CZ LD BR EC GY
(cm plant-1)2 (rating)2 (%)2 (g plant-1)2
Pop 1 (NAP FA x HG 71) 𝜎𝜎^𝑝𝑝2 62.92 31.31 0.265 0.027 0.013 0.008 0.002 1.059 0.693 0.223 149.9 𝜎𝜎^𝐹𝐹2 86.52 53.10 0.507 0.037 0.031 0.014 0.014 1.685 1.317 0.739 205.0 𝜎𝜎^𝑒𝑒2 70.81 65.38 0.726 0.030 0.054 0.018 0.037 1.880 1.872 1.547 165.5 𝜎𝜎^𝐴𝐴12 125.83 62.62 0.531 0.054 0.026 0.016 0.004 2.118 1.387 0.446 299.7 𝜎𝜎^𝐴𝐴22 100.67 50.09 0.425 0.043 0.021 0.013 0.003 1.694 1.109 0.357 239.8 𝜎𝜎^𝐴𝐴32 83.89 41.74 0.354 0.036 0.018 0.011 0.002 1.412 0.924 0.298 199.8 ℎIG2 0.73 0.59 0.52 0.73 0.42 0.57 0.12 0.63 0.53 0.30 0.73 ℎ12 0.73 0.59 0.52 0.73 0.42 0.57 0.12 0.63 0.53 0.30 0.73 ℎ22 0.58 0.47 0.42 0.58 0.34 0.46 0.10 0.50 0.42 0.24 0.58 ℎ32 0.48 0.39 0.35 0.49 0.28 0.38 0.08 0.42 0.35 0.20 0.49 GS 4.62 5.54 3.62 4.40 6.95 4.90 1.63 41.49 31.64 23.90 13.7 CVg% 3.87 5.16 3.58 3.68 7.62 4.62 3.29 37.40 31.15 31.06 11.47 0.94 0.69 0.60 0.95 0.50 0.67 0.22 0.75 0.61 0.38 0.95 Mean 204.9 108.4 14.4 4.5 1.5 1.9 1.3 2.8 2.7 1.5 106.2 Pop 4 (NAP DB x HG 49) 𝜎𝜎^𝑝𝑝2 114.8 85.2 0.85 0.04 0.002 0.016 0.004 0.068 1.243 0.317 212.0 𝜎𝜎^𝐹𝐹2 138.0 100.3 1.25 0.05 0.008 0.043 0.015 0.429 2.209 0.917 292.6 𝜎𝜎^𝑒𝑒2 69.6 45.3 1.20 0.04 0.019 0.082 0.033 1.083 2.896 1.799 241.6 𝜎𝜎^𝐴𝐴12 229.7 170.3 1.71 0.07 0.004 0.031 0.008 0.135 2.487 0.635 424.0 𝜎𝜎^𝐴𝐴22 183.7 136.3 1.37 0.06 0.003 0.025 0.007 0.108 1.989 0.508 339.2 𝜎𝜎^𝐴𝐴32 153.1 113.6 1.14 0.05 0.002 0.021 0.006 0.090 1.658 0.423 282.7 ℎIG2 0.83 0.85 0.68 0.71 0.22 0.36 0.28 0.16 0.56 0.35 0.72 ℎ12 0.83 0.85 0.68 0.71 0.22 0.36 028 0.16 0.56 0.35 0.72 ℎ22 0.67 0.68 0.54 0.57 0.17 0.29 0.22 0.13 0.45 0.28 0.58 ℎ32 0.55 0.57 0.45 0.47 0.14 0.24 0.18 0.11 0.38 0.23 0.48 GS 6.41 10.54 7.65 4.85 1.48 5.40 3.35 12.11 31.41 29.90 17.80 CVg% 5.02 8.17 6.63 4.11 2.28 6.39 4.56 21.78 29.90 36.30 14.94 1.28 1.37 0.84 0.91 0.30 0.44 0.36 0.25 0.66 0.42 0.94 Mean 213.6 113.1 13.9 4.6 1.9 2.0 1.4 1.0 3.7 1.5 97.2
additive variance estimates for any hypothesis considered, that is, greater genetic variability in Pop 4. Those values, which correspond to the additive variance if 2D = 0 is assumed, are also
lower than those found by Hallauer et al. (2010). For ED, the values of 0.03 (cm plant-1)2 for Pop
1 and 0.04 (cm plant-1)2 for Pop 4 were close in
magnitude to 0.05 (cm/plant)2 found by Hallauer
et al. (2010) as the mean of 35 reported works. The coefficients of broad-sense heritability for PH (0.7 and 0.8), EH (0.6 and 0.7), EL (0.5 and 0.7), ED (0.7 and 0.7) for Pop 1 and Pop 4 (Table 5), respectively, indicated high to medium genetic control in those characters, which is a favorable condition for selection. In the narrow sense, even considering higher dominance variance participation ( H3- 2
D
= 2 A
), the heritability values were above 0.35, which is still a favorable condition for recurrent selection between progenies, with expected selection gains of 4.62% (PH), 5.54% (EH), 3.62% (EL) and 4.4% (ED). The expected gain values for PH and EH were similar to those estimated by Kist et al. (2010) for the population MPA1, originated from introgression of several traditional materials maintained by small-scale farmers in 18 advanced generations of commercial hybrids. The heritability values for EL and ED were the same as those found by Hallauer et al. (2010), considering 2D = 2A , in Pop 1 and
were higher in Pop 4. For PH, even considering
2 D
= 2 A
, the heritability values were similar to those presented by Hallauer et al. (2010) in the two populations. However, as to EH, this only
happened in Pop 4, while in Pop 1 the value was lower, even considering 2D = 12 𝜎𝜎𝐴𝐴2. Andrade
(2019) found heritability values between 0.63 and 0.75 for PH and EH when assessing a population in two technological level conditions, being the same as those found in this work only if 2
D
= 0 is assumed.
For the PM diseases in Pop 1, there was narrow-sense heritability of 0.38, with the others being below 0.30. The variability expression for diseases may have been masked by the use of fungicides. The highest rating, considering all diseases, was 3.3 (Table 5), which represents a really low level of symptoms. Nevertheless, the expected gains were 6.95% (ET), 4.9% (PM) and 2.97% (CZ). With regard to diseases, it shall be taken into account that there is no interest in maintaining the variability along the recurrent selection cycles. If possible, they shall be started with materials that already have a good tolerance level. For those characters also, whenever possible, it is interesting to standardize the level of symptoms at low values already in the first selection cycles.
The narrow-sense heritability for EC, considering high participation of the dominance effects ( 2
D
= 2A ), was 0.20 in Pop 1 and
0.23 in Pop 4. The upper limits for EC (Table 5) were 5.3% (Pop 1) and 6.2% (Pop 4), which are considered low under crop conditions. Therefore, the expected selection gain is not very significant for this trait. Although it may also be a consequence of some environmental factors and other diseases, the EC mostly reflects the
symptoms of stunt disease complex caused by Mollicutes (Mycoplasma and Spiroplasma).
The estimates of variance between progenies for GY were 149.9 and 212.0 (g plant-1)2 for Pop 1 and Pop 4, respectively. The
additive variance estimates in Pop 1 were 299.7, 239.8 and 199.8 (g plant-1)2, according to the
hypotheses = 0 (H1), 2 D = 12 𝜎𝜎𝐴𝐴2 (H2) and 2 D = 2 A
(H3). In Pop 4, estimates were of higher magnitude, being 424.0, 339.2 and 282.7 (g plant-1)2 for the same hypotheses. Hallauer et
al. (2010) reported means of additive variance estimates of 469.1 (g plant-1)2, based on a total
of 99 papers. However, the additive variance participation in the phenotypic variance was much higher in this work, with heritability of 0.49 (Pop 1) and 0.48 (Pop 4) in relation to the mean of 0.19 found by Hallauer et al. (2010). The expected gain per selection cycle, with intensity of 20% among full-sib progenies, was 13.7% (Pop 1) and 17.8% (Pop 4), which are considered relatively high in comparison with the estimates of 8.16%, 6.86% and 3.88% found by Souza et al. (2018) for selection among half siblings, with the same selection intensity, for the semiexotic populations CRE-01, CRE-02 and CRE-03. Andrade (2019), when assessing a maize population under high and low technological level conditions, found heritability values of low magnitude (0.15 with high technology and 0.08 with low technology), and expected gains of 6.56% and 7.5% with selection intensity of 10% among half-sib progenies.
In general, it can be noted that there are
promising progenies for all the agronomic characters evaluated, but especially for GY, when compared to the controls that are commercial hybrids and can be considered as presenting broad adaptation and high grain yield. Such result indicates the possibility to incorporate, in the improvement program, germplasm that does not belong to the genetic base commonly in use, with positive results, contributing with new alleles (even rare alleles) and increase of genetic variability useful to enhancement.
Conclusions
Based on the results obtained, the semiexotic populations NAP-FA x 71, NAP-FL x HG-49, NAP-FB x HG-HG-49, and NAP-DB x HG-49 revealed good grain yield potential for materials at start of improvement, acceptable standards for other traits, and inbreeding depression within normal standards for variable populations that have not yet been submitted to selection. For the populations FA x HG-71 and NAP-DB x HG-49, the significant genetic variability, mainly as to grain yield, confirms their potential to be used in intra-population recurrent selection programs, with the NAP-DB x HG-49 tending to present a bit more variability.
Inbreeding depression was higher for grain yield due to the trait’s complexity. The measurement of genetic variability showed the expression of genetic variance for the populations, thus resulting in positive prospects for recurrent selection and cultivar development.
2 D
References
ALVES, N. B. Avaliação de progênies do quinto ciclo de seleção recorrente recíproca em milho. 2014. 57 p. Dissertação (Mestrado)
- Universidade Federal de Lavras, Lavras, 2014. ANDRADE, J. A. C. Genetic variability and breeding potential of Flintisa Composite of maize in two levels of technology. Crop Breeding and Applied Biotechnology, v. 19, n. 2, p. 145-152,
2019. DOI: 10.1590/1984-70332019v19n2a21. ANDRADE, J. A. C.; MIRANDA FILHO, J. B. Quantitative variation in the tropical maize population ESALQ-PB1. Scientia Agricola, v.
65, n. 2, p. 174-182, 2008. DOI: 10.1590/S0103-90162008000200011.
BRIEGER, F. G.; GURGEL, J. T. A.; PATERNIANI, E.; BRUMENSCHEIN, A.; ALLEONI, M. R. Races of maize in Brazil and other eastern South American countries.
Washington: NAS-NRC, 1958.
CARENA, M. J. Challenges and opportunities for developing maize cultivars in the public sector.
Euphytica, v. 191, n. 2, p. 165-171, 2013a. DOI: 10.1007/s10681-013-0870-x.
CARENA, M. J. Development of cold and drought tolerant short-season maize germplasm for fuel and feed utilization. Crop Breeding and Applied Biotechnology, v. 13, n. 1, p. 1-8, 2013b.
DOI: 10.1590/S1984-70332013000100001.
CRUZ, C. D.; CARNEIRO, P. C. S.; REGAZZI, A. J. Modelos biométricos aplicados ao melhoramento genético. 3. ed. Viçosa, MG:
Editora UFV, 2014. v. 2, 668 p.
GOODMAN, M. M. Broadening the U.S. maize germplasm base. Maydica, v. 50, n. 3, p.
203-214, 2005.
HALLAUER, A. R.; CARENA, M. J.; MIRANDA FILHO, J. B. Quantitative genetics in maize breeding. New York: Springer, 2010.
680 p.
KIST, V. Seleção recorrente de famílias de meios-irmãos em população composta de milho (Zea mays L.). 2006. 163 p. Dissertação
(Mestrado em Recursos Genéticos Vegetais) - Universidade Federal de Santa Catarina, Florianópolis, 2006.
KIST, V.; OGLIARI, J. B.; MIRANDA FILHO, J. B.; ALVES, A. C. Genetic potential of a maize population from Southern Brazil for the modified convergent-divergent selection scheme.
Euphytica, v. 176, p. 25-36, 2010. DOI: 10.1007/ s10681-010-0207-y.
MENDES, U. C.; MIRANDA FILHO, J. B.; OLIVEIRA, A. S.; REIS, E. F. Heterosis and combining hability in crosses between two groups of open-pollinated maize populations.
Crop Breeding and Applied Biotechonology,
v. 15, n. 4, p. 235-243, 2015. DOI: 10.1590/1984-70332015v15n4a40.
MIRANDA FILHO, J. B. de; NASS, L. L.; SANTOS, M. X. dos; REGITANO NETO,
A. Avaliação dos acessos de milho para
resistência a doenças foliares. Brasília, DF:
Embrapa Recursos Genéticos e Biotecnologia, 2000. 147 p. (Embrapa Recursos Genéticos e Biotecnologia. Circular Técnica, 3).
MIRANDA FILHO, J. B.; REIS, E. F. Genetic enhancement of semi-exotic maize germplasm.
Revista Brasileira de Milho e Sorgo, v. 15, n.
2, p. 346-356, 2016. DOI: 10.18512/1980-6477/ rbms.v15n2p346-356.
MORAES, D. F.; BRITO, C. H. Análise de possível correlação entre as características morfológicas do colmo do milho e o acamamento.
Horizonte Científico, v. 2. n. 2, 2008.
Disponível em: <http://www.seer.ufu.br/index. php/horizontecientifico/article/view/4079>. Acesso em: 20 dez. 2019.
OLIVEIRA, A. S.; MIRANDA FILHO, J. B.; REIS, E. F. Variability and inbreeding in semiexotic maize populations. Genetics and Molecular Research, v. 14, n. 1, p. 1184-1199,
2015a. DOI: 10.4238/2015.February.6.21.
OLIVEIRA, A. S.; REIS, E. F.; MIRANDA FILHO, J. B.; MENDES, U. C.; RODRIGUES, L.
O. Genetic variability and yield potential of three semiexotic maize (Zea mays L.) populations.
Bioscience Journal, v. 31, n. 6, p. 1609-1617,
2015b. DOI: 10.14393/BJ-v31n6a2015-28783. PATERNIANI, M. E. A. G. Z.; BERNINI, C. S.; GUIMARÃES, P. S.; RODRIGUES, C. S. Estratégias de melhoramento para tolerância à seca em germoplasma de milho tropical. Singular Meio Ambiente e Agrárias, v. 1, n. 1, p. 19-24,
2019. DOI: 10.33911/singular-maa.v1i1.48.
RODRIGUES, L. O. Variabilidade genética em quatro populações semiexóticas de milho.
2013. 57 f. Dissertação (Mestrado em Agronomia) - Universidade Federal de Goiás, Jataí, 2013. SILVEIRA, D. C.; BONETTI, L. P.; TRAGNAGO, J. L.; NETO, N.; MONTEIRO, V. Caracterização agromorfológica de variedades de milho crioulo (Zea mays L.) na região noroeste do Rio Grande do Sul. Ciência e Tecnologia, v.
1, n. 1, p. 1-11, 2015.
SOHAIL. A.; RAHMAN, H.; HUSSAIN, H.; HADI, F.; ULLAH, U.; KHAN, W.; KHAN, M. A.; ASAD, M.; YOUSAFZAI, Z.; SAMI, S.; UDDIN S. Genetic variability, heritability and correlation studies in half sib recurrent families of Cimmyt maize population czp-132011. Journal of Agricultural and Biological Science, v. 13, n.
10, p. 106-112, 2018.
SOMERA, A.; RAGAGNIN, A. L. S. L.; LIMA, M. C.; CANDIDO, W. S.; REIS, E. F. Inbreeding
depression and performance of partially self-fertilized maize progenies in a top cross.
Chilean Journal of Agricultural Research, v.
78, n. 3, p. 318-326, 2018. DOI: 10.4067/S0718-58392018000300318.
SOUZA , A. C.; MIRANDA FILHO, J. B.; OLIVEIRA, A. S.; PINTO, J. F. N. SILVA, C. M.; REIS E. F. Genetic variability and expected gain in three maize populations. Revista Brasileira de
Milho e Sorgo, v. 17, n. 1, p. 135-146, 2018. DOI: 10.18512/1980-6477/rbms.v17n1p135-146.
VENCOVSKY, R.; BARRIGA, P. Genética biométrica no fitomelhoramento. Ribeirão
Preto: Sociedade Brasileira de Genética, 1992. 496 p.