INTRODUCTION
Maize (Zeamays L.) is the most important cereal crop in the world. Considerable effort has been spent in collecting and preserving varieties of maize from the Americas, in order to maintain the genetic diversity nec-essary for research and breeding (Paterniani and Good-man, 1978). Zeamays L. contains more than 200 races divided into three groups (ancient commercial races, the recent commercial races, and indigenous races). The conservation of the latter is particularly important since most of these materials are no longer cultivated because they have been replaced by more productive commercial hybrids. The races in the indigenous group are cultivated by Amerindians. Historically, four indigenous races (Moroti, Caingang, Lenha and Entrelaçado) occurred in Brazil.
Although they have no commercial value, the in-digenous races have many important characteristics which may be incorporated into maize breeding programs, in-cluding a high level of genetic variability, a large number of kernel rows, low ear height, and high heterotic re-sponses in some crosses (Paterniani and Goodman, 1978). Most stocks of the germplasm from indigenous races were collected at least 40 years ago, with few new additions being made to gene banks. However, nothing is known of the genetic variability present in this germ-plasm.
The objective of this study was to assess the genetic variability present in indigenous races using isozyme pro-files.
MATERIAL AND METHODS
Plant material
Plants of populations from four indigenous races and five cultivars of unknown races cultivated by Ame-rindians in Brazil and adjacent areas were analyzed (Table I). The populations were obtained from collections main-tained by AGROCERES and by CNMS (Centro Nacional de Milho e Sorgo) in Brazil. The populations from AGROCERES were formed by bulking a variable num-ber of collections (Table I). These populations were es-tablished using morphological characters, mainly because of the unavailability of storage facilities and manpower to maintain the individual collections and because many of the races described were already represented by nu-merous similar collections (Paterniani and Goodman, 1978). The cultivars from unknown indigenous races were based on single accessions.
Isozyme and electrophoretic analysis
Each plant was analyzed for five isoenzymatic sys-tems detecting 14 loci. Coleoptiles 1.5 cm long were ob-tained from plants grown at 20oC in the dark for 4-6 days
and homogenized in 30 µl of extraction buffer (16.3% sucrose, 8.3% ascorbic acid, pH 7.4). The isozymes were electrophoresed in a 13% nonhydrolyzed starch (pene-trose) gel. The buffer systems, electrophoretic conditions and staining techniques were described by Kephart (1990) and Stuber et al. (1988).
Isoenzymatic variation in the germplasm of Brazilian races
of maize (
Zea mays
L.)
Marcos Aparecido Gimenes and Catalina Romero Lopes
Abstract
There are more than 200 races of maize (Zeamays L.) divided into three groups (ancient commercial races, the recent commercial races, and indigenous races). Although the indigenous races have no commercial value, they have many important characteristics which can be incorporated into maize breeding programs. Most Brazilian indigenous germplasm race stocks were collected at least 40 years ago, and nothing is known of the genetic variability present in this germplasm. The genetic variability was assayed in 15 populations from four indigenous races of maize (Caingang, Entrelaçado, Lenha and Moroti) and five indigenous cultivars, using five isoenzymatic systems encoded by 14 loci. The analysis revealed a low level of variability among the samples studied. Overall, the mean number of alleles/ polymorphic locus was three, 64.3% of the loci analyzed being polymorphic and the estimated heterozygosity was 0.352. The mean number of alleles/polymorphic locus per population was 1.6. A mean of 47.5% of the loci were polymorphic. The mean expected heterozygosity was 0.195, the mean genetic identity was 0.821 and the proportion of total genetic diversity partitioned among popula-tions (Gst) was 0.156. A founder effect could explain the low variability detected.
Departamento de Genética, IB, UNESP, Botucatu, SP, Brasil.
Data analysis
The genotypes were inferred based on the band pat-terns and the genetic control of the loci analyzed, as de-scribed by Stuber et al. (1988). The data were analyzed using the program BIOSYS (Swofford and Selander, 1989). The number of alleles per locus (total number of alleles in the polymophic loci/number of polymorphic loci), the percentage of polymorphic loci (number of polymorphic loci/total number of loci analyzed), and the expected heterozygosity (H = 1 - Σ pi2, with p
i being the mean
fre-quency of the i allele in a locus) were calculated for each population. Nei’s genetic diversity statistic (Nei, 1972) was used to apportion the genetic diversity within and among populations. The genetic identities between all possible pairs of populations were computed following Roger (1972). A tree was generated using the unweighted pair-group method algorithm - UPGMA (Sneath and Sokal, 1973).
RESULTS
A mean of 30.95 plants were analyzed per popula-tion. Nine of the 14 loci were polymorphic (Table II) when all the populations are analyzed as a whole (a polymor-phic locus is one at which the most common allele has a frequency <0.99). Loci Est8, Got2, Got3, Mdh3 and
Mdh6 were monomorphic. Overall, 27 alleles were found in the nine polymorphic loci analyzed, with an average of
three alleles per locus. The average number of alleles per locus per population was 1.59, and ranged from 1.4 for population Mt III to 1.8 for population RGS XX. Few al-leles were rare, having frequencies of 0.01 or less (Table III). The average locus heterozygosity per population was 0.195 in the nine polymorphic loci analyzed. The mean expected heterozygosity per population (Hp) varied from 0.019 for Mdh4 to 0.459 for Acp4.
The frequencies of most of the alleles were similar in most of the populations (Table II). However, some alleles were found in only one population, or occurred in two or three populations at very high frequencies. Allele Acp4-5 was detected only in population CC from CNMS (Table II). Allele Idh1-3 showed a very high frequency in population BRA 017574, but was detected at very low frequencies in two other populations (RGS XX and BRA 017568).
Populations formed by one to three collections were sometimes more variable than populations formed by more than three collections. On average, 84% of the genetic varia-tion occurred within populavaria-tions (Table IV). The variavaria-tion among populations ranged from 5 to 32%.
The mean genetic similarity was 0.821 (Table V). The values varied from 0.746 between populations BRA 017574 and SP XIV to 0.944 between populations BRA 014148 and Pe I.
Figure 1 summarizes the relationships between the po-pulations. In general, populations from the same races were not grouped together.
Table I - Number of maize plants analyzed from each of the 15 populations from the maize races Moroti, Caingang, Lenha, Entrelaçado and five indigenous cultivars. Race Population Number of individuals Collections Total
bulked to form AGR CNMS the populations*
Moroti Pr II 024 - 1 24
Bol II 031 44 2 75
Pe I 032 - 1 32
Mt III 016 - 2 16
Pag VI 031 - 8 31
Pag VII 024 - 3 24
Bol I 020 - 5 20
Pag VI-A 028 - 1 28
Caingang Pr III 033 - 9 33
SP XIV 029 - 2 29
CC 041 16 n.a 57
Lenha RGS XX - 22 3 22
Entrelaçado Mt VI - 47 10 47
Indigenous cultivars BRA 017586 - 30 n.a. 30
BRA 017568 - 47 n.a. 47
BRA 017574 - 40 n.a. 40
BRA 017581 - 28 n.a. 28
BRA 014148 - 36 n.a. 36
Total 309 310 619
Table II - Allele frequencies of the 14 loci analyzed in 15 populations of maize
from the races Moroti (M), Caingang (C), Lenha (L), Entrelaçado (E) and five indigenous cultivars (IC).
Populations Allele Est9 Est8 Got1 Got2 Got3 Idh1 Idh2 Acp1 Acp4 Mdh1 Mdh2 Mdh3 Mdh4 Mdh6 Pr II-M 1 0.750 1.000 0.529 1.000 1.000 0.917 1.000 0.729 0.708 0.295 0.432 1.000 1.000 1.000
2 0.250 0.471 0.083 0.146 0.167 0.659 0.568
3 0.125 0.125 0.045
Bol II-M 1 0.919 1.000 0.597 1.000 1.000 0.694 1.000 0.661 0.339 0.040 0.200 1.000 1.000 1.000
2 0.081 0.403 0.306 0.339 0.661 0.960 0.800
Bol IIB-M 1 0.784 1.000 0.477 1.000 1.000 0.909 1.000 0.727 0.420 0.148 0.148 1.000 1.000 1.000
2 0.216 0.523 0.091 0.205 0.580 0.852 0.739
3 0.068 0.114
Pe I-M 1 0.797 1.000 0.266 1.000 1.000 0.766 1.000 0.922 0.438 0.242 0.484 1.000 1.000 1.000
2 0.203 0.734 0.234 0.047 0.563 0.758 0.516
3 0.031
Mt III-M 1 0.625 1.000 0.375 1.000 1.000 1.000 1.000 1.000 0.094 0.063 0.563 1.000 1.000 1.000
2 0.375 0.625 0.906 0.937 0.437
Pag VI-M 1 0.952 1.000 0.484 1.000 1.000 0.839 1.000 0.484 0.452 0.439 0.606 1.000 1.000 1.000
2 0.048 0.516 0.161 0.516 0.516 0.561 0.394
3 0.032
Pag VII-M 1 0.667 1.000 0.333 1.000 1.000 0.875 1.000 1.000 0.604 0.229 0.208 1.000 1.000 1.000
2 0.333 0.667 0.125 0.292 0.688 0.417
3 0.104 0.083 0.375
Bol I-M 1 0.775 1.000 0.700 1.000 1.000 0.625 0.775 0.900 0.450 0.075 0.425 1.000 1.000 1.000
2 0.225 0.300 0.375 0.225 0.100 0.525 0.925 0.575
3 0.025
Pag VIA-M 1 0.964 1.000 0.714 1.000 1.000 0.893 1.000 0.643 0.536 0.393 0.929 1.000 1.000 1.000
2 0.036 0.286 0.107 0.357 0.464 0.607 0.071
Pr III-C 1 0.788 1.000 0.621 1.000 1.000 0.500 0.833 0.848 0.576 0.280 0.420 1.000 1.000 1.000
2 0.212 0.379 0.500 0.167 0.030 0.424 0.560 0.580
3 0.121 0.000
4 0.160
SP XIV-C 1 0.586 1.000 0.586 1.000 1.000 1.000 0.638 0.172 1.000 0.089 0.429 1.000 1.000 1.000
2 0.414 0.414 0.362 0.690 0.911 0.571
3 0.138
CC-C 1 0.692 1.000 0.385 1.000 1.000 0.872 0.782 0.603 0.275 0.286 0.500 1.000 1.000 1.000
2 0.308 0.615 0.128 0.218 0.397 0.550 0.679 0.500
3 0.175 0.000
4 0.000
5 0.036
CC-C 1 0.639 1.000 0.583 1.000 1.000 0.806 0.583 1.000 0.000 0.542 0.292 1.000 1.000 1.000
2 0.361 0.417 0.194 0.417 1.000 0.458 0.375
3 0.333
RGS XX-E 1 0.783 1.000 0.652 1.000 1.000 0.913 0.130 1.000 0.563 0.450 0.250 1.000 1.000 1.000
2 0.217 0.348 0.065 0.435 0.396 0.550 0.500
3 0.022 0.435 0.042 0.250
Mt VI-L 1 0.849 1.000 0.267 1.000 1.000 0.837 0.756 0.721 0.477 0.287 0.538 1.000 1.000 1.000
2 0.151 0.733 0.163 0.244 0.093 0.372 0.712 0.463
3 0.186 0.151
O17586-IC 1 0.483 1.000 0.417 1.000 1.000 0.883 1.000 0.900 0.483 0.000 0.417 1.000 1.000 1.000
2 0.517 0.583 0.117 0.100 0.450 1.000 0.583
3 0.067
017568-IC 1 0.830 1.000 0.947 1.000 1.000 0.798 0.766 0.957 0.755 0.000 0.533 1.000 1.000 1.000
2 0.170 0.053 0.160 0.234 0.043 0.245 1.000 0.467
3 0.043
017574-IC 1 0.925 1.000 0.125 1.000 1.000 0.066 0.600 1.000 0.375 0.013 0.850 1.000 1.000 1.000
2 0.075 0.875 0.303 0.400 0.625 0.988 0.150
3 0.632
017581-IC 1 0.696 1.000 0.429 1.000 1.000 0.768 1.000 1.000 0.393 0.196 0.821 1.000 0.714 1.000
2 0.304 0.571 0.232 0.607 0.804 0.179 0.286
014148-IC 1 0.847 1.000 0.347 1.000 1.000 0.875 0.986 0.764 0.389 0.069 0.639 1.000 1.000 1.000
2 0.153 0.653 0.125 0.014 0.236 0.611 0.847 0.361
3 0.000
4 0.083
DISCUSSION
There was a mean of three alleles per locus, with nine polymorphic loci among the 14 loci analyzed. An isoen-zymatic analysis of Mexican germplasm, where a mean of 32.8 individuals were analyzed, showed a mean of 7.09 alleles in the 23 loci analyzed, with 95.3% of the loci polymorphic and a total genetic variability of 0.251 (Doebley et al., 1985). A study of maize from Bolivia, where a mean of 39 individuals were analyzed, showed a mean of 5.17 alleles in the 23 loci analyzed, with 86.9%
of the loci polymorphic (Goodman and Stuber, 1983). Based on the loci analyzed in all three studies (Est8, Got1,
Got2, Got3, Idh1, Idh2, Mdh1, Mdh2, Mdh3 and Mdh4), the mean number of allele/locus for the Mexican maize study would be 6, 4.9 for the Bolivian and 2.2 in this study. A reduction in variability in the sample analyzed may have occurred by a founder effect, as indicated by the high fre-quency of allele Idh1-3 in population BRA 017574 (Table II) and its low frequency in two other populations (RGS XX and BRA 017568). The lack of variation between maize from different cultural groups may be a consequence of the small sample size collected and of the founder effects (Doebley et al., 1983). According to Heywood and Fle-ming (1986), low variability within populations may oc-cur as a result of recent founding of a population from a small number of individuals, a recent reduction in the po-pulation size or a restricted genetic flow among popula-tions. Since the populations in our study were cultivated under the same environmental conditions, environment is unlikely to account for the variable frequency of Idh1-3. Despite the low allelic diversity detected, the mean expected heterozygosity was higher than that reported by Gottlieb (1981) for outcrossing plants. According to Fu-tuyma (1992), the level of heterozygosity in a derived popu-lation is nearly as high as in the original popupopu-lation because rare alleles contribute little to the level of heterozygosity, and such alleles are also likely to be absent in the derived population.
The lack of correlation between the number of col-lections used to form the populations and the genetic
vari-Table III - Genetic variability of the nine polymorphic loci analyzed in 15 populations of indigenous races of maize (Moroti, Caingang, Lenha and Entrelaçado) and five indigenous cultivars. Races Populations Number Total number Number Polymorphic Expected
of plants of alleles of alleles/locus loci (%) heterozygosity
Moroti Pr II 24 24 1.7 50.0 0.210
Bol II 31 21 1.5 42.9 0.171
Bol II - CNMS 44 23 1.6 50.0 0.187
Pe I 32 22 1.6 50.0 0.187
Mt III 16 19 1.4 35.7 0.127
Pag VI 31 22 1.6 42.9 0.208
Pag VII 24 23 1.6 42.9 0.201
Bol I 20 23 1.6 57.1 0.214
Pag VIA 28 21 1.5 42.9 0.163
Caingang Pr III 33 24 1.7 57.1 0.247
SP XIV 29 21 1.5 42.9 0.186
CC 41 24 1.7 57.1 0.252
CC - CNMS 16 21 1.5 42.9 0.215
Entrelaçado RGS XX 22 25 1.8 50.0 0.234
Lenha Mt VI 47 24 1.7 57.1 0.235
Indigenous cultivars BRA 017586 30 21 1.5 42.9 0.176
BRA 017568 47 22 1.6 42.9 0.146
BRA 017574 40 22 1.6 42.9 0.151
BRA 017581 28 21 1.5 50.0 0.201
BRA 014148 36 23 1.6 50.0 0.183
Mean 31 22.3 1.6 47.5 0.195
For abbreviations see legend to Table I.
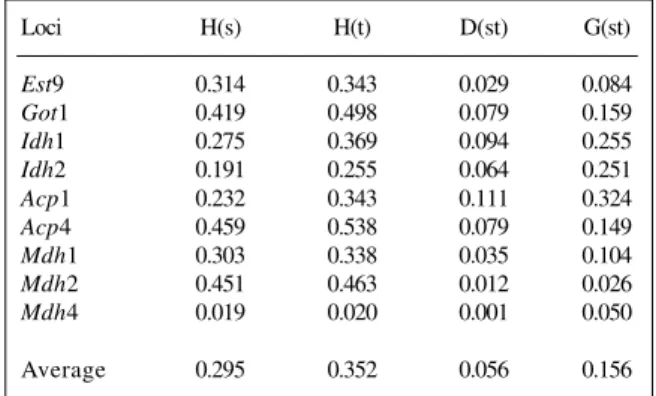
Table IV - Genetic diversity of nine polymorphic loci in 15 populations and five cultivars of the indigenous races of maize analyzed.
Loci H(s) H(t) D(st) G(st)
Est9 0.314 0.343 0.029 0.084
Got1 0.419 0.498 0.079 0.159
Idh1 0.275 0.369 0.094 0.255
Idh2 0.191 0.255 0.064 0.251
Acp1 0.232 0.343 0.111 0.324
Acp4 0.459 0.538 0.079 0.149
Mdh1 0.303 0.338 0.035 0.104
Mdh2 0.451 0.463 0.012 0.026
Mdh4 0.019 0.020 0.001 0.050
ability found in the resulting populations may be because: 1) the original collections had different levels of variabil-ity, 2) some collections were better sampled than others, and 3) the populations formed by a large number of col-lections had their variability reduced due to phenomena such as bottleneck or founder effects. With regard to the latter possibility, our results suggested a founder effect as one probable cause for the lack of correlation men-tioned above. No inferences can be made about hypoth-eses 1 and 2 because comparisons between the studied and the original populations would be necessary. This is no longer possible since the original populations and col-lections are no longer available.
More than 83.3% of the genetic variation (Hs/Ht) was within the populations. An analysis of Mexican germo-plasm showed that 72% of the variation occurred within the collections and 28% was due to differences between them (Doebley et al., 1985). In conifers, this value usu-ally exceeds 90% (Guries and Ledig, 1982; Dancik and Yeh, 1983; Moran et al., 1988). According to Hamrick and Loveless (1986), there is a general tendency for out-crossing plant species to show little or no differentiation among populations.
In our study, populations from different races were more similar to each other than populations from the same race. For instance, the populations of Bol I, which belongs to Moroti race, and Pr III, which belongs to the Caingang race, were more similar to each other (I = 0.886) than were CC (CNMS) and SP XIV, which belong to the Caingang race. A lack of well-defined racial groups was also observed in the analysis of Mexican maize germplasm (Doebley et al., 1985). On the other hand, an analysis of the races of maize in Bolivia showed that racial
similari-Table V - Matrix of Rogers’ identity (below the diagonal) and distance (above the diagonal) among the
15 populations and five indigenous cultivars of the four indigenous races of maize (Moroti, Caingang, Lenha and Entrelaçado) studied.
Populations 1 2 3 4 5 6 7 8 9 10 11 12 13 14 15 16 17 18 19 20
1 Pr II **** 0.113 0.067 0.080 0.119 0.090 0.075 0.103 0.103 0.086 0.122 0.086 0.159 0.123 0.080 0.083 0.112 0.223 0.124 0.091
2 Bol II 0.887 **** 0.062 0.099 0.128 0.100 0.142 0.083 0.118 0.114 0.171 0.115 0.171 0.175 0.132 0.106 0.135 0.183 0.137 0.086
3 Bol II - CNMS 0.933 0.938 **** 0.068 0.099 0.092 0.088 0.090 0.118 0.109 0.155 0.089 0.153 0.134 0.098 0.074 0.134 0.195 0.108 0.061
4 Pe I 0.920 0.901 0.932 **** 0.085 0.090 0.073 0.080 0.124 0.090 0.186 0.081 0.145 0.142 0.059 0.074 0.118 0.147 0.075 0.056
5 Mt III 0.881 0.872 0.901 0.915 **** 0.136 0.097 0.121 0.163 0.155 0.175 0.102 0.122 0.174 0.122 0.074 0.142 0.171 0.095 0.077
6 Pag VI 0.910 0.900 0.908 0.910 0.864 **** 0.125 0.129 0.064 0.122 0.166 0.081 0.162 0.153 0.092 0.120 0.153 0.199 0.123 0.073
7 Pag VII 0.925 0.858 0.912 0.927 0.903 0.875 **** 0.128 0.141 0.121 0.176 0.101 0.127 0.117 0.094 0.080 0.135 0.195 0.103 0.094
8 Bol I 0.897 0.917 0.910 0.920 0.879 0.871 0.872 **** 0.132 0.058 0.146 0.101 0.139 0.125 0.099 0.086 0.074 0.155 0.121 0.100
9 Pag VI-A 0.897 0.882 0.882 0.876 0.837 0.936 0.859 0.868 **** 0.129 0.190 0.117 0.182 0.150 0.123 0.144 0.143 0.197 0.126 0.097
10 Pr III 0.914 0.886 0.891 0.910 0.845 0.878 0.879 0.942 0.871 **** 0.167 0.112 0.141 0.117 0.096 0.117 0.111 0.184 0.139 0.122
11 SP XIV 0.878 0.829 0.845 0.814 0.825 0.834 0.825 0.854 0.810 0.833 **** 0.136 0.201 0.185 0.158 0.143 0.149 0.254 0.216 0.172
12 CC 0.914 0.885 0.911 0.919 0.898 0.919 0.899 0.899 0.883 0.888 0.864 **** 0.131 0.145 0.062 0.095 0.135 0.186 0.117 0.076
13 CC - CNMS 0.841 0.829 0.847 0.855 0.878 0.838 0.873 0.861 0.818 0.859 0.799 0.869 **** 0.112 0.150 0.162 0.172 0.203 0.154 0.166
14 RGS XX 0.877 0.825 0.866 0.858 0.826 0.847 0.883 0.875 0.850 0.883 0.815 0.855 0.888 **** 0.134 0.155 0.139 0.218 0.175 0.163
15 Mt VI 0.920 0.868 0.902 0.941 0.878 0.908 0.906 0.901 0.877 0.904 0.842 0.938 0.850 0.866 **** 0.106 0.107 0.153 0.124 0.073
16 017586 0.917 0.894 0.926 0.926 0.926 0.880 0.920 0.914 0.856 0.883 0.857 0.905 0.838 0.845 0.894 **** 0.115 0.184 0.105 0.078
17 017568 0.888 0.865 0.866 0.882 0.858 0.847 0.865 0.926 0.857 0.889 0.851 0.865 0.828 0.861 0.893 0.885 **** 0.179 0.152 0.122
18 017574 0.777 0.817 0.805 0.853 0.829 0.801 0.805 0.845 0.803 0.816 0.746 0.814 0.797 0.782 0.847 0.816 0.821 **** 0.151 0.143
19 017581 0.876 0.863 0.892 0.925 0.905 0.877 0.897 0.879 0.874 0.861 0.784 0.883 0.846 0.825 0.876 0.895 0.848 0.849 **** 0.084
20 014148 0.909 0.914 0.939 0.944 0.923 0.927 0.906 0.900 0.903 0.878 0.828 0.925 0.834 0.837 0.927 0.922 0.878 0.857 0.916 ****
For abbreviations see legend to Table I.
Figure 1 - Phenogram constructed by UPGMA clustering of a matrix of Roger’s distance (1972), derived from the mean allelic frequencies of 15 populations from the races Moroti (M), Caingang (C), Lenha (L), Entre-laçado (E) and five indigenous cultivars (IC) of maize. For abbreviations see legend to Table I.
Pr II (M)
Bol II - CNMS (M) Pag VII (M) Pe I (M) BRA 014148 (IC) CC (C) Mt VI (E) Mt III (M) BRA 017586 (IC) Bol II (M)
ties defined based on ear morphology, general plant agro-ecological adaptation, and geographical source are also valid for isoenzymes (Goodman and Stuber, 1983). The divergence between morphological and isoenzymatic data is not surprising since morphological characteristics are chosen for their taxonomic constancy and not for indicat-ing strong genetic differentiation (Gottlieb, 1974). Lewandowski and Mejnartowicz (1991) suggested that dif-ferences between morphological and isoenzymatic data reflect the fact the evolutionary forces act differently on those two parameters; isozyme alleles may have no evo-lutionary significance.
The genetic similarity among populations collected in different geographic regions, as in the case of Pr II and Mt VI, was sometimes higher than that among populations from the same race, collected at sites very close to each other. This suggests that there is little correlation between the geographic and genetic distances among populations. This same lack of correlation has also been found in popu-lations of Desmodium nudiflorum, an annual allogamous and herbaceous plant (Schaal and Smith, 1980). The pres-ence of such correlation between plant populations often indicates that the differentiation results from geographic isolation (Wendel and Parks, 1985). The lack of correla-tion between these two distances in the populacorrela-tions ana-lyzed suggests that the populations could not be charac-terized because of the loss of genetic variation.
ACKNOWLEGDMENTS
Publication supported by FAPESP.
RESUMO
Existem mais de 200 raças de milho (Zeamays L.), as quais são divididas em três grupos (raças comerciais antigas, raças comerciais recentes e raças indígenas). As raças indígenas, embora não tenham valor comercial, possuem muitas características impor-tantes que podem ser utilizadas em programas de melhoramento de milho. A maior parte do germoplasma brasileiro das raças de milho indígena foi coletada, no mínimo, 40 anos atrás e nada é conhecido sobre a variabilidade presente neste germoplasma. Quinze populações de 4 raças indígenas de milho (Caingang, Entrelaçado, Lenha e Moroti) e 5 cultivares indígenas foram analisados utilizando-se 5 sistemas isoenzimáticos codificados por 14 locos. A análise revelou um baixo nível de variabilidade entre as amostras estudadas. O número médio de alelos/loco foi três, com 64,3% de locos polimórficos e uma heterozigosidade média esperada de 0,352. Por população, a média de número de alelos por loco polimórfico foi 1,6, em média 47,5% dos locos foram
polimórficos e a heterozigosidade média foi 0,195. A distância genética média entre as populações foi 0,821 e a proporção da variabilidade genética, que é atribuída ao componente entre po-pulações (Gst), foi 0,156. Os dados sugerem que um efeito de fundador poderia explicar a baixa variabilidade detectada.
REFERENCES
Dancik, B.P. and Yeh, F.C. (1983). Allozyme variability and evolution of lodgepole pine (Pinus contorta var. latifolia) and jackpine (P. banksiana) in Alberta. Can. J. Genet. Cytol. 25: 57-71.
Doebley, J.F., Goodman, M.M. and Stuber, C.W. (1983). Isozyme variation in maize from the south western United States: taxonomic and anthropo-logical implications. Maydica28: 97-120.
Doebley, J.F., Goodman, M.M. and Stuber, C.W. (1985). Isozyme variation in the races of maize from Mexico. Am. J. Bot. 72: 629-639.
Futuyma, D.J. (1992). Biologia Evolutiva. Sociedade Brasileira de Genética, Ribeirão Preto, SP, Brasil.
Goodman, M.M. and Stuber, C.W. (1983). Races of maize. VI. Isozyme varia-tion among races of maize in Bolivia. Maydica28: 169-187.
Gottlieb, L.D. (1974). Allelic diversity in the outcrossing annual plant Ste-phanomeriaexigua ssp. Carotifera (Compositae). Evolution29: 213-225.
Gottlieb, L.D. (1981). Electrophoretic evidence and plant population. Prog. Phytochem. 7: 1-46.
Guries, P.R. and Ledig, F.T. (1982). Genetic diversity and population struc-ture in pitch pine (Pinus rigida MILL). Evolution36: 387-402. Hamrick, J.L. and Loveless, M.D. (1986). Isozyme variation in tropical trees:
procedures and preliminary results. Biotropica18: 201-207. Heywood, J.S. and Fleming, T.H. (1986). Patterns of allozyme variation in
three Costa Rican species of piper. Biotropica18: 208-216.
Kephart, S.R. (1990). Starch gel electrophoresis of plant isozymes: a com-parative analysis of techniques. Am. J. Bot.77: 693-712.
Lewandowski, A. and Mejnartowicz, L. (1991). Levels and patterns of allozyme variation in some European larch (Larix decidua) populations. Heredi-tas115: 221-226.
Moran, G.F., Bell, J.C. and Eldridge, K.G. (1988). The genetic structure and the conservation of the five natural populations of Pinusradiata. Can. J. For. Res. 18: 506-514.
Nei, M. (1972). Genetic distance between populations. Am. Nat. 106: 283-292. Paterniani, E. and Goodman, M.M. (1978). Races of Maize in Brazil and Adjacent Areas. Mexico: International Maize and Wheat Improvement Center, Mexico City.
Roger, J. (1972). Measures of Genetic Similarity and Distance. Studies Genetics VII. University Texas Publ. (7213), Texas, pp. 145-153. Schaal, A.B. and Smith, W.G. (1980). The apportionment of genetic
varia-tion within and among populavaria-tions of Desmodiumnudiflorum. Evolu-tion34: 214-221.
Sneath, P. and Sokal R.R. (1973). Numerical Taxonomy. 2nd edn. W.H. Freeman, San Francisco.
Stuber, C., Wendel, J. and Goodman, M.M. (1988). Techniques and scoring procedures of starch gel electrophoresis of enzymes from maize (Zea mays L.). Tech. Bull. North Carol. State Univ. Raleigh286: 87. Swofford, D.L. and Selander, R.B. (1989). A Computer Program for the
Analysis of the Allelic Variation in Population Genetics and Biochemi-cal Systematics. Illinois Natural History Survey, Champaign. Wendel, J.F. and Parks, C.R. (1985). Genetic diversity and population
struc-ture in Camellia japonica L. (Theaceae). Am. J. Bot. 72: 52-65.