Responses to reciprocal recurrent selection and changes in genetic
variability in IG-1 and IG-2 maize populations
Mateus Figueiredo Santos, Gustavo Vitti Moro, Aurélio Mendes Aguiar and Cláudio Lopes de Souza Jr.
Universidade de São Paulo, Escola Superior de Agricultura “Luiz de Queiroz”,
Departamento de Genética, Piracicaba, SP, Brazil.
Abstract
This paper reports the effects of three cycles of reciprocal recurrent selection (RRS) on the means, genetic vari-ances, and on the genetic correlations for several traits in the IG-1 and IG-2 maize (Zea maysL.) populations. Interpopulation full-sib progenies from cycle zero (C0) and from cycle 3 (C3) of RRS were evaluated in two locations.
RRS was highly effective to improve the traits according the objectives of the program: grain yield and prolificacy in-creased significantly, while plant height, ear height, and ear placement dein-creased significantly. Genetic variances for all traits decreased significantly from C0to C3, but the genetic correlations did not change consistently across the
cy-cles of selection. The expected responses to the fourth cycle of RRS and the probability of selecting double-crosses from C3that outperform those from C0showed that the decreases in the genetic variances were not great enough to
limit the continued improvement of the populations as well as the use of the improved populations as sources of in-bred lines to develop commercial hybrids. However, if the magnitudes of the genetic variances continue to decrease, new sources of improved germplasm should be incorporated into both populations to allow the continued improve-ment of the interpopulation by RRS.
Key words:maize, responses to selection, genetic variances, genetic correlations.
Received: July 2, 2004; Accepted: March 23, 2005.
Introduction
Reciprocal recurrent selection (RRS) is a cyclical breeding procedure designed to improve the cross of two populations from different heterotic groups by using both general and specific combining ability. In this procedure, genotypes from two populations are evaluated in reciprocal crosses and the best genotypes of each population are se-lected and recombined to give rise to improved population crosses. Interpopulation half-sib or full-sib progenies are used as evaluation units and intrapopulation S1progenies as
recombination units (Comstocket al., 1949; Hallauer and Eberhart, 1970). Reported results from this breeding proce-dure have shown that RRS has been highly effective to im-prove the population crosses in maize (Zea mays L.) (Hallauer et al., 1988; Eyherabide and Hallauer, 1991; Souza Jr. and Pinto, 2000; Rezende and Souza Jr., 2000). Furthermore, RRS is directly related to the improvement of hybrids from inbred lines (Comstock, 1964; Souza Jr., 2001) and reported results from this procedure have shown that single-crosses developed from advanced cycles of
se-lection presented superior performances, as higher yields and lower lodgings, than those from original non-improved populations (Mollet al., 1977; Russell, 1985; Betrán and Hallauer, 1996).
In RRS breeding programs selection intensity is usu-ally high (10% to 20%), and S1progenies are used as
re-combination units which have low effective population size;i.e., Ne = 1 for each S1progeny. Then, a reduction in
the population sizes will occur, and as a consequence ge-netic drift is expected to take place in the selected popula-tions (Souza Jr.et al., 2000). Hence, because of the joint effects of the selection and of the genetic drift, the genetic variability of the traits being selected could be reduced after some cycles of selection and, consequently, the selection response could also be reduced to such a level that the se-lected populations become unfeasible as source popula-tions for the development of commercial hybrids (Souza Jr., 1999; Souza Jr., 2001). Estimates of genetic variances for several traits, including grain yield, have not been sig-nificantly reduced in either long-term RRS programs (Stucker and Hallauer, 1992; Schnicker and Lamkey, 1993; Holthaus and Lamkey, 1995) or in short-term RRS pro-grams where selection intensity was greater than 10% (Bernardo, 1996; Rezende and Souza Jr., 2000). However,
www.sbg.org.br
Send correspondence to Cláudio Lopes de Souza Jr. Universidade de São Paulo, Escola Superior de Agricultura “Luiz de Queiroz”, Departamento de Genética, Caixa Postal 83, 13.400-970 Piraci-caba, SP, Brazil. E-mail: [email protected].
molecular marker studies in the populations submitted to RRS showed that there were significant losses and/or fixa-tion of alleles because of genetic drift effects (Labateet al., 1997; Pintoet al., 2003a; Pintoet al.,2003b), and signifi-cant genetic drift effects on the means of several traits in maize populations undergoing RRS programs have also been reported (Smith, 1983; Helms et al., 1989; Keeratinijakal and Lamkey, 1993).
Since RRS is a long-term breeding procedure, the maintenance of the genetic variability during the cycles of selection is necessary to ensure adequate magnitudes of se-lection responses for several cycles. Hence, the responses to selection and the magnitudes of the genetic variances of the traits under selection should be evaluated periodically. The objectives of this paper were to report the responses to selection, the changes in genetic variances, and in the ge-netic correlations for several traits after three cycles of RRS in the IG-1 and IG-2 maize populations.
Material and Methods
Germplasm and selection procedures
The IG-1 and IG-2 maize populations used in this study are early-maturing with orange flint and yellow dent kernels, respectively, and they were released by the maize breeding program of the Department of Genetics, Escola Superior de Agricultura “Luiz de Queiroz”, São Paulo Uni-versity (ESALQ/USP), Piracicaba, São Paulo, Brazil. Po-pulation IG-1 was developed by crossing the poPo-pulations EPB-5 and BR-105 and subsequently this cross was crossed to an elite single-cross HS-1,i.e.[EPB-5 x BR-105] x HS-1. Population IG-2 was developed by crossing the populations EPB-4 and BR-106 and subsequently this cross was crossed to an elite single-cross HS-2, i.e. [EPB-4 x BR-106] x HS-2. Thus, the germplasm of IG-1 and IG-2 populations comprised 50% of elite single-crosses plus 25% of each one of two populations. Single-crosses HS-1 and HS-2, the parents of the double-cross BR-201, and BR-105 and BR-106 populations were released by EM-BRAPA/Milho e Sorgo, while EPB-4 and EPB-5 popula-tions were released by the Department of Genetics, ESALQ/USP. All materials used to develop the IG-1 and IG-2 populations were from tropical germplasm (Rezende and Souza Jr., 2000; Souza Jr. and Pinto, 2000).
In the agricultural season of 1989/1990 a RRS pro-gram with the IG-1 and IG-2 maize populations was initi-ated using interpopulation half-sib progenies as evaluation units and S1 progenies as recombination units.
Two-thousand plants from each population were grown in con-tiguous blocks in a stand of 62,500 plants ha-1at the Experi-mental Station of the Department of Genetics in Piracicaba, SP, Brazil (22°42’ S, 47°38’ W). In both populations the lower ears were selfed and the upper ears were crossed with a pollen mixture from the opposite population. Then, from each plant an S1and an interpopulation half-sib progeny
were obtained. The plants that gave rise to the progenies were selected for lower plant and ear heights during the pollinations and only erect plants were harvested. Two-hundred pairs of progenies were obtained from each popu-lation. In the following agricultural season (1990/1991) the interpopulation half-sib progenies were evaluated at three locations near the city of Piracicaba (Experimental Stations of Caterpillar, Areão, and Department of Genetics) with two replications per location. Each set of one-hundred progenies were allocated in a 10 x 10 lattice design, and two commercial hybrids were also allocated at the beginning and at the end of each replication out of the lattice design as checks in each lattice. Plots were one-row 4 m long spaced 0.8 m between rows. All plots were overplanted and thinned to 20 plants per row (62,500 plants ha-1). Data for grain yield, plant and ear heights, and stalk and root lodging were recorded. Grain yield was adjusted to 15.5% grain moisture and corrected to the average stand of the experi-ments. After statistical analyses the mean of the traits eval-uated of each progeny was expressed as a percentage of the checks mean in each lattice, i.e., YPi% = (YPi/YCh).100,
where YPiand YChare the means of the ithprogeny and of
the checks, respectively. The two-hundred progenies of each population were then compared for selection and twenty progenies from each population were selected (10% selection intensity) based mainly on grain yield and root and stalk lodging; interpopulation progenies with above av-erage plant and ear heights were discarded. In the next sea-son (1991/1992) the S1progenies from the plants that gave
rise to the selected interpopulation half-sib progenies from each population were recombined to give rise to the IG-1 cycle 1 and IG-2 cycle 1. Two further cycles of RRS (C2
1992/1993 to 1994/1995; and C31995/1996 to 1997/1998)
were carried out at the same locations using the same proce-dures.
Experimental procedures
In the breeding nursery of the agricultural season of 1998/1999, 400 plants of each population were grown in contiguous plots to develop interpopulation full-sib proge-nies from cycle zero (C0) and from cycle three (C3) using
random S0plants. Reciprocal crosses were not made;
popu-lations IG-2 C0and IG-2 C3were used as females, and IG-1
C0and IG-1 C3as males in the crosses, and each plant were
used once as male. From each cross (IG-1C0x IG-2C0and
IG-1C3x IG-2C3) 300 plants were pollinated. After harvest,
200 interpopulation progenies with enough seeds for evalu-ation were randomly taken from each selection cycle. The 400 progenies were allocated in four 10x10 lattices experi-ments, with 50 progenies from C0and 50 progenies from C3
long spaced 0.8 m between plots. Plots were overplanted and thinned to 20 plants plot-1 (62,500 plants ha-1). Data were recorded for grain yield (g plant-1), plant and ear heights (cm plant-1), stand (plants plot-1), grain moisture (%), lodging as stalk lodging plus root lodging (plants ha-1), and number of ears per plot. Plant and ear heights were re-corded in five competitive plants per plot, from the ground level to the collar of the flag leaf and to the uppermost ear node, respectively; and the plot means were used for analy-sis. Ear placement was computed per plot by the ratio mean ear height/mean plant height; prolificacy was computed per plot by the ratio number of ears per plot/stand; and lodging was transformed by (x + 0.5)1/2, and x stand for the number of lodged plants per plot. Grain yield, prolificacy, and lodg-ing were adjusted for average stand by covariance analyses, and grain yield was also adjusted to grain moisture of 15%.
Statistical analyses
Analyses of variance for each trait and covariance for pairs of traits were performed sequentially: for each experi-ment at each location, joint analyses across locations for each experiment and, finally, the analyses of variances were pooled across experiments and locations. The sum of squares and the sum of products of entries were partitioned into C0progenies, C3progenies, and the contrast C0x C3;
the entries x location sum of squares and sum of products were partitioned accordingly. Progenies and locations were considered as random effects and the contrast C0x C3was
considered as a fixed effect. The progenies x location inter-action mean squares were used as errors in theFtests for progenies, whereas for the contrast C0x C3the error mean
squares were used in the denominator for theFtests. The pooled analyses of variance were used to estimate the com-ponents of genetic variances and covariances using the method of moments (Searle et al., 1992), i.e., the mean squares were equated to their respective expectations and the estimates of variance for each cycle of selection were computed as follows:s$P2 =(MSP -MSPL) /RL
as the vari-ance among interpopulation full-sib progenies;
$ ( ) /
sPL2 = MSPL-MSE R
as the variance of the interaction progeniesvs.locations; ands$Ph2 =MSP /RL
as the pheno-typic variance on a progeny-mean basis. In these expres-sions, MSP, MSPL, MSE, refer to the mean squares of
progenies, progeny by location interaction, and error;Rand
Lrefer to the number of replications and locations, respec-tively. Estimates of the heritability coefficients on a prog-eny-mean basis were computed ash$ $P / $Ph
2 2 2
= s s ; estimates of the expected response to truncated selection as
RS(12) i($P /$Ph)
2 2
= s s where i is the standardized selection differential, and a 20% selection intensity (i= 1.4) were used in all instances, and the expected means for the fourth cycle (mC4) of selection asmC4=mC3+RS(12), wheremC3is the
mean of the third selection cycle (Falconer and Mackay, 1996). Notice that becauses$P2 refers to the genetic variance of interpopulation full-sib progenies, which equals the
ge-netic variance of the double-cross hybrids from inbred lines (Souza Jr.,1992), the heritability coefficients, the responses to selection, and the expected means for the fourth cycle did not refer to the population cross but to the double-cross hy-brids from inbred lines. Confidence intervals at the 0.95 probability level were estimated for the estimates of genetic variances and heritability coefficients following the proce-dures of Burdick and Graybill (1992). The genetic cova-riance between traits (x,y) were estimated from the covariance analyses asCov$ =(MPP -MPPL) /RL, in which MPPandMPPLrefer to mean products of the progenies and
of the interaction progenies by location, respectively, and the genetic correlations between traits (x and y) were esti-mated asrG xy( ) =Cov$ P xy( ) /s s$Px$Py, wheres$P (xory) refers
to the square root of the genetic variance of progenies for traits x and y (Falconer and Mackay, 1996). The probabili-ties of selecting double-cross hybrids (interpopulation full-sib progenies) with means higher than or lower than the mean of the C3plus one and a half times (X1) and twice (X2)
the phenotypic standard deviation of the C3
(X1= XC3±1.5sPhC3andX2= XC3±2sPhC3) were computed
for C0and C3using the properties of the normal distribution
as follows: the means of all traits for both selection cycles were standardized,i.e.,ZCi= (Xi-XCi)/sPhCi, whereXirefers
toX1orX2, andXCiandsPhCiare the means and the standard
phenotypic deviations, respectively, from C0 or C3, and
then the probabilities were obtained from the normal distri-bution table that gives the proportion of the normal curve that lies beyondX1andX2,i.e.,P(X ³Xi) =P(Z³Zi) or
P(X£Xi) =P(Z£Zi) (Zar, 1999).
Realized responses to selection per cycle in the interpopulation were computed as (XC3-XC0)/3 in actual
units, and multiplied by 100 to express them as a percent-age; XC3and XC0stand for the means of the traits evaluated
at cycle three and at cycle zero, respectively. Distributions of the traits of the interpopulation full-sib progenies from both cycles of selection were tested for normality (Wtest), skewness and kurtosis following the procedures described by Zar (1999).
Results and Discussion
Highly significant differences (p £ 0.01) were de-tected in the pooled analyses of variances for locations and for interpopulation full-sib progenies, but the progeny by location interactions were not significant for all traits eval-uated. Thus, genetic variation among progenies was de-tected, and the performances of the progenies did not differ across locations, although the difference between locations was highly significant. Highly significant differences were also detected for the C0progenies and for the C3progenies,
and the interactions C0x location and C3x location were not
significant for any trait, except for lodging from C0,
progenies from both selection cycles were consistent across locations, except for lodging from C0. The contrasts C0vs.
C3were highly significant for all traits, except for lodging,
indicating that there were significant changes in the means of the traits from C0to C3.Also, the contrasts by
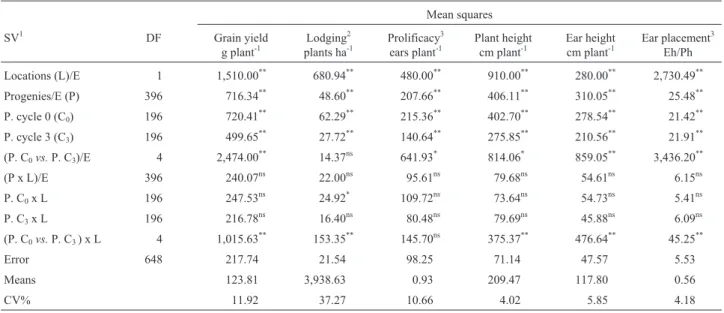
environ-ment interactions were highly significant for all traits, ex-cept for prolificacy, which indicated that the responses to selection differed significantly between locations. Average grain yield was 123.81 g plant-1(7.74 ton ha-1), and the co-efficient of experimental variation was 11.92% (Table 1).
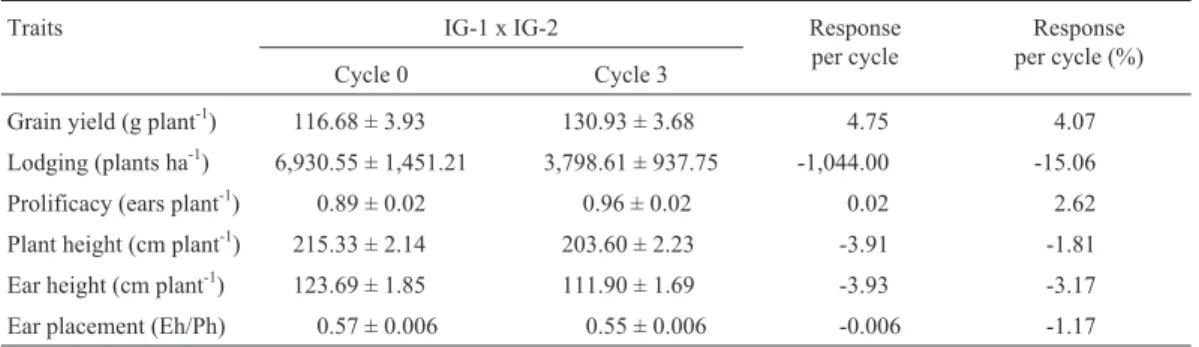
The reciprocal recurrent selection was effective;i.e., the means of the traits evaluated changed according to the objectives of the breeding program. Grain yield and prolificacy increased significantly; and plant height, ear height, and ear placement decreased significantly. Al-though the analysis of variance did not detect significant changes, there was a high decrease in lodging. Grain yield increased 890.63 kg ha-1(14.25 g plant-1) and prolificacy increased 4,375 ears ha-1(0.07 ears plant-1) after the three cycles of selection, which correspond to 296.88 kg ha-1 cy-cle-1(4.07% cycle-1) and 1,458.33 ears ha-1cycle-1or 0.02 ears plant cycle-1 (2.62% cycle-1), respectively. Plant height, ear height, and ear placement decreased 11.73 cm plant-1, 11.79 cm plant-1, and 0.02 after the three cycles of selection, which correspond to -3.91 cm plant-1 cycle-1 (-1.81% cycle-1), -3.93 cm plant-1cycle-1(3.17% cycle-1), and to -6.66 10-3 (-1.17% cycle-1), respectively. Lodging decreased 3,131.94 plants ha-1after the three cycles; i.e., -1,044 plants ha-1cycle-1(-15.06% cycle-1) (Table 2). The response to selection for grain yield per cycle was lower than those reported by Schnicker and Lamkey (1993) (6.46% cycle-1), Keeratinajakal and Lamkey (1993) (6.95% cycle-1), and by Souza Jr. and Pinto (2000) (7.20% cycle-1), and greater than those reported by Paterniani and
Vencovsky (1978) (3.50% cycle-1); for lodging the re-sponse to selection was greater than those reported by Schnicker and Lamkey (1993) (-1.85% cycle-1) and by Souza Jr. and Pinto (2000)(-13.50% cycle-1); also, for plant and ear heights the responses to selection per cycle were greater than those reported by Schnicker and Lamkey (1993) and by Souza Jr. and Pinto (2000). Hence, the per-formance of the cross IG-1 x IG-2 was improved signifi-cantly after three cycles of selection, indicating that the frequency of favorable complementary alleles in the recip-rocal populations increased following the cycles of selec-tion. The means of the traits of an interpopulation correspond to the means of the traits of the interpopulation single-crosses from inbred lines randomly developed from the two populations (Souza Jr., 2001), and then one could expect that the single-crosses selected from C3will present
better performance than those ones selected from C0.
The distribution of the means of the interpopulation full-sib progenies from C0and from C3remained normal
(W test nonsignificant), and skewness and kurtosis tests were also non-significant for all traits, except for lodging in C3. Thus, three cycles of RRS did not change the normality
of the distributions of the interpopulation full-sib proge-nies. Similar results for grain yield, plant height, and ear height have been reported by Schnicker and Lamkey (1993) and Rezende and Souza Jr. (2000).
Estimates of interpopulation full-sib genetic varian-ces and estimates of the heritability coefficients differed significantly (p£0.05) from zero for both C0and C3. The
estimates of genetic variance of all traits from C3were
sig-nificantly lower than those from C0, except for ear
place-ment that did not differ. From C0 to C3genetic variance
decreased 40.18% for grain yield, 69.70% for lodging,
Table 1- Values and significances of the mean squares from the joint analyses of variances for several traits.
Mean squares
SV1 DF Grain yield
g plant-1
Lodging2
plants ha-1
Prolificacy3
ears plant-1
Plant height cm plant-1
Ear height cm plant-1
Ear placement3
Eh/Ph
Locations (L)/E 1 1,510.00** 680.94** 480.00** 910.00** 280.00** 2,730.49**
Progenies/E (P) 396 716.34** 48.60** 207.66** 406.11** 310.05** 25.48**
P. cycle 0 (C0) 196 720.41** 62.29** 215.36** 402.70** 278.54** 21.42**
P. cycle 3 (C3) 196 499.65** 27.72** 140.64** 275.85** 210.56** 21.91**
(P. C0vs.P. C3)/E 4 2,474.00** 14.37ns 641.93* 814.06* 859.05** 3,436.20**
(P x L)/E 396 240.07ns 22.00ns 95.61ns 79.68ns 54.61ns 6.15ns
P. C0x L 196 247.53ns 24.92* 109.72ns 73.64ns 54.73ns 5.41ns
P. C3x L 196 216.78ns 16.40ns 80.48ns 79.69ns 45.88ns 6.09ns
(P. C0vs.P. C3) x L 4 1,015.63 **
153.35** 145.70ns 375.37** 476.64** 45.25**
Error 648 217.74 21.54 98.25 71.14 47.57 5.53
Means 123.81 3,938.63 0.93 209.47 117.80 0.56
CV% 11.92 37.27 10.66 4.02 5.85 4.18
1
43.08% for prolificacy, 40.38% for plant height, and 26.41% for ear height, under RRS (Table 3). These results differ from those reported either for long-term (Stucker and Hallauer, 1992; Schnicker and Lamkey, 1993; Holthaus and Lamkey, 1995) or for short-term high-intensity selec-tion RRS breeding programs (Bernardo, 1996; Rezende and Souza Jr., 2000) in which the interpopulation genetic variances for several traits remained unchanged after the cycles of RRS. The number of selected progenies per cycle (20) and the type of progeny used for recombination (S1)
re-sulted in a lower effective population number per cycle (Ne = 20 per cycle) in the populations, and after three selec-tion cycles fixaselec-tion and/or loss of alleles are expected to oc-cur because of the genetic drift effects caused by the lower effective sizes of the populations under selection (Labateet al., 1999; Pintoet al., 2003a; Pintoet al.,2003b). Thus, be-cause of the joint effects of selection and of genetic drift one could expect that the genetic variances will reduce
throughout the cycles of selection as was reported in our study.
Estimates of the heritability coefficients differed sig-nificantly (p£0.05) from zero for all traits for both C0and
C3for all traits. Differently from the genetic variances, the
heritability coefficients remained unchanged (p £ 0.05) from C0to C3for all traits, except for plant height and
lodg-ing which decreased 12.97% and 31.93%, respectively. The decreases in the magnitudes of the phenotypic variances from C0to C3were similar to that of the genetic variances,
and as the heritability coefficient is a ratio of these parame-ters, the estimates of the heritability coefficients remained unchanged from C0 to C3 for all traits, except for plant
height and lodging where the decreases in the genetic vari-ances were greater than the decreases in the phenotypic variances leading to the reductions in the heritability coeffi-cients. The expected responses to truncated selection for the fourth cycle of RRS (C4) for each trait was 6.76% for
grain yield, -13.64% for lodging, and 3.67% for prolificacy,
Table 2- Mean values across environments of the interpopulation (IG-1 x IG-2) from original (Cycle 0) and after three cycles (Cycle 3) of reciprocal
recurrent selection, and the responses to selection per cycle in actual units and in percentage for several traits.
Traits IG-1 x IG-2 Response
per cycle
Response per cycle (%)
Cycle 0 Cycle 3
Grain yield (g plant-1) 116.68 ± 3.93 130.93 ± 3.68 4.75 4.07
Lodging (plants ha-1) 6,930.55 ± 1,451.21 3,798.61 ± 937.75 -1,044.00 -15.06
Prolificacy (ears plant-1) 0.89 ± 0.02 0.96 ± 0.02 0.02 2.62
Plant height (cm plant-1) 215.33 ± 2.14 203.60 ± 2.23 -3.91 -1.81
Ear height (cm plant-1) 123.69 ± 1.85 111.90 ± 1.69 -3.93 -3.17
Ear placement (Eh/Ph) 0.57 ± 0.006 0.55 ± 0.006 -0.006 -1.17
Table 3- Estimates of genetic (s$P
2
) and phenotypic (s$PhC
2
) variances, and heritability coefficients (hX2
%) for cycles zero (C0) and three (C3), and expected
responses to selection (RSH(12)%) and expected means (mMH(12)C4) for the fourth cycle of selection for several traits.
Parameters Traits1
Grain yield g plant-1
Lodging3 plants ha-1
Prolificacy2 ears plant-1
Plant height cm plant-1
Ear height cm plant-1
Ear placement2 Eh/Ph
$
sPC0 2
118.22 [88.54;168.66]
9.34 [6.81;14.03]
26.41 [17.76;44.73]
82.26 [65.53;107.59]
55.95 [44.45;73.74]
4.00 [3.13;5.42]
$
sPC3
2 70.71
[50.65;110.06]
2.83 [1.74;5.52]
15.03 [9.41;27.88]
49.04 [37.60;67.46]
41.17 [32.39;54.57]
3.95 [3.05;5.43]
$
sPhC0 2
180.10 15.57 53.84 100.67 69.63 5.35
$
sPhC3
2
124.91 6.93 35.15 68.96 52.64 5.47
hXC0
2
65.63 [54.50;74.05]
59.98 [47.01;69.78]
49.05 [32.53;61.52]
81.71 [75.78;86.19]
80.35 [73.97;85.16]
74.74 [66.55;80.92]
hXC3 2
56.61 [42.54;67.23]
40.83 [21.65;55.32]
42.77 [24.22;56.78]
71.11 [61.74;78.18]
78.20 [71.14;83.54]
72.19 [63.17;79.00]
RSH(12)% 6.76 -13.64 3.67 -4.06 -7.09 -4.30
mMH(12)C4 139.79 3,011.00 1.00 195.33 103.96 0.52
while plant stature will be reduced in -7.09%, -4.06%, and -4.30% for plant height, ear height, and ear placement, re-spectively. Thus, the interpopulation (IG-1 x IG-2) in the fourth cycle of reciprocal recurrent selection (C4) should
have the following means: 8,737.16 kg ha-1 (139.79 g plant-1) for yield, 3,011 plants ha-1 lodged, 1 ear plant-1, 195.33 cm plant-1as plant height, 103.96 cm plant-1as ear height, and an ear placement of 0.52 (Table 3). Although truncated selection was not practiced in breeding programs, these results showed that the magnitudes of the reduction in the genetic variability of the traits evaluated were not great enough to reduce significantly the responses to the follow-ing RRS cycle. However, as there were high decreases in the genetic variances for all traits, they have to be moni-tored in the following selection cycles to circumvent the de-crease in the responses to selection.
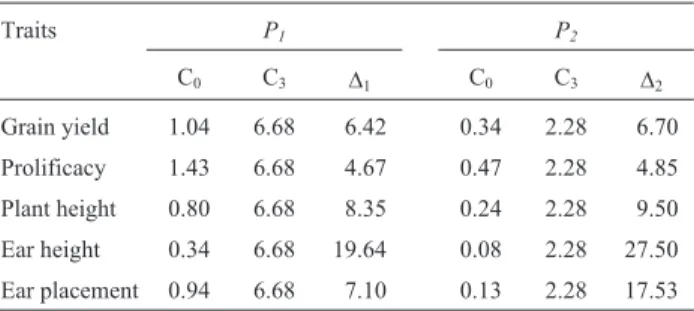
The genetic variance of interpopulation full-sib prog-enies are the same as for double-cross hybrids from inbred lines randomly developed from two populations (Souza Jr., 1992). To assess the effects of RRS on the development of double-crosses, the ratios between the probabilities of the development of double-crosses with performances higher than or lower than the mean of C3cycle ± one and a half
times (D1=P1C3/P1C0) and twice (D2=P2C3/P2C0) the
pheno-typic standard deviation of the C3 cycle were computed.
The results showed that, for grain yield, the probability of selecting double-crosses from C3higher than C3mean plus
one and a half times and twice the phenotypic standard de-viation of C3were 6.42 and 6.70 times, respectively, higher
than those selected from C0. For the other traits these ratios
were 4.67 and 4.85, 8.35 and 9.50, 19.64 and 27.50, and 7.10 and 17.53, for prolificacy, plant height, ear height, and ear placement, respectively. These results showed that the probability of developing outstanding double-crosses from C3is higher than from C0. For instance, from 1,000
dou-ble-crosses (DC) developed from each cycle the expected number of double-crosses with grain yield higher than the C3mean plus twice the phenotypic standard deviation is
only three for the C0cycle but 23 from the C3cycle. As
sev-eral traits should be selected simultaneously, the frequency of double-crosses with all traits beyond these limits will be very low in the C0, and then it is unlikely that the three
pre-dicted higher-yielding DC from C0 would be selected.
Thus, RRS in IG-1 and IG-2 populations was also effective in significantly enhancing the probability of selecting out-standing double-crosses. Although there were significant reductions in the genetic variances of the traits evaluated, these reductions were not great enough to reduce the proba-bility of selecting superior genotypes from C3, and then the
IG-1 and IG-2 populations will be better sources of hybrids from inbred lines at C3than they would be at C0(Table 4).
Information on the magnitudes and signs of the ge-netic correlations between traits are important because sev-eral traits are selected simultaneously in maize breeding programs, and undesirable correlated responses to selection
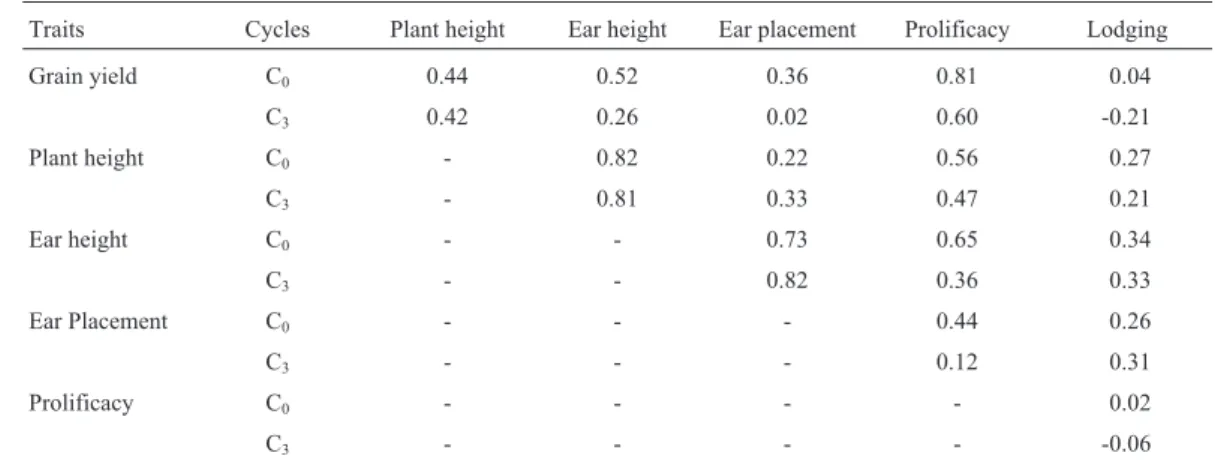
have to be avoided. Then, as for the genetic variances, the changes in the genetic correlations might be monitored dur-ing the selection cycles. There were reductions in the ge-netic correlations between grain yield and the other traits, except for grain yieldvs.plant height, from C0to C3cycles.
The genetic correlation between grain yield and prolificacy in the C3cycle remained high (0.81 in C0and 0.60 in C3),
and it is expected that the selection for prolificacy that is practiced for the production of progenies will continue to provide additional gains for grain yield. However, selection for increase prolificacy will increase plant and ear heights because these three traits are positively correlated, and then, selection to reduce plant and ear heights might con-tinue to be done, mainly during the development of the progenies. The genetic correlations involving lodging and the other traits in both the C0and C3cycles were too low to
be of significance in the breeding program; the correlation between plant and ear height remained unchanged, as well as ear placement with plant and ear heights. Thus, RRS did not affect the genetic correlations consistently,i.e., some correlations increased, some decreased and some remain unchanged (Table 5). Similar results, i.e., inconsistent changes in the genetic correlations between several traits due to the joint effects of selection and genetic drift have previously been reported (Schnicker and Lamkey, 1993; Rezende and Souza Jr., 2000).
The overall results showed that RRS in IG-1 and IG-2 maize populations was highly effective to improve the means of the traits under selection in the interpopulation. Furthermore, the results also suggested that the procedure was highly effective to improve the populations as sources of inbred lines to develop commercial hybrids. The changes in the genetic correlations were not great enough to require alterations in the breeding program. However, the reduc-tions in the interpopulation genetic variances for almost all traits are of concern and should be monitored during the following cycles of selection. If the magnitudes of the ge-netic variances continue to decrease, new sources of im-proved germplasm as elite inbred lines, single-crosses, or populations should be incorporated into both populations to increase the genetic variances of all traits to allow the
con-Table 4- Probabilities (%) of double-crosses superior than the mean of
cycle three plus one and half times (P1) and plus twice (P2) the phenotypic
standard deviation for the original (C0) and after three cycles (C3) of
reciprocal recurrent selection, and the ratiosD= (PC3/PC0).
Traits P1 P2
C0 C3 D1 C0 C3 D2
Grain yield 1.04 6.68 6.42 0.34 2.28 6.70
Prolificacy 1.43 6.68 4.67 0.47 2.28 4.85
Plant height 0.80 6.68 8.35 0.24 2.28 9.50
Ear height 0.34 6.68 19.64 0.08 2.28 27.50
tinued improvement of this interpopulation by reciprocal recurrent selection.
Acknowledgements
The authors are grateful to A.S. Oliveira, C.R. Sega-telli, and A. Silva for technical support with field plot man-agement, and to Dr. L.A. Carlini-Garcia for reviewing the manuscript. This research was financially supported by Conselho Nacional de Desenvolvimento Científico e Tec-nológico (CNPq), Departamento de Genética, ESALQ, USP, and Coordenação de Aperfeiçoamento de Pessoal de Nível Superior (CAPES/PROAP). C.L. Souza Jr is recipi-ent of a research fellowship from CNPq; M.F. Santos and A.M. Aguiar received fellowships from CNPq and CAPES, respectively.
References
Bernardo R (1996) Testcross selection prior to further inbreeding in maize: Mean performance and realized genetic variance. Crop Science 36:867-871.
Betrán FJ and Hallauer AR (1996) Hybrid improvement after re-ciprocal recurrent selection in BSSS and BSCB1 maize pop-ulations. Maydica 41:25-33.
Burdick RK and Graybill FA (1992) Confidence Intervals on Variance Components. M. Dekker, New York, 211 pp. Comstock RE, Robinson HF and Harvey PH (1949) A breeding
procedure designed to make maximum use of both general and specific combining ability. Journal of American Society of Agronomy 41:360-367.
Comstock RE (1964) Selection procedures in corn improvement. Proceedings of the Annual Corn & Sorghum Industry Re-search Conference 19:87-94.
Eyherabide GH and Hallauer AR (1991) Reciprocal full-sib recur-rent selection in maize. I. Direct and correlated responses. Crop Science 31:952-959.
Falconer DS and Mackay TFC (1996) Introduction to Quantita-tive Genetics. Longman Group Ltd., London, 464 pp. Hallauer AR and Eberhart SA (1970) Reciprocal full-sib
selec-tion. Crop Science 10:315-316.
Hallauer AR, Russell WA and Lamkey KR (1988) Corn breding. In: Sprague GF and Dudley JW (eds) Corn and Corn
Im-provement. American Society of Agronomy, Madison, pp 463-564.
Helms TC, Hallauer AR and Smith OS (1989) Genetic drift and selection evaluated from recurrent selection programs in maize. Crop Science 29:602-607.
Holthaus JF and Lamkey KR (1995) Population means and ge-netic variances in selected and unselected Iowa Stiff Stalk maize populations. Crop Science 35:1581-1589.
Keeratinijakal V and Lamkey KR (1993) Genetic effects associ-ated with reciprocal recurrent selection in BSSS and BSCB1 maize populations. Crop Science 33:78-82.
Labate JA, Lamkey KR and Woodman WL (1997) Molecular ge-netic diversity after reciprocal recurrent selection in BSSS and BSCB1 maize populations. Crop Science 37:416-423. Moll RH, Bari A and Stuber CW (1977) Frequency distribution of
maize yield before and after reciprocal recurrent selection. Crop Science 17:794-796.
Paterniani E and Vencovsky R (1978) Reciprocal recurrent selec-tion based on half-sib progenies and prolific plants in maize. Maydica 23:209-219.
Pinto LR, Vieira MLC, Souza Jr. CL and Souza AP (2003a) Ge-netic-diversity assessed by microsatellites in tropical popu-lations submitted to a high-intensity reciprocal recurrent selection. Euphytica 134:277-286.
Pinto LR, Vieira MLC, Souza Jr. CL and Souza AP (2003b) Re-ciprocal recurrent selection effects on the genetic structure of tropical maize populations assessed at microsatellite loci. Genetics and Molecular Biology 26:355-364.
Rezende GSP and Souza Jr. CL (2000) A reciprocal recurrent se-lection procedure outlined to integrate hybrid breeding pro-grams in maize. Journal of Genetics & Breeding 54:57-66. Russell WA (1985) Comparison of the hybrid performance of
maize lines developed from the original and improved cy-cles of BSSS. Maydica 30:407-419.
Schnicker BJ and Lamkey KR (1993) Interpopulation genetic variance after reciprocal recurrent selection in BSSS and BSCB1 maize populations. Crop Science 33:90-95. Searle SR, Casella G and MacCullock (1992) Variance
Compo-nents. John Wiley & Sons, New York, 501 pp.
Smith OS (1983) Evaluation of recurrent selection in BSSS, BSCB1 and BS13 maize populations. Crop Science 23:35-40.
Table 5- Estimates of the genetic correlations between traits for original (C0) and after three cycles (C3) of reciprocal recurrent selection.
Traits Cycles Plant height Ear height Ear placement Prolificacy Lodging
Grain yield C0 0.44 0.52 0.36 0.81 0.04
C3 0.42 0.26 0.02 0.60 -0.21
Plant height C0 - 0.82 0.22 0.56 0.27
C3 - 0.81 0.33 0.47 0.21
Ear height C0 - - 0.73 0.65 0.34
C3 - - 0.82 0.36 0.33
Ear Placement C0 - - - 0.44 0.26
C3 - - - 0.12 0.31
Prolificacy C0 - - - - 0.02
Souza Jr. CL (1992) Interpopulation genetic variances and hybrid breeding programs. Brazilian Journal of Genetics 15:643-656.
Souza Jr. CL (1999) Recurrent selection and heterosis. In: Coors JG and Pandey S (eds) The Genetics and Exploitation of Heterosis in Crops. American Society of Agronomy Inc., Madison, pp 247-255.
Souza Jr. CL and Pinto RMC (2000) Responses to a short-term re-ciprocal recurrent selection procedure in maize. Maydica 45:21-28.
Souza Jr. CL, Geraldi IO and R Vencovsky (2000) Response to re-current selection under small effective population size. Ge-netics and Molecular Biology 23:841-846.
Souza Jr. CL (2001) Melhoramento de espécies alógamas. In: Nass L, Valois ACC, Melo IS and Valadares-Inglis MC (eds) Recursos Genéticos & Melhoramento. Fundação MT, Rondonópolis, pp 159-199.
Stucker DS and Hallauer AR (1992) Genetic variability as af-fected by selection in Iowa stiff stalk synthetic maize. Jour-nal of Heredity 83:410-418.
Zar JH (1999) Biostatistical analysis. Prentice Hall, Upper Saddle River, 663 pp.