Using the Fuzzy DEMATEL to Determine
Environmental Performance: A Case of
Printed Circuit Board Industry in Taiwan
Sang-Bing Tsai1,2,3*, Min-Fang Chien4*, Youzhi Xue2,4*, Lei Li5, Xiaodong Jiang6, Quan Chen1, Jie Zhou7*, Lei Wang4*
1Management School, Zhongshan Institute, University of Electronic Science and Technology of China, Guangdong, 528402, China,2China Academy of Corporate Governance, Nankai University, Tianjin, 300071, China,3Law School, Nankai University, Tianjin, 300071, China,4Business School, Nankai University, Tianjin, 300071, China,5College of Management and Economics, Tianjin University, Tianjin, 300072, China,6School of International Business Administration, Shanghai University of Finance & Economics, Shanghai, 200433, China,7College of Tourism and Service Management, Nankai University, Tianjin, 300071, China
*[email protected](LW);[email protected](JZ);[email protected](MC); [email protected](YX);[email protected](ST)
Abstract
The method by which high-technology product manufacturers balance profits and environ-mental performance is of crucial concern for governments and enterprises. To examine the environmental performance of manufacturers, the present study applied Fuzzy-DEMATEL model to examine environmental performance of the PCB industry in Taiwan. Fuzzy theory was employed to examine the environmental performance criteria of manufacturers and analyse fuzzy linguistics. The fuzzy-DEMATEL model was then employed to assess the direction and level of interaction between environmental performance criteria. The core en-vironmental performance criteria which were critical for enhancing enen-vironmental perfor-mance of the PCB industry in Taiwan were identified and presented. The present study revealed that green design (a1), green material procurement (a2), and energy consumption (b3) constitute crucial reason criteria, the core criteria influencing other criteria, and the driv-ing factors for resolvdriv-ing problems.
Introduction
In recent years, increased international environmental awareness and the prevalence of green consumption concepts have gradually elevated the expectations of the public regarding corpo-rate environmental performance. [1] These enterprises that endeavour to enhance their overall green competitiveness must resolve problems involving green production (GP) and green sup-ply chains (GSCs) [2].
To measure corporate environmental performance, the GP and GSC dimensions of an en-terprise must be consolidated, discussed, and compared [3]. The United Nations
OPEN ACCESS
Citation:Tsai S-B, Chien M-F, Xue Y, Li L, Jiang X, Chen Q, et al. (2015) Using the Fuzzy DEMATEL to Determine Environmental Performance: A Case of Printed Circuit Board Industry in Taiwan. PLoS ONE 10(6): e0129153. doi:10.1371/journal.pone.0129153
Academic Editor:Yong Deng, Southwest University, CHINA
Received:September 16, 2014
Accepted:May 5, 2015
Published:June 8, 2015
Copyright:© 2015 Tsai et al. This is an open access article distributed under the terms of theCreative Commons Attribution License, which permits unrestricted use, distribution, and reproduction in any medium, provided the original author and source are credited.
Data Availability Statement:All relevant data are within the paper (Tables1–7, Figs1–2).
Environmental Program defined the term green production as“the continuous application of an integrated environmental strategy to processes, products, and services to increase efficiency and reduce hazards to humans and the environment”[4].
GP entails encouraging pollution prevention and emphasising the responsibilities of manu-facturers in achieving or maximizing ecological benefits and sustainable development. [3] Green supply chains prompt suppliers to incorporate environmental principles into supply management mechanisms by integrating and collectively considering factors related to product and environmental management. The GSCs are employed to incorporate environmental pro-tection concepts into products and enhance market competitiveness.
Winn and Roome [5] defined corporate environmental performance management as the ac-tions that enterprises adopt in response to the direct and indirect impact that their products, processes, and organisations have on natural ecosystems. Oliver and Abhishek [6] stated that corporate environmental performance management is based on sustainable development and product life cycles. It is defined such management as the incorporation of environmental ideas into enterprise operating philosophies and commitments to internally and externally convey environmental protection concepts.
When implementing corporate environmental performance management, enterprises are able to identify potential impacts that they may exert on the environment and at the same time apply prevention measures. These enterprises integrate environmental objectives and de-partmental functions in order to implement comprehensive quality control and innovative en-vironmental technologies [7]. This could enhance the corporate image and enable legal penalties to be avoided and to create new business opportunities [4].
In an effective corporate green management system, the entire enterprise emphasises envi-ronmental management, complies with envienvi-ronmental regulations, promotes organisation greenification, minimises resource consumption, reduces pollution, and appropriately manages waste [7].
These aspects show how important it is for enterprises to improve their environmental per-formances, especially those in the PCB industry. The printed circuit board (PCB) industry is a capital-intensive and high-technology industry that requires high levels of energy consumption and emits a great amount of pollution. Its manufacturing process requires large amounts of electricity, water, and chemical solutions, resulting in generation of a substantial amount of waste [8]. The methods by which high-tech companies balance profits and environmental per-formance are crucial concerns for governments and enterprises.
The PCB industry in Taiwan was used as a case in the present study to examine mental performance criteria and to determine which ones were critical for improving environ-mental performance of the PCB industry in Taiwan.
Printed circuit boards (PCBs) are manufactured using numerous high-end technologies such as printing, etching, electroplating, and drilling technologies. Manufacturing PCBs is complex and requires a wide range chemicals, and thus produces gaseous, liquid, and solid wastes. In addition to numerous organic pollutants, the waste generated in the PCB industry includes heavy metals (i.e., copper, lead, and nickel), which are potently toxic to the environ-ment. Without appropriate pollution prevention mechanisms, these wastes inevitably cause severe environmental harm. Therefore, governments and enterprises have consistently empha-sised methods for reducing the overall environmental pollution of entire PCB manufacturing chains.
Taiwan is a global leader in PCB manufacturing and is ranked third worldwide in output value. Regarding technology, Taiwan ranks second worldwide, inferior only to Japan, suggest-ing that the PCB industry in Taiwan has a strong technological advantage. Accordsuggest-ing to the statistics published by the Taiwan Printed Circuit Association, global PCB output in 2012 was
US$59.79 billion; of this value, China accounted for US$25.52 billion, representing a global oc-cupancy of 42.7%, followed by Japan (14.4%) and Taiwan (13.4%). The PCBs manufactured in Japan and Taiwan are typically incorporated into high-value products.
The paper is the first, based on prior studies model knowledge, to implement the Fuzzy-DEMATEL model to examine the environmental management performance in the PCB indus-try in Taiwan. Thus, the contribution of this research is to highlight the environmental perfor-mance of the PCB industry in Taiwan by using the Fuzzy-DEMATEL model.
Literature Review
Green Production and Green Environment Performance
Green production has 2 primary goals. The first goal is to eliminate or reduce waste generation and environmental pollution, which could harm people and the environment. The second goal is to maximize resource utilization and reduce resource depletion by reusing resources and conserving energy, materials and water [4].
GSC management is applied throughout the manufacturing process, from product design to product recycling. Several dimensions, such as green design, green materials, green suppliers, GP, green sales and packaging, green transport, and green recycling, can be analysed to mea-sure the degree to which GSC management is applied [9].
GSC management is a process for innovating conventional supply chains [9]. Both driving and hindering factors influence the establishment of GSCs [10]. The primary factor driving the establishment of GSCs is that enterprises can seek and form alliances to implement GSC in an intensely competitive market. Within a GSC, enterprises can integrate with upstream and downstream enterprises to combine strengths and increase the benefits received by all mem-bers of the supply chain [9].
The primary factor hindering the establishment of GSCs is that, although GSCs can increase the use efficiency of resources and reduce costs to a certain extent, green recycling and waste processing entail considerable costs. These costs may offset benefits and even result in deficits [11].
In GP and GSCs, green design, green material procurement, green manufacturing, green products, green transport, green packaging, and green recycling, are the key strategic factors for corporate green management and constitute the essential criteria for analysing corporate environmental performance [12].
Environmental Performance Evaluation and Dimensions
To comply with green performance regulations, enterprises develop independent green pro-duction management systems by using their extant management systems as a framework, in-corporating GP and GSC management into these systems as the problems, and environmental requirements and methods as the tools. These systems enable enterprises to resolve the bottle-necks and difficulties involved in complying with green product requirements and improve the green competitiveness of these enterprises in their respective industries.
establishing suitable performance criteria and continually collecting objective and reliable data [15].
Conrad and Morrison [16] asserted that, because of environmental regulations, enterprises may invest their limited resources into unproductive pollution prevention equipment, thereby could reduce their investment in productive equipment. This reduces the productivity of these enterprises and hinders them from considering environmental performance. However, Carter et al. [17] suggested that, by complying with environmental regulations, enterprises can achieve efficient production and improve environmental performance. Tseng and Lin [18] indicated that the goal of mutual collaboration between suppliers and clients in a supply chain is to re-duce the negative impact that production exerts on the environment and to maintain environ-mental performance. Tseng et al. [19] emphasised that enterprises must establish relationships with more appropriate suppliers and engage in strategic procurement to enhance environmen-tal performance. Ahi and Searcy [9] mentioned that several dimensions, namely green design, green material procurement, green manufacturing, green products, green transport, green packaging, and green recycling which significantly influence environmental performance. Zhu et al. [20] indicated that increased environmental performance stimulates the operating perfor-mance and increases the market share of enterprises.
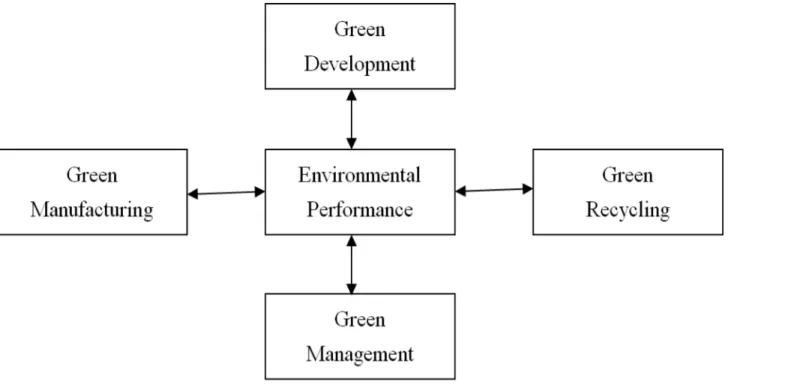
Based on the aforementioned discussion regarding GP, GSC management and EPE, envi-ronmental performance measurement systems were categorised into 4 major dimensions for analysis, specifically, green development, green manufacturing, green management, and green recycling, as shown inFig 1.
Green Development. Green development comprises green design and green procurement. Prior to manufacturing, products are conceptually developed in the planning and design stage. Green products that can be manufactured without violating environmental performance re-quirements are created through green design. Chu et al. [21] suggested that, in the design of
Fig 1. Environmental performance evaluation system.
product life cycle processes, green design should be coordinated with procurement to ensure that product and environmental optimisation are interdependently achieved. All components constituting a product must be carefully inspected during the design stage and all suppliers must ensure that toxic substances are eliminated during manufacturing.
Green procurement involves implementing green concepts when selecting and purchasing raw materials from a supplier. In GSCs, suppliers provide green materials to enable manufac-turers to improve their environmental performance [22].
Green Manufacturing. Green manufacturing refers to enterprises’attempts to reduce air and water pollution during their manufacturing processes as well as production, waste, pollu-tion and energy consumppollu-tion. Green manufacturing is the goal that it is minimal impact on the environment, the highest resource efficiency.
Green Management. Green management includes green marketing, green corporate image development and green transport. Green marketing emphasises the propagation tools used in conventional marketing, such as promotional activities, advertising, sales representa-tives, discount sales, public relations and direct marketing. It also involves conveying green messages through products sold to consumers, thereby creating a favourable green corporate image. Tsai and Xue [23] asserted that the primary goal of green marketing is to raise customer awareness towards the influences that environmental deterioration exert on quality of life and, thus, motivating these customers to purchase green products and establish a fundamental un-derstanding towards environmental performance.
The purpose of green transport is to enhance customer satisfaction, achieve centralised dis-tribution, reduce resource consumption and plan effective traffic routes. Green transport en-tails the demand of manufacturers for green products/raw materials with the supply of those products or raw materials by suppliers and effectively managing delivery services [21].
Green Recycling. Green recycling comprises green packaging and product recycling [22]. Typically, consumers discard products once they become unusable. Enterprises can enhance their green performance by guiding consumers to reuse or recycle products through product design and packaging[23]. Green packaging minimises the production of waste once products are discarded, and product recycling promotes the reuse and renewal of products. Both green packaging and product recycling can reduce the burden imposed on the environment.
DEMATEL Model
The DEMATEL originated from the Natural Sciences and Humanities Research Plan proposed by the Battelle Institute in 1971 [24–25]. During the initial stages of development, the DEMA-TEL was designed to identify intricate problems in the world such as racism, hunger, environ-mental protection, and energy conservation. In that period, the DEMATEL was employed in 3 major research fields, specifically, (1) world problem structures; (2) analysing and developing adaptive methods for resolving intricate world problems and (3) reviewing research and meth-odology data pertaining to world problems [26].
The framework and computation procedures applied in the DEMATEL consist of the fol-lowing steps [29]:
Step 1: Establish measurement scales and determine the direction and degree of influ-ence between factors.This step entails identifying and defining the various influential factors of complex systems by using data obtained from literature reviews, brainstorming, or expert opinions. In addition, a degree of influence scale is designed to perform pairwise comparisons of the factors and determine the causalities and degree of influence between factors.
Step 2: Establish a direct relation matrix.After the significance of the measurement scales is determined, a questionnaire survey method is employed. In this method, experts perform pairwise comparisons of the factors to determine the degree and direction of interactive influ-ence between factors. Consequently, a direct relation matrix is formulated. Each value in this matrix represents the size of an interactive influence between factors. The diagonal values in the matrix are set as 0.
X¼
0 x12 x1n
x21 0 x2n
.. .
.. .
. . .
.. .
xn1 xn2 0 2
6 6 6 6 6 6 4
3
7 7 7 7 7 7 5
ð1Þ
Step 3: Calculate a normalised direct relation matrix, where the column vector and maxi-mum value are the thresholds for normalisation.
l¼ 1
Max
1in
Xn
j¼1 xij
! ð2Þ
N ¼lX ð3Þ
Step 4: Calculate the direct/indirect relation matrix T, which is also called the total relation matrix.
T¼lim k!1ðNþN
2þ þNkÞ ¼NðI NÞ 1
ð4Þ
Step 5: Calculate the sum of the values in each column and each row.This step entails summing the values of each column and row in the total relation matrix, whereDiis the sum of
theithrow andRjis the sum of thejthcolumn. TheDiandRjvalues represent both the direct
and indirect influences between factors.
Di ¼
Xn
j¼1
tij ði¼1;2;. . .;nÞ ð5Þ
Rj¼
Xn
i¼1
tij ðj¼1;2;. . .;nÞ ð6Þ
Step 6: Illustrate the DEMATEL cause and effect diagram.In this step, (D + R) is defined as Prominence andk=i=j= 1, 2,. . ..n, illustrating the overall influential directions of a ser-vice attribute. This value indicates the core level of serser-vice attributekin question. The param-eter (D−R) is defined as relation, illustrating the difference in the influences of this service
a positive value suggests that the attribute is a cause and a negative value suggests that the at-tribute is an effect. In the cause and effect diagram, atat-tributes are plotted on the horizontal axis according to the (D + R) value and on the vertical axis according to the (D−R) value.
By using images, complex causal relationships are simplified into comprehensible visual structures.
Based on the coordinate positions of (Dk+Rk) and (Dk−Rk), attributes can be divided into
the following 4 types:
a. (Dk—Rk) is positive and (Dk+Rk) is large: This indicates that the attributes are causes,
which are also driving factors for solving problems.
b. (Dk—Rk) is positive and (Dk+Rk) is small: This indicates that the attributes are independent
and can influence only a few other attributes.
c. (Dk—Rk) is negative and (Dk+Rk) is large: This indicates that the attributes are the core
problems that must be solved; however these are effect-type attributes, which cannot be directly improved.
d. (Dk—Rk) is negative and (Dk+Rk) is small: This indicates that the attributes are
indepen-dent and can be influenced by only a few other attributes.
Fuzzy Theory
Zadeh, [30] who believed that people’s thought, reasoning, and perceptions of their sur-roundings are relatively vague, proposed fuzzy set theory. Zadeh [30] experienced difficulty in allocating a precise percentile or number to these concepts because of individuality and subjectivity and, therefore, contended that conventional extremely precise quantification methods cannot be used to resolve people-centred or complex problems completely. The concepts of fuzzy set theory are essential to accounting for the uncertainty and fuzziness of realistic environments. Research subjects are allocated a value between 0 and 1 to indicate their fuzzy degree [31]. People’s subjective judgments are converted into numbers. This con-version compensates the defect of conventional sets in describing events by using binary logic. This method enables research results to comply closely with human thought patterns.
The research objective of fuzzy theory, which was developed based on the fuzzy set, is to rec-ognize the phenomenon of vagueness to handle vague and uncertain situations. Fuzzy theory has been employed and it has shown useful results in various fields, such as artificial intelli-gence, automatic control, image recognition, medical diagnosis, psychology, decision support, management science, weather forecasting, and environmental assessment [32]. In the context of fuzzy logic, each number between 0 and 1 is regarded as partially correct. By contrast, crisp set concepts dictate that answers are either 1 or 0. Thus, fuzzy logic enables researchers to pro-cess fuzzy, ambiguous, and imprecise mathematical judgments. The most commonly used fuzzy numbers are triangular fuzzy numbers, trapezoidal fuzzy number, and Gaussian fuzzy numbers.
The fuzzy linguistic function entails converting linguistic wording into fuzzy numbers and then defuzzifying these fuzzy numbers to obtain explicit values [32–33].
Step 1: Standardisation.
rmax
i ¼maxr
i j; l
min
i ¼minl
i j; D
max
min¼minlij
Calculate all programmesaj,j = 1,. . .,J。
xlj ¼ ðlij lmini Þ=D max min
xmj¼ ðmij l min i Þ=D
max min
xrj¼ ðrij lmini Þ=D max min
ð7Þ
Step 2: Calculate the left and right standardised thresholds;j = 1,. . .,J.
Xls
j ¼xmj=1þxmj xlj
Xrs
j ¼xrj=1þxrj xmj
ð8Þ
Step 3: Calculate all explicit values following standardisation;j = 1,. . .,J.
xjcrisp¼ ½xlsjð1 x ls jÞ þx
rs jx
rs j =½1 x
ls j þx
rs
j ð9Þ
Step 4: Calculate explicit values;j = 1,. . .,J.
fij¼l min
i þx
crisp
j D
max
min ð10Þ
Methodology
The major indicators and objectives of environmental performance have been identified through the introduction and the literature review. The present study categorised the environmental performance measurement system into 4 major dimensions and 10 associated criteria, as shown inTable 1.
The Questionnaire
The environmental performance fuzzy-DEMATEL questionnaire comprised 4 dimensions and 10 evaluation criteria. The 4 dimensions were green development, green manufacturing, green management, and green recycling. The 10 evaluation criteria were green design (a1), green ma-terial procurement (a2), air & water Pollution (b1), waste pollution (b2), energy consumption (b3), green marketing (c1), green transport (c2), green image (c3), green packaging (d1), and product recycling (d2).
Table 1. The dimensions and criteria of environmental performance.
Dimensions Criteria
a. Green development a1 green design
a2 green material procurement
b. Green manufacturing b1 air & water pollution
b2 waste pollution b3 energy consumption
c. Green management c1 green marketing
c2 green transport c3 green image
d. Green recycling d1 green packaging
The questionnaires were administered between 12 and 30 May 2014. The questionnaires were primarily administered to a group of experts, who provided their personal opinions re-garding the environmental performance of the PCB industry in Taiwan. During the survey, the ambiguity of the experts’subjective judgments was considered. Thus, a linguistic description method was employed to ensure that the evaluation values of the experts’subjective judgments were expressed properly. Subsequently, each judgment value was expressed as a triangular fuzzy number, which was then placed on a 5-point scale to determine the degree of influence. The influence was ranked as VH, H, L, VL, or NO.
The recipients of the questionnaire were 12 experts, of whom 6 were general managers of PCB enterprises, 3 were academics, and 3 were government officials serving in environmen-tal protection departments. All have more than 15 years of experience in environmenenvironmen-tal and industrial management. After completion of the questionnaires, the relationships among the 10 criteria of the EPE were assessed, namely, pairwise comparisons of the degree of causal and interactive relationships among the criteria. The researchers of the present study per-sonally visited each expert to explain the content of the questionnaire prior to administra-tion. A total of 12 valid questionnaires were retrieved, yielding an effective recovery rate of 100%.
The Fuzzy DEMATEL Model
The fuzzy-DEMATEL model combines the fuzzy linguistic aspect of fuzzy theory with the DEMATEL [36]. Applying the DEMATEL in a fuzzy context enables researchers to analyse the causal relationships of fuzzy variables and determine the level of interactive influence
between variables.
The computation procedures of the fuzzy-DEMATEL model consist of the following steps: [37–38]
Step 1: Develop evaluation standards and design a fuzzy linguistic scale.This step entails substituting conventional measurement scales with a fuzzy linguistic scale to process the ambi-guity of human thought. Based on the concepts of Li and Tzeng [38], the present study used tri-angular fuzzy numbers to determine the degree of interactive influence between variables; (0.0, 0.0, 0.0) numbers denoting no influence (NO), (0, 0.25, 0.5) numbers denoting a very low (VL) influence, (0.25, 0.5, 0.75) numbers denoting a low (L) influence, (0.5, 0.75, 1.0) numbers de-noting a high (H) influence, and (0.75, 1.0, 1.0) numbers dede-noting a very high (VH) influence (Table 2).
Step 2: Compile expert evaluations.To evaluate the relationship between the various cri-teriaC= {Ci|i= 1,2,. . .,n},pexperts are invited to determine the interactive influences
be-tween the criteria by using the fuzzy linguistic scale to conduct pairwise comparisons. Consequently,pfuzzy matrices are obtained (Z~ð1Þ,Z~ð2Þ,. . .,Z~ðpÞ). Fuzzy matrixZ~ðKÞis
Table 2. Fuzzy linguistic comparison chart.
Degree of Influence Score Triangular Fuzzy Number
Very high influence (VH) 4 (0.75, 1.0, 1.0)
High influence (H) 3 (0.5, 0.75 1.0)
Low influence (L) 2 (0.25, 0.5, 0.75)
Very low influence (VL) 1 (0.0, 0.25, 0.5)
No influence (NO) 0 (0.0, 0.0, 0.0)
illustrated as follows:
~ ZðKÞ¼
0 ~zð12kÞ ~z ðkÞ 1n
~
zð21kÞ 0 ~z ðkÞ 2n .. . .. . . . . .. . ~ zðnk1Þ~z
ðkÞ
n2 0 2 6 6 6 6 6 4 3 7 7 7 7 7 5
;k¼1;2; ;p ð11Þ
wherezijðkÞ¼ ðl
ðkÞ
ij ;m
ðKÞ
ij ;u
ðkÞ
ij Þ, and a triangular fuzzy number (0,0,0) was set for (i= 1,2,. . .,n). The termZ~ðKÞrepresents the initial direct relation fuzzy matrix determined by thekthexpert. Step 3: Establish a standardised direct relation fuzzy matrix.Let~aiðkÞdenote a triangular fuzzy number, where
~ aðikÞ ¼
Xn
j¼1 ~ zðijkÞ ¼
Xn
j¼1 lðijkÞ;
Xn
j¼1 mðijkÞ;
Xn
j¼1 uðijkÞ
!
and
rðkÞ ¼max 1in
Xn
j¼1 uðijkÞ
!
Subsequently, through a linear scale conversion, the standardised direct relation fuzzy ma-trix can be expressed as follows:
~ XðkÞ ¼
~ xð11kÞ~x
ðkÞ 21 x~
ðkÞ 1n
~ xð21kÞ~x
ðkÞ 22 x~
ðkÞ 2n .. . .. . . . . .. . ~ xðnk1Þ~x
ðkÞ 22 x~ðnnkÞ
2 6 6 6 6 6 6 4 3 7 7 7 7 7 7 5
;k¼1;2; ;p ð12Þ
wherex~ðijKÞ ¼
~
zðijkÞ rðkÞ ¼
lðijkÞ rðkÞ;
mðijkÞ rðkÞ;
uðijkÞ rðkÞ
. Based on the basic principles of the DEMATEL, (12) must
comply with the assumption thatX n
j¼1
uðijkÞ<rðkÞ. Through basic calculation, the average matrix
Xcan be obtained.
Step 4: Establish a total relation fuzzy matrix.To establish the total relation fuzzy matrix
T, limw!1X~w¼0must first be ensured. The termX~wrepresents the triangular fuzzy matrix,
which can be expressed as follows:
~ XðwÞ¼
~ xð11wÞ~x
ðwÞ 21 ~x
ðwÞ 1n
~ xð21wÞ~x
ðwÞ 22 ~x
ðwÞ 2n .. . .. . . . . .. . ~ xðnw1Þ~x
ðwÞ 22 ~xðnnwÞ
2 6 6 6 6 6 6 4 3 7 7 7 7 7 7 5
; ~xðijwÞ ¼ ðl
ðwÞ
ij ;m
ðwÞ
ij ;u
ðwÞ
Based on the aforementioned Theorem 3.1, the fuzzy matrix can be expanded as follows:
½lijðwÞ ¼
lð11wÞl ðwÞ 12 l
ðwÞ 1n
lð21wÞl ðwÞ 22 l
ðwÞ 2n .. . .. . . . . .. .
lðnw1Þl ðwÞ 22 lðnnwÞ
2 6 6 6 6 6 6 6 6 4 3 7 7 7 7 7 7 7 7 5
½mðijwÞ ¼
mð11wÞm ðwÞ
12 m
ðwÞ 1n
mð21wÞm ðwÞ
22 m
ðwÞ 2n .. . .. . . . . .. .
mðnw1Þm ðwÞ
22 m
ðwÞ
nn 2 6 6 6 6 6 6 6 6 4 3 7 7 7 7 7 7 7 7 5
½uðijwÞ ¼
uð11wÞu ðwÞ 12 u
ðwÞ 1n
uð21wÞu ðwÞ 22 u
ðwÞ 2n .. . .. . . . . .. .
uðnw1Þu ðwÞ 22 uðnnwÞ
2 6 6 6 6 6 6 6 6 4 3 7 7 7 7 7 7 7 7 5
ð13Þ
The 3 matrices are ordered as follows: .½lðijwÞ ¼Xwl;½m
ðwÞ
ij ¼Xmw;½u
ðwÞ
ij ¼Xuw Let limw!1Xw¼O and lim
w!1ðIþXþX2þ þXkÞ ¼ ðI XÞ 1
, whereOis the zero matrix andIis the unit matrix.
~ T ¼ lim
w!1ð ~
XþX~2þ þ~
XkÞ ¼X~ðI X~Þ 1
ð14Þ
Because standardised direct relation fuzzy matrices contain a convergence matrix, the total relation fuzzy matrixTcan be expressed as follows:
~ T ¼ lim
w!1ð ~
XþX~2þ þX~kÞ ¼X~ðI X~Þ 1
Let
~
T ¼
~
t11 ~t12 ~t1n
~
t21 t22 ~t2n
.. . .. . . . . .. .
tn1 tn2 ~tnn
2 6 6 6 6 6 4 3 7 7 7 7 7 5
where,~t
ij¼ ðl 00 ij;m
00 ij;u
00
ijÞ. Therefore,
Matrix½l00ij ¼Xl ðI XlÞ
1
Matrix½m00ij ¼Xm ðI XmÞ
1
Matrix½u00ij ¼Xu ðI XuÞ
1
ð15Þ
Step 5: Illustrate a cause and effect diagram.The results are then illustrated in a cause and effect diagram to determine the causal relationships and interactive influences between the various criteria.
Results and Discussion
Fuzzy DEMATEL Research Results
(1)Designing a fuzzy linguistic scale.. The present study used triangular fuzzy numbers to determine the degree of interactive influence between variables: VH, H, L, VL, or NO. (Table 1).
(2) Collecting expert opinions.. Twelve experts provided their opinions on the relation-ships between the various environmental performance criteria. In addition, the experts per-formed pairwise comparisons to determine the degree of interactive relationships between the criteria. This study used Matlab software to calculate. Based on expert opinions and pairwise
Table 3. Fuzzy relationships between the various environmental performance criteria.
Criteria a1 a2 b1 b2 b3 c1 c2 c3 d1 d2
a1 0 VH L L L H L H VH VH
a2 L 0 L H L L L H H H
b1 VL VL 0 L H H 0 VH VL 0
b2 VL VL L 0 L H 0 VH VL 0
b3 VL VL L VL 0 H VL VH VL 0
c1 0 0 0 0 0 0 L H 0 0
c2 0 0 0 0 L L 0 H 0 0
c3 0 0 0 0 0 H VL 0 0 0
d1 0 0 VL VL VL VL L H 0 H
d2 0 0 VL VL VL VL L H H 0
doi:10.1371/journal.pone.0129153.t003
Table 4. Converting the fuzzy scale into fuzzy numbers.
Criteria a1 a2 b1 b2 b3 c1 c2 c3 d1 d2
a1 0 (0.75, 1.0,
1.0) (0.25, 0.5, 0.75) (0.25, 0.5, 0.75) (0.25, 0.5, 0.75) (0.5, 0.75, 1.0) (0.25, 0.5, 0.75) (0.5, 0.75, 1.0) (0.75, 1.0, 1.0) (0.75, 1.0, 1.0) a2 (0.25, 0.5,
0.75)
0 (0.25, 0.5,
0.75) (0.5, 0.75, 1.0) (0.25, 0.5, 0.75) (0.5, 0.75, 1.0) (0.5, 0.75, 1.0) (0.5, 0.75, 1.0) (0.5, 0.75, 1.0) (0.5, 0.75, 1.0) b1 (0.0, 0.25,
0.5)
(0.0, 0.25, 0.5)
0 (0.25, 0.5,
0.75)
(0.5, 0.75 1.0)
(0.5, 0.75, 1.0)
0 (0.75, 1.0,
1.0)
(0.75, 1.0, 1.0)
0 b2 (0.0, 0.25,
0.5)
(0.0, 0.25, 0.5)
(0.25, 0.5, 0.75)
0 (0.25, 0.5,
0.75)
(0.5, 0.75, 1.0)
0 (0.75, 1.0,
1.0)
(0.75, 1.0, 1.0)
0 b3 (0.0, 0.25,
0.5) (0.0, 0.25, 0.5) (0.25, 0.5, 0.75) (0.0, 0.25, 0.5)
0 (0.5, 0.75,
1.0) (0.0, 0.25, 0.5) (0.75, 1.0, 1.0) (0.75, 1.0, 1.0) 0
c1 0 0 0 0 0 0 (0.25, 0.5,
0.75)
(0.5, 0.75, 1.0)
0 0
c2 0 0 0 0 (0.25, 0.5,
0.75)
(0.25, 0.5, 0.75)
0 (0.5, 0.75,
1.0)
0 0
c3 0 0 0 0 0 (0.5, 0.75
1.0)
(0.0, 0.25, 0.5)
0 0 0
d1 0 0 (0.0, 0.25,
0.5) (0.0, 0.25, 0.5) (0.0, 0.25, 0.5) (0.0, 0.25, 0.5) (0.25, 0.5, 0.75) (0.5, 0.75, 1.0)
0 (0.5, 0.75,
1.0)
d2 0 0 (0.0, 0.25,
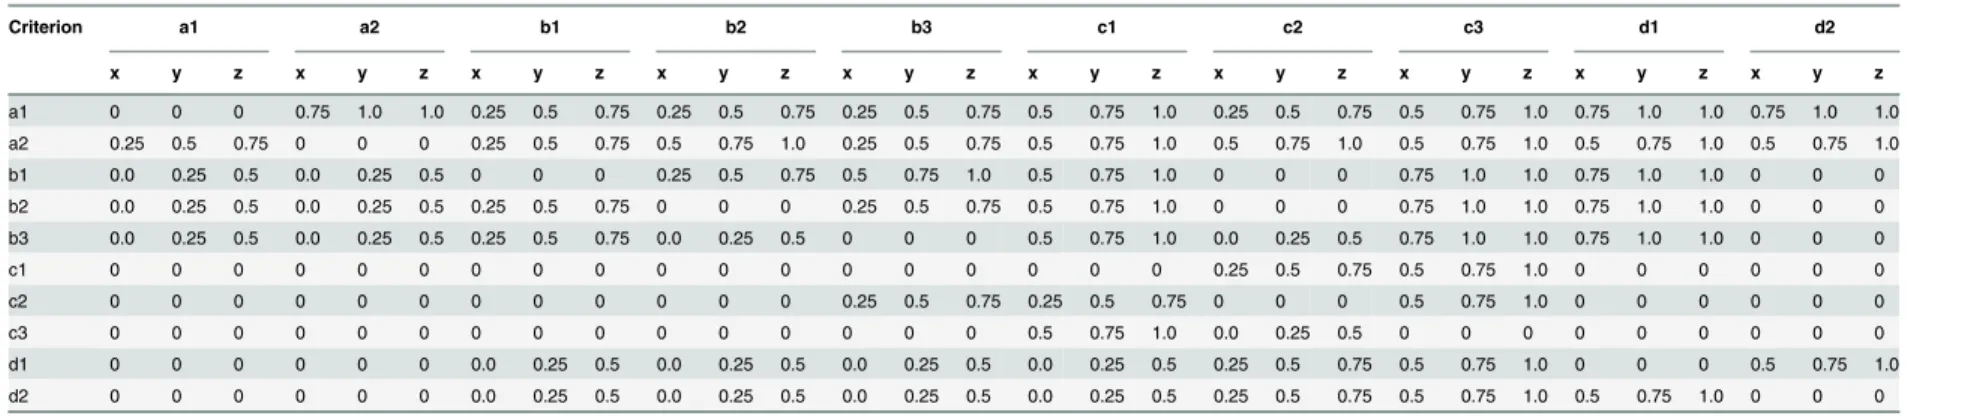
Table 5. Fuzzy direct relation matrices.
Criterion a1 a2 b1 b2 b3 c1 c2 c3 d1 d2
x y z x y z x y z x y z x y z x y z x y z x y z x y z x y z
a1 0 0 0 0.75 1.0 1.0 0.25 0.5 0.75 0.25 0.5 0.75 0.25 0.5 0.75 0.5 0.75 1.0 0.25 0.5 0.75 0.5 0.75 1.0 0.75 1.0 1.0 0.75 1.0 1.0 a2 0.25 0.5 0.75 0 0 0 0.25 0.5 0.75 0.5 0.75 1.0 0.25 0.5 0.75 0.5 0.75 1.0 0.5 0.75 1.0 0.5 0.75 1.0 0.5 0.75 1.0 0.5 0.75 1.0
b1 0.0 0.25 0.5 0.0 0.25 0.5 0 0 0 0.25 0.5 0.75 0.5 0.75 1.0 0.5 0.75 1.0 0 0 0 0.75 1.0 1.0 0.75 1.0 1.0 0 0 0
b2 0.0 0.25 0.5 0.0 0.25 0.5 0.25 0.5 0.75 0 0 0 0.25 0.5 0.75 0.5 0.75 1.0 0 0 0 0.75 1.0 1.0 0.75 1.0 1.0 0 0 0
b3 0.0 0.25 0.5 0.0 0.25 0.5 0.25 0.5 0.75 0.0 0.25 0.5 0 0 0 0.5 0.75 1.0 0.0 0.25 0.5 0.75 1.0 1.0 0.75 1.0 1.0 0 0 0 c1 0 0 0 0 0 0 0 0 0 0 0 0 0 0 0 0 0 0 0.25 0.5 0.75 0.5 0.75 1.0 0 0 0 0 0 0
c2 0 0 0 0 0 0 0 0 0 0 0 0 0.25 0.5 0.75 0.25 0.5 0.75 0 0 0 0.5 0.75 1.0 0 0 0 0 0 0
c3 0 0 0 0 0 0 0 0 0 0 0 0 0 0 0 0.5 0.75 1.0 0.0 0.25 0.5 0 0 0 0 0 0 0 0 0
d1 0 0 0 0 0 0 0.0 0.25 0.5 0.0 0.25 0.5 0.0 0.25 0.5 0.0 0.25 0.5 0.25 0.5 0.75 0.5 0.75 1.0 0 0 0 0.5 0.75 1.0 d2 0 0 0 0 0 0 0.0 0.25 0.5 0.0 0.25 0.5 0.0 0.25 0.5 0.0 0.25 0.5 0.25 0.5 0.75 0.5 0.75 1.0 0.5 0.75 1.0 0 0 0
doi:10.1371/journal.pone.0129153.t005
Using
the
Fuzzy
DEMATEL
to
Determine
Environmen
tal
Performa
|DOI:10.137
1/journal.p
one.0129153
June
8,
comparison results, the directions and degrees of influence between the criteria were deter-mined. The average scores of the expert opinions are listed inTable 3.
(3) Conversion of fuzzy linguistics.. The fuzzy scale shown inTable 2was converted into fuzzy numbers (Table 4). In the present study, the degree of influence can be described using 5 linguistic expressions, specifically, VH influence, H influence, L influence, VL influence, and NO influence. By using Eq (1), these expressions can be converted into fuzzy linguistic values, specifically, (0.75, 1.0, 1.0), (0.5, 0.75, 1.0), (0.25, 0.5, 0.75), (0, 0.25, 0.5), and (0, 0, 0), respec-tively, to establish a direct relation fuzzy matrix (Table 5).
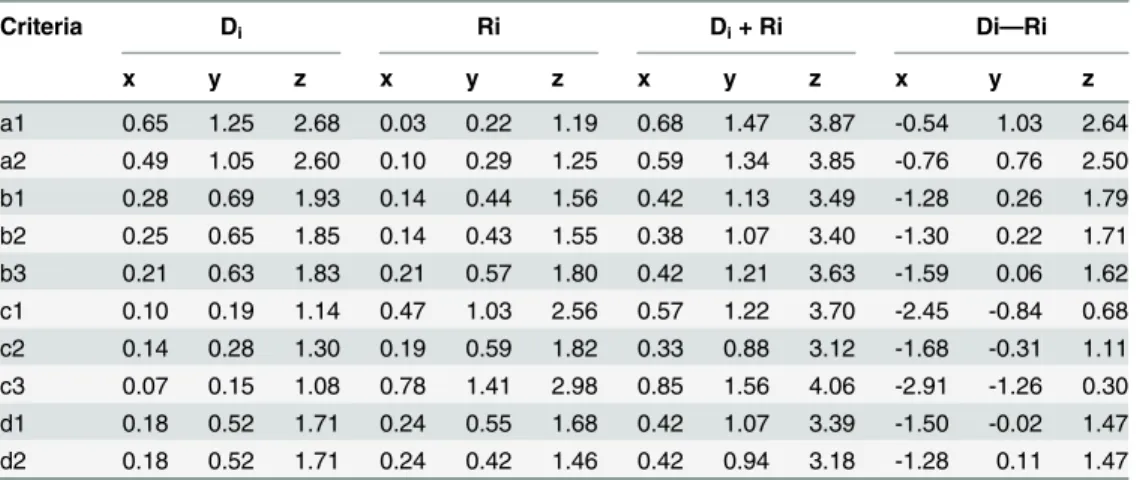
Table 6. Fuzzy DEMATEL prominence and relation.
Criteria Di Ri Di+ Ri Di—Ri
x y z x y z x y z x y z
a1 0.65 1.25 2.68 0.03 0.22 1.19 0.68 1.47 3.87 -0.54 1.03 2.64 a2 0.49 1.05 2.60 0.10 0.29 1.25 0.59 1.34 3.85 -0.76 0.76 2.50 b1 0.28 0.69 1.93 0.14 0.44 1.56 0.42 1.13 3.49 -1.28 0.26 1.79 b2 0.25 0.65 1.85 0.14 0.43 1.55 0.38 1.07 3.40 -1.30 0.22 1.71 b3 0.21 0.63 1.83 0.21 0.57 1.80 0.42 1.21 3.63 -1.59 0.06 1.62 c1 0.10 0.19 1.14 0.47 1.03 2.56 0.57 1.22 3.70 -2.45 -0.84 0.68 c2 0.14 0.28 1.30 0.19 0.59 1.82 0.33 0.88 3.12 -1.68 -0.31 1.11 c3 0.07 0.15 1.08 0.78 1.41 2.98 0.85 1.56 4.06 -2.91 -1.26 0.30 d1 0.18 0.52 1.71 0.24 0.55 1.68 0.42 1.07 3.39 -1.50 -0.02 1.47 d2 0.18 0.52 1.71 0.24 0.42 1.46 0.42 0.94 3.18 -1.28 0.11 1.47 doi:10.1371/journal.pone.0129153.t006
Fig 2. Interactive relationships of the 10 criteria.
(4) Calculation of results.. Eqs (12)–(14) were used to establish direct relation fuzzy ma-trices forXl,Xm, andXn. These matrices were then standardised by adopting theucolumn
vec-tor inlmuand the maximum value ofuas the baseline for standardisation. Subsequently, theXl,Xm, andXndirect relation fuzzy matrices were determined.
The defuzzification procedures expressed in Eqs (7)–(10) were employed to defuzzify the fuzzy linguistic values and obtain explicit values (Table 6).
(5) Illustration of the two-theme cause and effect diagram.. Finally, Eq (15) was em-ployed to integrate the total fuzzy relations matrices ofXl,Xm, andXnand calculate the (D + R)
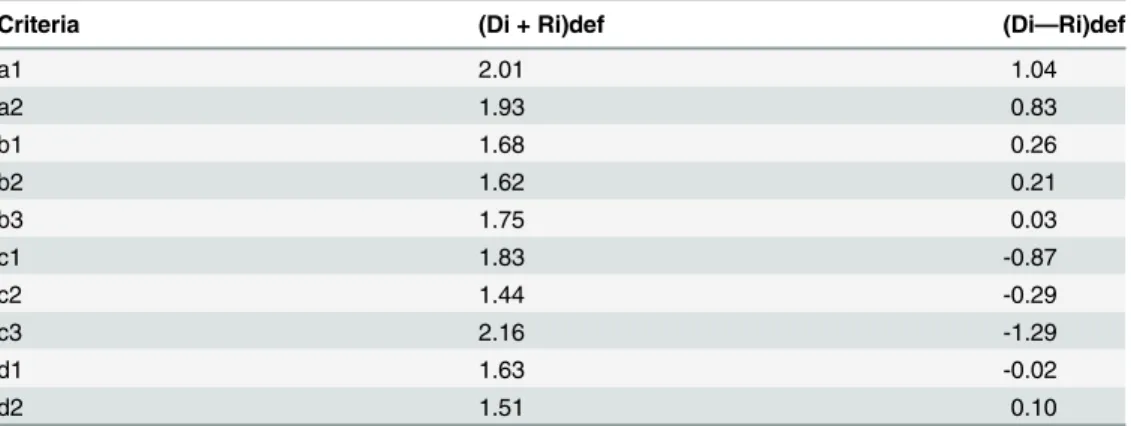
and (D−R) values (Table 6). The obtained prominence (D + R) def and relation (D−R) def
values are listed inTable 7. In addition, the 10 evaluation criteria were plotted on the horizontal axis according to the prominence (D + R) def value and on the vertical axis according to the (D
−R) def value (Fig 2).
Discussion
The 10 criteria were characterised and presented according to relation (D–R) and prominence (D + R), as shown inTable 7andFig 2, in between to understand their degrees and directions of interactive influence.
1. Criteria with high relation and high prominence: This category comprised green design (a1), green material procurement (a2), and energy consumption (b3). These criteria are charac-terised as reason criteria, are the core criteria influencing other criteria, and are the driving factors for resolving problems.
2. Criteria with high relation and low prominence: This category comprised green marketing (c1) and green image (c3). These criteria influence a minority of the other criteria and the degree of influence is low.
3. Criteria with low relation and high prominence: This category comprised air & water Pollu-tion (b1), waste polluPollu-tion (b2), and product recycling (d2). These criteria are characterised as result criteria, are influenced by other criteria, and cannot be directly improved.
4. Criteria with low relation and low prominence: This category comprised green transport (c2) and green packaging (d1). These criteria are influenced by other criteria; however, the degree of influence is extremely low, suggesting that they are relatively independent.
Table 7. Prominence and Relation following defuzzification.
Criteria (Di + Ri)def (Di—Ri)def
a1 2.01 1.04
a2 1.93 0.83
b1 1.68 0.26
b2 1.62 0.21
b3 1.75 0.03
c1 1.83 -0.87
c2 1.44 -0.29
c3 2.16 -1.29
d1 1.63 -0.02
d2 1.51 0.10
In summary of the aforementioned analyses of the directions and degrees of influence, the present study revealed that green development and green manufacturing are the core dimen-sions influencing other dimendimen-sions and that they are the driving factors for problem solving.
The present study also revealed that enterprises can actively implement the green design (a1) criterion of green development. Enterprises can propose green design management strate-gies to enhance environmental performance. Additionally, enterprises can implement green material procurement (a2) prior to product manufacturing. Enterprises can incorporate green concepts into the selection and procurement of raw materials from suppliers. Furthermore, en-terprises can easily and actively invest in researching the energy consumption (b3) criterion of green manufacturing, thereby enhancing energy efficiency, increasing the use of renewable en-ergy, and reducing resource wastage. By emphasising this criterion, enterprises can achieve the goals of energy conservation and reduction, thereby enhancing environmental performance.
Conclusion
To measure corporate environmental performance, the GP and GSC dimensions of an enterprise must be consolidated, discussed, and compared. The present study categorised the environmental performance measurement system into 4 major dimensions (i.e., green development, green manufacturing, green management and green recycling), which comprised 10 criteria (i.e., green design, green material procurement, air & water pollution, waste pollution, energy consumption, green marketing, green transport, green image, green packaging and product recycling).
To measure the environmental performance of manufacturers, the present study applied Fuzzy-DEMATEL model to examine environmental performance of the PCB industry in Tai-wan. The fuzzy-DEMATEL model combines the fuzzy linguistic aspect of fuzzy theory with the DEMATEL. Applying the DEMATEL in a fuzzy context enables researchers to analyse the causal relationships of fuzzy variables and determine the level of interactive influence between variables. First, fuzzy theory was employed to examine the environmental performance criteria of manufacturers and analyse fuzzy linguistics. The fuzzy-DEMATEL model was then em-ployed to calculate the direction and level of interaction between environmental performance criteria. Finally, the core environmental performance criteria which were critical for enhancing environmental performance of the PCB industry in Taiwan were identified and presented
These environmental performance criteria were green design (a1), green material procure-ment (a2), and energy consumption (b3) constitute crucial reason criteria, the core criteria influencing other criteria, and the driving factors for resolving problems.
Author Contributions
Conceived and designed the experiments: ST LW JZ. Performed the experiments: ST LW JZ. Analyzed the data: MC YX. Contributed reagents/materials/analysis tools: LL XJ QC. Wrote the paper: ST LW JZ.
References
1. Chiang SY, Wei CC, Chiang TH, Chen WL (2011) How can electronics industries become green manu-facturers in Taiwan and Japan. Clean Technol Envir 13: 37–47.
2. Cheng Y, Tao F, Liu Y, Zhao D, Zhang L, Xu L (2013) Energy-aware resource service scheduling based on utility evaluation in cloud manufacturing system. P I Mech Eng B-J Eng 227: 1901–1915.
3. Tsireme AI, Nikolaou EI, Georgantzis N, Tsagarakis KP (2012) The influence of environmental policy on the decisions of managers to adopt G-SCM practices. Clean Technol Envir 14: 953–964.
5. Winn SF, Roome NJ (1993) R & D management response to the environment current theory and impli-cations to practice and research. R&D Manage 23: 147–160.
6. Oliver H, Abhishek T (2013) Environmental appraisal of green production systems: Challenges faced by small companies using life cycle assessment. Int J Prod Res 51: 5884–5896.
7. Despeisse M, Ball PD, Evans S, Levers A (2012) Industrial ecology at factory level: A prototype meth-odology. P I Mech Eng B-J Eng 226: 1648–1664.
8. Tsai SB, Xue YZ, Huang PY, Zhou J, Li GD, Guo WF (2014) Establishing a criteria system for green Production. P I Mech Eng B-J Eng doi:10.1177/0954405414535923
9. Ahi P, Searcy C (2013) A comparative literature analysis of definitions for green and sustainable supply chain management. J Clean Prod 52: 329–341.
10. Blome C, Hollos D, Paulraj A (2014) Green procurement and green supplier development: Antecedents and effects on supplier performance. Int J Prod Res 52: 32–49.
11. Hetzel MW, Page-Sharp M, Bala N, Pulford J, Betuela I (2014) Quality of antimalarial drugs and antibi-otics in Papua New Guinea: A survey of the health facility supply chain. PLoS ONE 9(5): e96810. doi: 10.1371/ journal.pone.0096810PMID:24828338
12. Kumar S, Teichman S, Timpernagel T (2012) A green supply chain is a requirement for profitability. Int J Prod Res 50: 1278–1296.
13. Vimmerstedt LJ, Bush B, Peterson S (2012) Ethanol distribution, dispensing, and use: analysis of a por-tion of the biomass-to-biofuels supply chain using system dynamics. PLoS ONE 7(5): e35082. doi:10. 1371/ journal.pone.0035082PMID:22606230
14. Lee YC, Chen CY, Tsai SB, Wang CT (2014) Discussing green environmental performance and com-petitive strategies. Pensee 76: 190–198.
15. Lin SW, Yu CC (2004) Design and control for recycle plants with heat-integrated separators. Chem Eng Sci 59: 53–70.
16. Conrad K, Morrison C (1989) The impact of pollution abatement investment on productivity change: An empirical comparison of the U.S. Germany and Canada. South Econ J 10: 684–689.
17. Carter CR, Kale RG, Curtis M (2009) Environmental purchasing and firm performance: An empirical in-vestigation. Transp Res Part E Log Transp Rev 36: 219–228.
18. Tseng ML, Lin YH (2008) Selection of competitive advantage in TOM implementation using Fuzzy AHP and sensitivity analysis. Asia Pac Manage Rev 13: 583–599.
19. Tseng ML, Chiang JH, Lan LW (2009) Selection of optimal supplier in supply chain management strate-gy with analytic network process and choquet integral. Comput Ind Eng 57: 330–340.
20. Zhu QH, Geng Y, Sarkis J (2011) Evaluating green supply chain management among Chinese manu-facturers from the ecological modernisation perspective. Transp Res Part E Log Transp Rev 47: 808–
821.
21. Chu CH, Luh YP, Li TC, Chen H (2009) Economical green production design based on simplified com-puter-aided product structure variation. Comput Ind 60: 485–500.
22. Kainuma Y, Tawara N (2006) A multiple attribute utility theory approach to lean and green supply chain management. Int J Prod Econ 101: 99–108.
23. Tsai SB, Xue YZ (2013) Corporate social responsibility research among manufacturing enterprises: Taiwanese electronic material manufacturing enterprises. Appl Mech Mater 437: 1012–1016.
24. Gabus A, Fontela E (1973) Perceptions of the world problematique: Communication procedure, com-municating with those bearing collective responsibility, DEMATEL report No. 1. Geneva, Switzerland: Battelle Geneva Research Center.
25. Fontela E, Gabus A (1976) The DEMATEL observer (DEMATEL 1976 Report). Geneva, Switzerland: Battelle Geneva Research Center.
26. Lee YC, Li ML, Yen TM, Huang TH (2010) Analysis of adopting an integrated decision making trial and evaluation laboratory on a technology acceptance model. Expert Syst Appl 37: 1745–1754.
27. Wu HH, Chen HK, Shieh JI (2010) Evaluating performance criteria of employment service outreach pro-gram personnel by DEMATEL method. Expert Syst Appl 37: 5219–5223.
28. Lee YC, Hsieh YF (2011) Integration of revised simultaneous importance performance analysis and de-cision making trial and evaluation laboratory–A study of mobile telecommunication industry in Taiwan. Afr J Bus Manag 5: 2312–2321.
29. Tsai SB, Lee YC, Wu CH, Guo JJ (2013) Examining how manufacturing corporations win orders. S Afr J Ind Eng 24: 112–124.
31. Huarng K, Yu TH (2006) The application of neural network to forecasting fuzzy time series. Physica A 363: 481–491.
32. Tsaur RC, Kuo TC (2011) The adaptive fuzzy time series model with an application to Taiwan’s tourism demand. Expert Syst Appl 38: 9164–9171.
33. Lee YC, Wu CH, Tsai SB (2014) Grey system theory and fuzzy time series forecasting for the growth of green electronic materials. Int J Prod Res 52: 2931–2945.
34. Chang B, Chang CW, Wu CH (2011) Fuzzy DEMATEL method for developing supplier selection crite-ria. Expert Syst Appl 38: 1850–1858.
35. Wu WW (2012) Segmenting critical factors for successful knowledge management implementation using the fuzzy DEMATEL method. Appli Soft Comp 12: 527–535.
36. Wu WW, Lee YT (2007) Developing global managers’competencies using the fuzzy DEMATEL meth-od. Expert Syst Appl 32: 499–507.
37. Tseng ML (2009) A causal and effect decision making model of service quality expectation using grey-fuzzy DEMATEL approach. Expert Syst Appl 36: 7738–7748.


![INÊS SIMÕES DE BRITO PEIXOTO [n.º 236] A Project carried out with the supervision of Professor Paulo Gomes](data:image/gif;base64,R0lGODlhAQABAIAAAP///wAAACH5BAEAAAAALAAAAAABAAEAAAICRAEAOw==)