Association of Continuity of Primary Care
and Statin Adherence
James R. Warren1*, Michael O. Falster2, Bich Tran2, Louisa Jorm2
1Department of Computer Science, University of Auckland, Auckland, New Zealand,2Centre for Big Data Research in Health, University of New South Wales, Kensington, New South Wales, Australia
Abstract
Purpose
Deficiencies in medication adherence are a major barrier to effectiveness of chronic condi-tion management. Continuity of primary care may promote adherence. We assessed the association of continuity of primary care with adherence to long-term medication as exem-plified by statins.
Research Design
We linked data from a prospective study of 267,091 Australians aged 45 years and over to national data sets on prescription reimbursements, general practice claims, hospitalisations and deaths. For participants having a statin dispense within 90 days of study entry, we computed medication possession ratio (MPR) and usual provider continuity index (UPI) for the subsequent two years. We used multivariate Poisson regression to calculate the relative risk (RR) and 95% confidence interval (CI) for the association between tertiles of UPI and MPR adjusted for socio-demographic and health-related patient factors, including age, gen-der, remoteness of residence, smoking, alcohol intake, fruit and vegetable intake, physical activity, prior heart disease and speaking a language other than English at home. We per-formed a comparison approach using propensity score matching on a subset of the sample.
Results
36,144 participants were eligible and included in the analysis among whom 58% had UPI greater than 75%. UPI was significantly associated with 5% increased MPR for statin adher-ence (95% CI 1.04–1.06) for highest versus lowest tertile. Dichotomised analysis using a cut-off of UPI at 75% showed a similar effect size. The association between UPI and statin adherence was independent of socio-demographic and health-related factors. Stratification analyses further showed a stronger association among those who were new to statins (RR 1.33, 95% CI 1.15–1.54).
OPEN ACCESS
Citation:Warren JR, Falster MO, Tran B, Jorm L (2015) Association of Continuity of Primary Care and Statin Adherence. PLoS ONE 10(10): e0140008. doi:10.1371/journal.pone.0140008
Editor:Qing Wu, University of Nevada Las Vegas, UNITED STATES
Received:June 24, 2015
Accepted:September 21, 2015
Published:October 8, 2015
Copyright:© 2015 Warren et al. This is an open access article distributed under the terms of the
Creative Commons Attribution License, which permits unrestricted use, distribution, and reproduction in any medium, provided the original author and source are credited.
Conclusions
Greater continuity of care has a positive association with medication adherence for statins which is independent of socio-demographic and health-related factors.
Introduction
Poor adherence (also known ascompliance) to long-term medication is a major issue
under-mining effective delivery of healthcare.[1] It is frequently overlooked by prescribing physicians
when intensifying treatment.[2,3] Statins, as a case in point, are effective in primary prevention
of cardiovascular disease (CVD)[4] and are a central element of CVD risk management
guide-lines.[5],[6] The rate of failure to maintain statin therapy for 12 months after initiation is high,
[7] even following acute coronary events.[8] Poorer levels of statin adherence are associated
with higher rates of long-term mortality after acute myocardial infarction[9] and in coronary
artery disease generally.[10] Risk factors for poor adherence to statins include dispensing for
primary (as compared to secondary) prevention[11,12] and being a new statin user.[11] In
terms of strategies to improve adherence to lipid lowering drugs, reinforcement and reminder
have the best evidence.[13]
The relationship of continuity of care (CoC) to medication, including statin, adherence is
unclear. Brookhart et al.[14] found that physician visits–either to the physician who initiated
statin therapy, or to another physician–as well as cholesterol tests, myocardial infarction or
other CVD-related hospitalisation, were all associated with return to statin adherence. Adding
to the complexity, there is a‘healthy user bias’in statin adherence; that is, those who adhere to
statins tend to pursue other healthy practices, including seeking out preventative health
ser-vices in the form of screening tests and vaccinations,[15] and being more likely to be
non-smokers.[12,16]
The present study utilised data from a large prospective study of Australians aged 45 and over linked with national health databases to estimate the association of CoC on statin adher-ence when adjusting for a range of patient characteristics.
Methods
Data sources
The 45 and Up Study is a cohort study of more than 260,000 men and women aged 45 years and over resident in New South Wales (NSW), Australia; managed by the Sax Institute, it is an
open research resource to help facilitate research on health, ageing and quality-of-life.[17]
Par-ticipants for the 45 and Up Study were randomly sampled from the enrolment database of
Medicare Australia (Australia’s universal health insurance scheme) and joined the study by
completing a mailed self-administered questionnaire and providing written informed consent for participation and long term follow-up, including linkage to health records. The response
rate was 18%.[17] Recruitment to the 45 and Up Study commenced in 2005 and was completed
in 2009. The data set for the present analysis was created by linkage of 45 and Up Study base-line survey data to Australian Government and NSW state data sources as described below.
Through the Pharmaceutical Benefits Scheme (PBS), the Australian Government subsidises
essential medications[18] including statins. The PBS data provides a transaction record for
each subsidised dispense from a community pharmacy. Concession Card holders have a lower subsidy co-payment threshold than general beneficiaries, and there is an annual Safety Net
Interested researchers should contact the Sax Institute ([email protected]) and CHeReL ([email protected]) for data access approval procedures.
Funding:This work was supported by a National Health and Medical Research Council Partnership Project Grant (#1036858) and by partner agencies the Australian Commission on Safety and Quality in Health Care, the Agency for Clinical Innovation and the NSW Bureau of Health Information. The authors thank the men and women participating in the 45 and Up Study, which is owned and managed by the Sax Institute, Sydney, NSW (www.saxinstitute.org.au) in collaboration with major partner Cancer Council NSW and other partners which, at the time of writing, include: National Heart Foundation of Australia (NSW Division), NSW Ministry of Health, beyondblue, Ageing, Disability and Home Care, Department of Family and Community Services, the Australian Red Cross Blood Service and UnitingCare Ageing. The authors thank the Sax Institute, the NSW Ministry of Health, the NSW Register of Births, Deaths and Marriages and the Department of Human Services for allowing access to the data, and the Centre for Health Record Linkage for conducting the probabilistic linkage of records. The manuscript has been approved for submission for publication subsequent to quality and compliance review coordinated by the Sax Institute.
threshold of total family payments after which prescriptions are fully subsidised by the PBS.
[19] Concession Card holder status for PBS is granted for people aged 65 and over who meet
an income test, as well as for disability, low income or facing a large burden of dependants.[20]
The PBS data includes the recipient’s Concession Card status and whether the Safety Net
threshold had been reached at the time of the transaction.
The Medical Benefits Schedule (MBS) is Australia’s universal health insurance scheme for
subsidised medical care including general consultations, diagnostic tests and pathology ser-vices. Only services attracting subsidy benefit are included in this database.
The NSW Admitted Patient Data Collection (APDC) is a routinely collected census of pital separations (discharges, transfers and deaths) from all NSW public and private sector hos-pitals and day procedure centres.
The NSW Registry of Births, Deaths and Marriages (RBDM) data captures details of all deaths registered in NSW.
The Sax Institute linked 45 and Up Study questionnaire data and MBS and PBS claims
using a scrambled Medicare number, while the Centre for Health Record Linkage (www.cherel.
org.au) performed linkage to the APDC and RBDM data using probabilistic methods and com-mercial software (ChoiceMaker; ChoiceMaker Technologies Inc.). Quality assurance data show false positive and negative rates for data linkage of 0.4% and less than 0.1%, respectively.
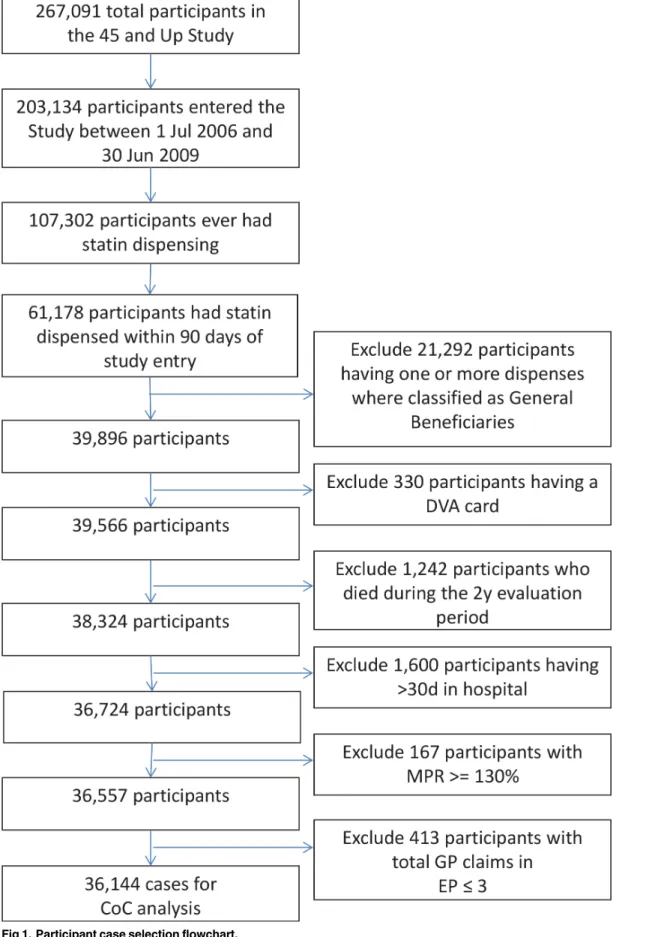
Participants and exclusion criteria
Using the linked data set, we identified 45 and Up Study participants who had (a) entered the 45 and Up Study (completed the baseline survey) between 1 July 2006 and 30 June 2009; and (b) had a statin dispensed within 90 days of study entry. For these, we defined an evaluation period (EP) of two years starting from study entry.
We excluded participants for whom we expected data capture in PBS claims data to be less
accurate. As such, we excluded those with any PBS transactions showing patient type“
Gen-eral–Ordinary”or“General–Safety Net”during the EP as many common statins fall under the
co-payment threshold for general beneficiaries and would not have been captured[21]
(con-versely, all statin dispensing for Concession Card holders would be subsidized and thus a complete record of community based supply is expected during the EP). We also excluded par-ticipants who held a Department of Veterans Affairs (DVA) healthcare card because Medicare data do not capture all services provided to these cardholders. We excluded participants who died during the EP as indicated by an RBDM record. We also excluded participants who had
>30 days in hospital during the EP as they might have received statin therapy as an inpatient
that was not captured by the PBS. Further exclusions were applied for participants with unusu-ally high levels of medication supply and for participants with too few GP claims in the EP to
ensure the stable estimation of measures of CoC as described, respectively, in the‘Outcome’
and‘Measures of continuity of care’sections below. A flowchart describing the inclusion and
exclusion of participants is shown inFig 1.
Outcome
We assessed statin adherence in terms of a medication possession ratio (MPR), computed as the proportion of days covered by dispensing to the patient as indicated from the PBS records during the two-year EP. We took the commonly used threshold of MPR`80% to indicate
adherence.[22] Statins at all common strengths are packaged for 30-days’supply per dispense;
thus, we defined MPR as the number of PBS records for statins (as per ATC[23] codes,
includ-ing combination products) with dispense dates within that participant’s EP divided by 24.
Fig 1. Participant case selection flowchart.
over-supply and is difficult to justify in terms of expected fluctuations in supply pattern (e.g. as with a dose change).
Measures of continuity of care
We assessed continuity of care using all MBS claims categorised as‘A1’and‘A2’(general
prac-titioner attendances and other non-referred attendances to which no other item applies)[24]
during the EP, on the basis that while consultant (specialist) physicians may be involved in commencement or adjustment of therapy, General Practitioners (GPs) are the usual providers of statin therapy in the Australian healthcare system.
We defined continuity of care in two ways: firstly, using the usual provider continuity index
(UPI),[25] which measures the concentration of a patient’s total visits to the most common
provider of care; and secondly, using the‘continuity of care score’(CoC score),[26] which
mea-sures concentration of patient visits across providers. UPI and CoC scores were calculated using the following formulae:
UPI¼maxðniÞ
N
CoC Score¼
P
ni2 N
NðN 1Þ
where ni= number of visits that the participant has with theirith provider, max(ni) = number
of visits the patient has with the provider with whom they have the most visits, and N = total
visits. UPI and CoC scores are expected to be highly correlated[27] and accordingly we selected
UPI as the primary focus for our analysis, retaining CoC score for sensitivity analysis only. We
defined tertiles of UPI and CoC score and repeated the analysis using dichotomised cut-off of
UPI at 75%.[28]
Analyses were restricted to participants with 4 or more GP claims in the EP as there is
lim-ited granularity in possible continuity scores with a smaller number of visits.[29]
Statistical analyses
Given the common outcome, we used modified Poisson regression [30,31] to estimate relative
risks (RRs) and 95% confidence intervals (CIs) for the association between CoC and MPR for statin adherence. Covariates were extracted from the self-reported questionnaire in the 45 and Up Study, except for new-to-statins status which we defined as no PBS record of statin dispens-ing in the 24- month period prior to the EP. We built two sequential regression models: model 1, adjusted for age and gender only; and model 2, adjusted for age, gender and a range of other
socio-demographic and health-related variables. All covariates are described inTable 1. We
conducted a series of interaction analyses between UPI and each of the covariates and
per-formed stratified analyses only for the covariates that showed significant interaction (p<0.05).
We used propensity score matching as a sensitivity analysis to control for confounding. We estimated the probability of being in each level of UPI (propensity score) using logistic
regres-sion conditioning on all variables listed inTable 1and used a greedy matching technique[35]
to identify matched pairs of participants (1:1) with similar propensity scores. We used condi-tional logistic regression to estimate the effect size of UPI on MPR in the matched subsets of participants.
We carried out all analyses in SAS 9.3 (SAS Institute, Cary, NC).
Aboriginal Health & Medical Research Ethics Committee (reference 832/11) approved the research. The University of New South Wales Human Research Ethics Committee approved the 45 and Up Study.
Results
We included for analysis 36,144 (13.5%) of the 267,091 participants in the 45 and Up Study
after exclusions as shown inFig 1.Table 2shows the ranges, statin adherence rates, and
multi-variate adjusted RR with 95% CI for statin adherence for UPI tertiles, dichotomised UPI and
CoC score tertiles with the two sets of covariates as perTable 1. The tertile cut-offs of UPI were
at 68.7% and 88.9%; 15,179 participants (42%) had a UPI<75%. Compared to the lowest
ter-tile, the upper tertile of UPI was associated with a 5% increased MPR for statin adherence (CI
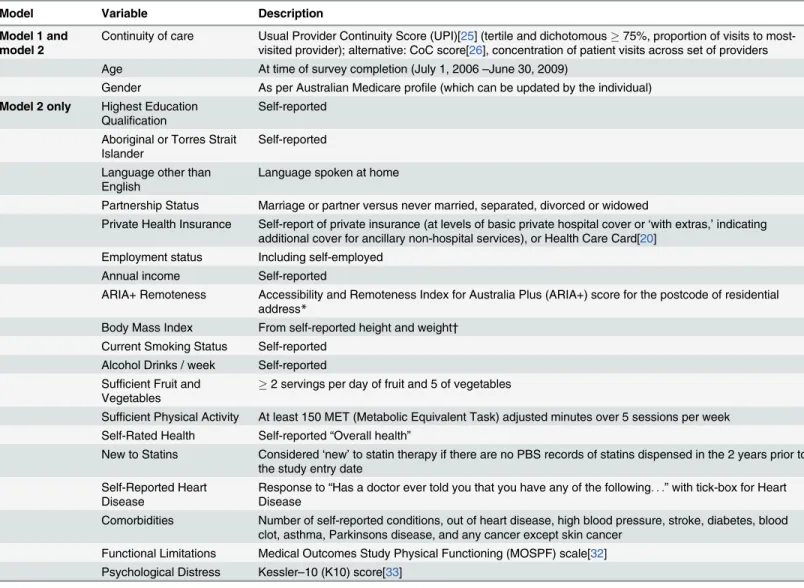
Table 1. Model predictors of adherence.
Model Variable Description
Model 1 and model 2
Continuity of care Usual Provider Continuity Score (UPI)[25] (tertile and dichotomous75%, proportion of visits to most-visited provider); alternative: CoC score[26], concentration of patient visits across set of providers Age At time of survey completion (July 1, 2006–June 30, 2009)
Gender As per Australian Medicare profile (which can be updated by the individual)
Model 2 only Highest Education Qualification
Self-reported Aboriginal or Torres Strait
Islander
Self-reported Language other than
English
Language spoken at home
Partnership Status Marriage or partner versus never married, separated, divorced or widowed
Private Health Insurance Self-report of private insurance (at levels of basic private hospital cover or‘with extras,’indicating additional cover for ancillary non-hospital services), or Health Care Card[20]
Employment status Including self-employed Annual income Self-reported
ARIA+ Remoteness Accessibility and Remoteness Index for Australia Plus (ARIA+) score for the postcode of residential address*
Body Mass Index From self-reported height and weight† Current Smoking Status Self-reported
Alcohol Drinks / week Self-reported Sufficient Fruit and
Vegetables
2 servings per day of fruit and 5 of vegetables
Sufficient Physical Activity At least 150 MET (Metabolic Equivalent Task) adjusted minutes over 5 sessions per week Self-Rated Health Self-reported“Overall health”
New to Statins Considered‘new’to statin therapy if there are no PBS records of statins dispensed in the 2 years prior to the study entry date
Self-Reported Heart Disease
Response to“Has a doctor ever told you that you have any of the following. . .”with tick-box for Heart Disease
Comorbidities Number of self-reported conditions, out of heart disease, high blood pressure, stroke, diabetes, blood clot, asthma, Parkinsons disease, and any cancer except skin cancer
Functional Limitations Medical Outcomes Study Physical Functioning (MOSPF) scale[32] Psychological Distress Kessler–10 (K10) score[33]
*ARIA+ is based on sum of ratios of road distances to population centers offive distinct sizes as compared to Australian national averages[34]. We label ARIA+ bands: 0–1.84 = Metro;>1.84–3.51 = Inner Regional;>3.51–5.80 = Outer Regional;>5.80–9.08 = Remote; and>9.08 = Very Remote.
†BMI categories are labelled conventionally as Underweight (BMI<20), Normal weight (BMI 20–<25), Overweight (BMI 25–<30) and Obese (BMI 30 and
higher).
1.04–1.06). Dichotomised analysis showed that UPI at 75% or above was also associated with
increased likelihood of adherence (RR 1.04, 95% CI 1.03–1.05). The effect sizes of UPI on MPR
were independent of socio-demographic and health factors with model 1 and model 2 return-ing nearly-identical results. As expected, UPI and CoC score were highly correlated, Pearson correlation coefficient = 0.977; RRs by tertile were almost identical for UPI and CoC score.
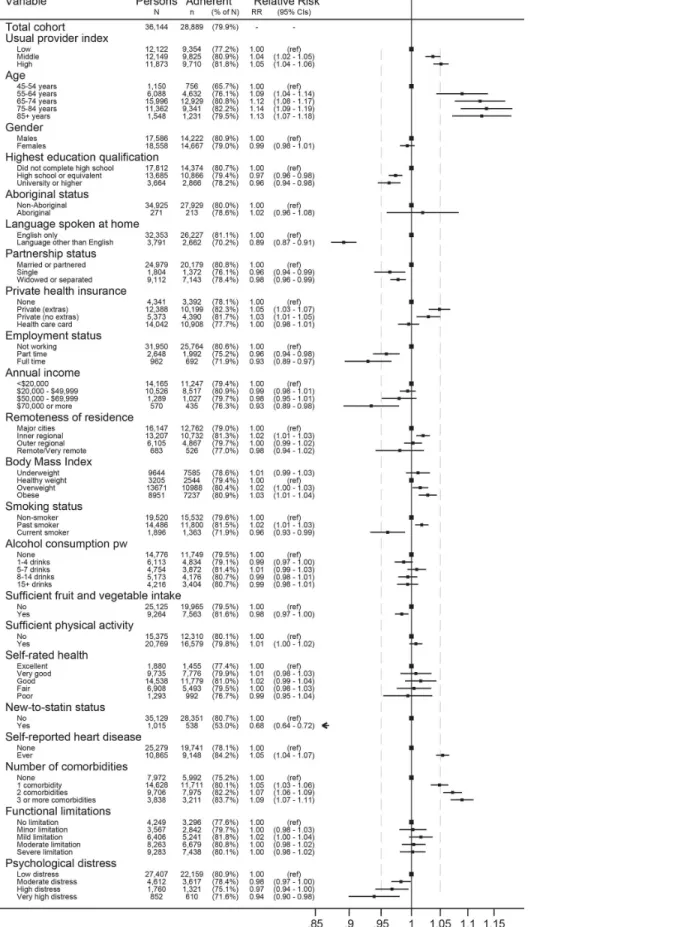
Fig 2shows the forest plot of adjusted RR and 95% CI from model 2 for tertiles of UPI and covariates, with track marks to highlight comparison to UPI for the other variables. A number of variables had RRs similar in magnitude to UPI. For lower adherence these were: university level education, being single, being employed, highest income band, current smoker and high
to very high psychological distress. For higher adherence these were age 55–64 years, having
private health insurance, history of heart disease and having one comorbidity. Being new to
statins was the strongest predictor in the model (RR 0.68, 95% CI 0.64–0.72); age categories 65
+, speaking a language other than English at home and having two or more comorbidities also had RRs clearly greater than that for UPI.
Only new-to-statins status and speaking a language other than English at home were found to have significant interaction with UPI on the association with MPR (p = 0.003 and p = 0.04, respectively). Stratification analyses by new-to-statins status showed a greater effect on
adher-ence for those who were new to statins (model 2 RR 1.36, 95% CI 1.18–1.57 for medium versus
low tertiles and RR 1.33, 95% CI 1.15–1.54 for high versus low tertiles) than people who were
not new to statins (RR 1.03, 95% CI 1.02–1.04; RR 1.05, 95% CI 1.03–1.06 respectively).
Simi-larly, model 2 analysis stratified by language other than English spoken at home showed that increased continuity had a greater impact among people who spoke a language other than
English at home (model 2 RR 1.07, 95% CI 1.01–1.13 and RR 1.12, 95% CI 1.06–1.18, in
medium versus low and high versus low tertiles, respectively) as compared to people who
spoke only English at home (RR 1.03, 95% CI 1.02–1,05 and RR 1.04, 95% CI 1.03–1.06),
although to a lesser extent than in people who were new to statins.
Results of propensity matched analyses are shown inTable 3. In these analyses, higher levels
of UPI, either in tertile categories or dichotomised cut-off, were significantly associated with higher MPR for statin adherence. The effect size for the association between UPI and MPR generated from propensity matched analysis was similar to that from Poisson regression although the confidence intervals were wider.
Table 2. Relative Risk (RR) of continuity of care, measured by the Usual Provider Continuity Index (UPI) and the Continuity of Care score (CoC score), on statin adherence (Medication Possession Ratio, MPR80%) in models adjusted for covariates as perTable 1.
Statin adherence (MPR80) Adjusted RR (95% CI)
Range of continuity measure (min-max) No Yes Model 1 Model 2
UPI tertiles
Low 9.0–66.7 2768 (22.8) 9354 (77.2) 1.00 1.00
Medium 66.8–88.9 2324 (19.1) 9825 (80.9) 1.04 (1.03–1.06) 1.04 (1.02–1.05)
High 89.0–100 2163 (18.2) 9710 (81.8) 1.05 (1.04–1.07) 1.05 (1.04–1.06)
UPI0.75
No 9.0–74.9 3354 (22.1) 11825 (77.9) 1.00 1.00
Yes 75–100 3901 (18.6) 17064 (81.4) 1.04 (1.03–1.05) 1.04 (1.03–1.05)
CoC score tertiles
Low 0–48.5 2762 (22.9) 9290 (77.1) 1.00 1.00
Medium 48.5–78.6 2298 (19.1) 9749 (80.9) 1.04 (1.03–1.06) 1.04 (1.03–1.05)
High 78.6–100 2195 (18.2) 9850 (81.8) 1.05 (1.04–1.07) 1.05 (1.04–1.07)
Fig 2. Relative risk for statin adherence (MPR80%) of mutually adjusted covariates from model 2, with relation to the relative risk of the Usual Provider Continuity Index (UPI) for highest versus lowest tertiles.
Discussion
We found that CoC was associated with greater adherence to statins. The magnitude and statis-tical significance of this association was similar regardless of the covariates that were adjusted for (age and sex only versus a wide range of socio-demographic and health related factors), modelling method (Poisson regression versus propensity score matching) and CoC measure used (UPI or CoC score). The findings are broadly consistent with a review that found CoC is
associated with improved patient outcomes[36] and with a study of US veterans that found
that those with three or more prescribers had lower refill adherence for dyslipidaemia
medica-tions.[37] Moreover, our findings suggest that the association of CoC with statin adherence
is not simply a‘healthy user bias’, since it was robust to adjustment for a range of healthy
behaviours including smoking, alcohol intake, fruit and vegetable intake and physical activity. Although some health behaviour and health status variables were significantly associated with adherence (e.g. smoking status and prior heart disease), these did not appear to act as
con-founders or mediators of the CoC–adherence relationship, with the exception of new-to-statins
status.
In keeping with the meta-analysis by Lemstra et al.,[11] we found that patients who were
new to statins are at much greater risk of nonadherence. In addition, our stratified analysis demonstrated that the CoC association was much stronger for those who were new to statins.
The findings are consistent with Brookhart et al.[14] with respect to positive association of
CoC and statin adherence for new statin users. We extended these findings to longer-term statin users, and demonstrated the association to be largely invariant against socio-demo-graphic and health related variables not available to the earlier study. Moreover, we found that the associations between CoC and statin adherence were similar when comparing the effects of the middle and upper tertiles versus the lowest tertile suggesting there was a threshold effect rather than a trend with increasing level of CoC.
Table 3. Association between Usual Provider Continuity Index (UPI) and statin adherence (Medication Possession Ratio MPR80) using propen-sity score matching*.
MPR80 RR (95% CI)
Propensity match UPI (min-max) No Yes Crude Model 1 Model 2
Match 1
Low tertile 9.0–66.7 2529 (22.4) 8788 (77.6) 1.00 1.00 1.00
Medium tertile 66.8–88.9 2185 (19.3) 9132 (80.7) 1.04 (1.01-1.07) 1.04 (1.01-1.07) 1.04 (1.01-1.07) Match 2†
Low tertile 9.0–66.7 2181 (22.7) 7444 (77.3) 1.00 1.00 1.00
High tertile 89.0–100 1781 (18.5) 7844 (81.5) 1.05 (1.02-1.09) 1.05 (1.02-1.09) 1.05 (1.02-1.09) Match 3
UPI<0.75 9.0–74.9 3297 (21.9) 11742 (78.1) 1.00 1.00 1.00
UPI0.75 75–100 2818 (18.7) 12221 (81.3) 1.04 (1.02-1.07) 1.04 (1.01-1.07) 1.04 (1.01-1.07)
*Separate propensity matches were performed for the usual provider continuity index between cohorts of (1) low and medium tertiles; (2) low and high tertiles; (3) having a usual provider of care (UPI0.75) or not. Propensity matching was performed using all covariates described inTable 1, including age, gender, highest education qualification, Aboriginal or Torres Strait Islander status, language other than English spoken at home, partnership status, private health insurance, employment status, annual household income, remoteness of residence, body mass index, current smoking status, alcohol consumption, fruit and vegetable consumption, physical exercise, self-rated health, self-reported heart disease, number of comorbidities, functional limitation, psychological distress, and new to statin status.
†There were no significant differences (Chi-square p-value<0.05) between matched cohorts in the distribution of variables used for propensity matching, with the exception of physical activity and new to statin status within the cohort from Match 2.
Based on international findings, it is not surprising that we found patients in Australia speaking a language other than English at home to have lower statin adherence. In looking at
cardiac medication use after acute myocardial infarction, Lai et al.[38] found some (although
inconsistent) adherence risk for Chinese and South Asian groups compared to non-Asian
Canadians. More consistent with our findings, Wisnivesky et al.[39] found limited English
pro-ficiency was associated with poorer self-management and worse outcomes among older people with asthma with respect to Hispanic American populations. Our analysis suggests that the association of CoC and statin adherence may be stronger for those speaking a language other than English at home. Further study of the mechanisms by which this group is associated with poorer adherence in the Australian context is warranted.
While the magnitude of the association we found between achieving higher tertiles of CoC and the likelihood of high statin adherence appeared to be modest, its effect size was similar to other recognised predictors of adherence, such as self-reported heart disease. The association of statin adherence and outcomes has been demonstrated in a number of contexts. For exam-ple, a longitudinal study among 31,455 elderly survivors in Ontario showed that low adherence to statins in the year after hospitalisation for myocardial infarction was associated with between
12–25% increased risk of mortality.[9] Further, a cohort study of patients newly treated with
statins and initially free of cardiovascular disease showed that patients with low adherence to
statins were more likely to be hospitalised and had increased hospital costs.[40] Therefore,
even a small increase in likelihood of non-adherence could represent important information about opportunities for improved disease management.
Our dispensing data was limited to records of government subsidies (i.e. we did not have direct access to the data from pharmacies). As such, our analysis was restricted to participants who were Concession Card holders throughout the two-year period for which we measured adherence as only these participants had subsidy across the full range of statins during our analysis period. We had previously found that similar factors influence statin adherence in
Concession Card holders and general beneficiaries.[12] Since our findings come from the
Aus-tralian context, where there is a substantial degree of universal health subsidy, we expect
finan-cial factors to play a stronger role in other healthcare systems; indeed Lemstra et al.[11] found
co-payment to be a significant factor for non-adherence, and found the reverse trend to the present study with lowest rather than highest income associated with non-adherence. More-over, the Australian system allows health consumers relatively free choice of providers.
It is possible that statin users in our analysis are not entirely representative of the broader population. While 45 and Up Study participants had higher incomes, and lower prevalence of smoking, psychological distress, hypertension, diabetes and asthma than respondents in a pop-ulation health survey, the prevalence of other characteristics such as body mass index and falls
history was similar in the two studies.[41] We relied on self-reported data for some predictors,
including socio-demographic and health-related variables; validation studies involving partici-pants in the 45 and Up Study, however, have found excellent agreement between self-reported
country of birth and that recorded in hospital data[42] and between body mass index
catego-ries from self-reported and measured data.[43] The very large size of the 45 and Up Study
means that there is substantial heterogeneity within predictor variables, which is required for the valid estimation of relative measures of effect calculated, as here, from internal comparisons
within a cohort.[44]
influenced by unobserved variables (i.e. beyond those for which we adjusted in the analysis), and findings from this study might not be generalised for the association of COC and medica-tion adherence that was measured in a lagged time period.
In summary, we found that CoC is associated with greater adherence to statins, particularly for patients who are new to statins. Our findings were observational and therefore do not imply that manipulating CoC, if feasible, will improve overall rates of adherence. However, they clearly indicate that when a patient has placed around 75% of their community care visits in a single provider, they more often remain adherent to statins, regardless of demographic, health status and behavioural factors. Our findings suggest that continuity-promoting
practices–such as follow-up and other aspects of a strong patient-provider relationship–are
promising for engendering better adherence to long-term medications and better CVD risk management.
Acknowledgments
The authors thank the men and women participating in the 45 and Up Study. The 45 and Up Study is managed by The Sax Institute in collaboration with major partner Cancer Council New South Wales, and partners the National Heart Foundation of Australia (NSW Division), the NSW Ministry of Health, beyondblue: the national depression initiative, the NSW Depart-ment of Ageing, Disability and Home Care and Uniting Care Ageing. This research was con-ducted at the Centre for Health Research, School of Medicine, University of Western Sydney, Campbelltown, NSW, Australia. We thank Jean-Pierre Calabretto for his helpful advice on Australian pharmacy data.
Author Contributions
Conceived and designed the experiments: JRW MOF BT LJ. Performed the experiments: JRW MOF BT. Analyzed the data: JRW MOF BT. Contributed reagents/materials/analysis tools: JW MOF BT. Wrote the paper: JW MOF BT LJ.
References
1. Rodgers PT, Ruffin DM. Medication nonadherence–-Part I: The health and humanistic consequences. Managed care interface. 1998; 11(8):58–60. Epub 1998/07/06. PMID:10182240.
2. Heisler M, Hogan MM, Hofer TP, Schmittdiel JA, Pladevall M, Kerr EA. When more is not better: treat-ment intensification among hypertensive patients with poor medication adherence. Circulation. 2008; 117(22):2884–92. Epub 2008/05/29. doi:10.1161/CIRCULATIONAHA.107.724104PMID:18506011.
3. Pittman DG, Fenton C, Chen W, Haffner S, Pendergrass M. Relation of statin nonadherence and treat-ment intensification. The American journal of cardiology. 2012; 110(10):1459–63. Epub 2012/08/11. doi:10.1016/j.amjcard.2012.07.008PMID:22877424.
4. Taylor F, Huffman MD, Macedo AF, Moore TH, Burke M, Davey Smith G, et al. Statins for the primary prevention of cardiovascular disease. The Cochrane database of systematic reviews. 2013; 1: CD004816. Epub 2013/02/27. doi:10.1002/14651858.CD004816.pub5PMID:23440795.
5. National Vascular Disease Prevention Alliance. Guidelines for the management of absolute cardiovas-cular disease risk: National Stroke Foundation; 2012.
6. Perk J, De Backer G, Gohlke H, Graham I, Reiner Z, Verschuren M, et al. European Guidelines on car-diovascular disease prevention in clinical practice (version 2012). The Fifth Joint Task Force of the European Society of Cardiology and Other Societies on Cardiovascular Disease Prevention in Clinical Practice (constituted by representatives of nine societies and by invited experts). Developed with the special contribution of the European Association for Cardiovascular Prevention & Rehabilitation (EACPR). European heart journal. 2012; 33(13):1635–701. Epub 2012/05/05. doi:10.1093/eurheartj/ ehs092PMID:22555213.
8. Thornley S, Marshall R, Chan WC, Kerr A, Harrison J, Jackson G, et al. Four out of ten patients are not taking statins regularly during the 12 months after an acute coronary event. European journal of preven-tive cardiology. 2012; 19(3):349–57. Epub 2011/04/01. doi:10.1177/1741826711403069PMID:
21450568.
9. Rasmussen JN, Chong A, Alter DA. Relationship between adherence to evidence-based pharmaco-therapy and long-term mortality after acute myocardial infarction. JAMA. 2007; 297(2):177–86. Epub 2007/01/11. doi:10.1001/jama.297.2.177PMID:17213401.
10. Ho PM, Magid DJ, Shetterly SM, Olson KL, Maddox TM, Peterson PN, et al. Medication nonadherence is associated with a broad range of adverse outcomes in patients with coronary artery disease. Ameri-can Heart Journal. 2008; 155(4):772–9. Epub 2008/03/29. doi:10.1016/j.ahj.2007.12.011PMID:
18371492.
11. Lemstra M, Blackburn D, Crawley A, Fung R. Proportion and risk indicators of nonadherence to statin therapy: a meta-analysis. The Canadian journal of cardiology. 2012; 28(5):574–80. Epub 2012/08/14. doi:10.1016/j.cjca.2012.05.007PMID:22884278.
12. Warren JR, Falster MO, Fox D, Jorm L. Factors influencing adherence in long-term use of statins. Phar-macoepidemiology and drug safety. 2013; 22(12):1298–307. Epub 2013/10/10. doi:10.1002/pds.3526
PMID:24105731.
13. Schedlbauer A, Davies P, Fahey T. Interventions to improve adherence to lipid lowering medication. The Cochrane database of systematic reviews. 2010;(3: ):CD004371. Epub 2010/03/20. doi:10.1002/ 14651858.CD004371.pub3PMID:20238331.
14. Brookhart MA, Patrick AR, Schneeweiss S, Avorn J, Dormuth C, Shrank W, et al. Physician follow-up and provider continuity are associated with long-term medication adherence: a study of the dynamics of statin use. Archives of internal medicine. 2007; 167(8):847–52. Epub 2007/04/25. doi:10.1001/ archinte.167.8.847PMID:17452550.
15. Brookhart MA, Patrick AR, Dormuth C, Avorn J, Shrank W, Cadarette SM, et al. Adherence to lipid-low-ering therapy and the use of preventive health services: an investigation of the healthy user effect. American journal of epidemiology. 2007; 166(3):348–54. Epub 2007/05/17. doi:10.1093/aje/kwm070
PMID:17504779.
16. Carey IM, DeWilde S, Shah SM, Harris T, Whincup PH, Cook DG. Statin use after first myocardial infarction in UK men and women from 1997 to 2006: Who started and who continued treatment? Nutri-tion, metabolism, and cardiovascular diseases: NMCD. 2012; 22(5):400–8. Epub 2011/01/05. doi:10. 1016/j.numecd.2010.09.010PMID:21194912.
17. Banks E, Redman S, Jorm L, Armstrong B, Bauman A, Beard J, et al. Cohort profile: the 45 and up study. International Journal of Epidemiology. 2008; 37(5):941–7. Epub 2007/09/21. doi:10.1093/ije/ dym184PMID:17881411; PubMed Central PMCID: PMC2557061.
18. Australian Government—Department of Health. Pharmaceutical Benefits Scheme (PBS)—About the PBS 2015 [cited 22 August 2015]. Available from:http://www.pbs.gov.au/pbs/about-the-pbs.
19. Australian Government—Department of Health. Fees, Patient Contributions and Safety Net Thresholds 2014 [cited 19 November 2014]. Available from: http://www.pbs.gov.au/info/healthpro/explanatory-notes/front/fee.
20. Australian Government—Department of Human Services. Concession and Health Care Cards 2015 [cited 22 August 2015]. Available from:http://www.humanservices.gov.au/customer/subjects/ concession-and-health-care-cards.
21. Mabbott V, Robinson M, Segrave A, Brennan Q. Australian Statistics on Medicines 2010 edition. Aus-tralian Government—Department of Health and Ageing; 2012.
22. Andrade SE, Kahler KH, Frech F, Chan KA. Methods for evaluation of medication adherence and per-sistence using automated databases. Pharmacoepidemiology and drug safety. 2006; 15(8):565–74; discussion 75–7. Epub 2006/03/04. doi:10.1002/pds.1230PMID:16514590.
23. WHO Collaborating Centre for Drug Statistics Methodology. ATC/DDD Index 2013 [cited 22 August 2015]. Available from:http://www.whocc.no/atc_ddd_index/.
24. Australian Institute of Health and Welfare. METeOR: Metadata Online Registry: Person—General Practitioner attendance indicator, yes/no code N 2015 [cited 12 June 2015]. Available from:http:// meteor.aihw.gov.au/content/index.phtml/itemId/603651.
25. Breslau N, Reeb KG. Continuity of care in a university-based practice. Journal of medical education. 1975; 50(10):965–9. Epub 1975/10/01. PMID:1159765.
26. Shortell SM. Continuity of medical care: conceptualization and measurement. Medical care. 1976; 14 (5):377–91. Epub 1976/05/01. PMID:1271879.
28. Menec VH, Sirski M, Attawar D. Does continuity of care matter in a universally insured population? Health services research. 2005; 40(2):389–400. Epub 2005/03/15. doi:10.1111/j.1475-6773.2005. 00363.xPMID:15762898; PubMed Central PMCID: PMC1361147.
29. Nyweide DJ, Anthony DL, Bynum JP, Strawderman RL, Weeks WB, Casalino LP, et al. Continuity of care and the risk of preventable hospitalization in older adults. JAMA internal medicine. 2013; 173 (20):1879–85. Epub 2013/09/18. doi:10.1001/jamainternmed.2013.10059PMID:24043127; PubMed Central PMCID: PMC3877937.
30. Spiegelman D, Hertzmark E. Easy SAS calculations for risk or prevalence ratios and differences. Amer-ican journal of epidemiology. 2005; 162(3):199–200. Epub 2005/07/01. doi:10.1093/aje/kwi188PMID:
15987728.
31. Zou G. A modified poisson regression approach to prospective studies with binary data. American jour-nal of epidemiology. 2004; 159(7):702–6. Epub 2004/03/23. PMID:15033648.
32. Stewart A, Kamberg CJ. Physical functioning measures. In: Stewart A, Ware J, editors. Measuring Functioning and Well-Being: the Medical Outcomes Study Approach. Durham (NC): Duke University Press; 1992.
33. Kessler R, Mroczek D. Final Version of our Non-Specific Psychological Distress Scale [memo dated 3/ 10/94]. Ann Arbor (MI): Survey Research Center of the Institute for Social Research: University of Michigan; 1994.
34. Australian Institute of Health and Welfare. Rural Regional and Remote Health: A guide to remoteness classifications. Canberra: Australian Institute of Health and Welfare; 2004.
35. Parsons LS. Performing a 1:N case-control match on propensity score. Twenty-Ninth Annual SAS1
Users Group International Conference; Cary, NC: SAS Institute Inc.; 2004.
36. van Walraven C, Oake N, Jennings A, Forster AJ. The association between continuity of care and out-comes: a systematic and critical review. Journal of evaluation in clinical practice. 2010; 16(5):947–56. Epub 2010/06/18. doi:10.1111/j.1365-2753.2009.01235.xPMID:20553366.
37. Hansen RA, Voils CI, Farley JF, Powers BJ, Sanders LL, Sleath B, et al. Prescriber continuity and med-ication adherence for complex patients. The Annals of pharmacotherapy. 2015; 49(3):293–302. Epub 2015/01/01. doi:10.1177/1060028014563266PMID:25549627.
38. Lai EJ, Grubisic M, Palepu A, Quan H, King KM, Khan NA. Cardiac medication prescribing and adher-ence after acute myocardial infarction in Chinese and South Asian Canadian patients. BMC cardiovas-cular disorders. 2011; 11:56. Epub 2011/09/20. doi:10.1186/1471-2261-11-56PMID:21923931; PubMed Central PMCID: PMC3189887.
39. Wisnivesky JP, Krauskopf K, Wolf MS, Wilson EA, Sofianou A, Martynenko M, et al. The association between language proficiency and outcomes of elderly patients with asthma. Annals of allergy, asthma & immunology: official publication of the American College of Allergy, Asthma, & Immunology. 2012; 109(3):179–84. Epub 2012/08/28. doi:10.1016/j.anai.2012.06.016PMID:22920072.
40. Dragomir A, Cote R, White M, Lalonde L, Blais L, Berard A, et al. Relationship between adherence level to statins, clinical issues and health-care costs in real-life clinical setting. Value Health. 2010; 13(1):87– 94. doi:10.1111/j.1524-4733.2009.00583.xPMID:19695008.
41. Mealing NM, Banks E, Jorm LR, Steel DG, Clements MS, Rogers KD. Investigation of relative risk esti-mates from studies of the same population with contrasting response rates and designs. BMC medical research methodology. 2010; 10:26. Epub 2010/04/02. doi:10.1186/1471-2288-10-26PMID:
20356408; PubMed Central PMCID: PMC2868856.
42. Tran DT, Jorm L, Lujic S, Bambrick H, Johnson M. Country of birth recording in Australian hospital mor-bidity data: accuracy and predictors. Aust N Z J Public Health. 2012; 36(4):310–6.
43. Ng SP, Korda R, Clements M, Latz I, Bauman A, Bambrick H, et al. Validity of self-reported height and weight and derived body mass index in middle-aged and elderly individuals in Australia. Australian and New Zealand journal of public health. 2011; 35(6):557–63. Epub 2011/12/14. doi:10.1111/j.1753-6405. 2011.00742.xPMID:22151163.