SM-ROM-GL (Strong Motion Romania Ground Level) Database
CONSTRUCŢII – No. 1 / 2015 3
SM-ROM-GL (STRONG MOTION ROMANIA GROUND LEVEL)
DATABASE
Ioan Sorin BORCIA1, Iolanda Gabriela CRAIFALEANU2,1, Elena-Andreea CALARASU 1, Nicoleta-Florenta TANASE 1, Ioan Constantin PRAUN 3
1
Dr., National Research and Development Institute URBAN-INCERC and European Center for Buildings Rehabilitation- ECBR, Bucharest, Romania
2
Assoc. Prof. Dr., Technical University of Civil Engineering Bucharest, Romania, [email protected]
3
Eng., National Institute for Research and Development “URBAN – INCERC” INCERC and European Center for Buildings Rehabilitation- ECBR, Bucharest, Romania, [email protected]
ABSTRACT
The SM-ROM-GL database includes data obtained by the processing of records performed at ground level by the Romanian seismic networks, namely INCERC, NIEP, NCSRR and ISPH-GEOTEC, during recent seismic events with moment magnitude Mw≥ 5 and epicenters
located in Romania. All the available seismic records were re-processed using the same basic software and the same procedures and options (filtering and baseline correction), in order to obtain a consistent dataset. The database stores computed parameters of seismic motions, i.e. peak values: PGA, PGV, PGD, effective peak values: EPA, EPV, EPD, control periods, spectral values of absolute acceleration, relative velocity and relative displacement, as well as of instrumental intensity (as defined bz Sandi and Borcia in 2011). The fields in the database include: coding of seismic events, stations and records, a number of associated fields (seismic event source parameters, geographical coordinates of seismic stations), links to the corresponding ground motion records, charts of the response spectra of absolute acceleration, relative velocity, relative displacement and instrumental intensity, as well as some other representative parameters of seismic motions. The conception of the SM-ROM-GL database allows for an easy maintenance; such that elementary knowledge of Microsoft Access 2000 is sufficient for its operation.
Keywords: seismic records; ground motion database
REZUMAT
Baza de date SM-ROM-GL include date obţinute prin procesarea înregistrărilor efectuate la nivelul terenului în reţelele seismice din România, şi anume cele ale INCERC, INCDFP, CNRRS şi ISPH-GEOTEC, în timpul evenimentelor seismice recente, cu magnitudine moment Mw≥ 5
şi epicentrele situate în România. Toate înregistrările seismice disponibile au fost re-prelucrate folosind acelaşi software de bază şi aceleaşi proceduri şi opţiuni (filtrare şi corecţie de linie de bază), în scopul obţinerii unui set de date coerente. Baza de date stochează parametrii calculaţi ai mişcării seismice, şi anume: valorile de vârf, PGA, PGV, PGD, valorile efective de vârf: EPA, EPV, EPD, perioadele de control, valorile spectrale ale acceleraţiei absolute, vitezei relative şi deplasării relative, precum şi a intensităţii instrumentale (aşa cum este definită de Sandi şi Borcia în 2011). Câmpurile din baza de date includ: codurile evenimentelor seismice, staţiilor şi înregistrărilor, un număr de câmpuri asociate (parametrii sursei seismice, coordonatele geografice ale staţiilor seismice), legături către înregistrările seismice, diagrame ale spectrelor de răspuns ale acceleraţiilor absolute, vitezelor relative, deplasărilor relative, intensităţilor instrumentale etc. Concepţia bazei de date SM-ROM-GL permite o întreţinere uşoară; astfel, cunoaşterea elementară a programului Microsoft Access 2000 este suficientă pentru gestionarea acesteia.
Cuvinte cheie: înregistrări seismice; bază de date cu mişcări seismice
1.INTRODUCTION
The SM-ROM-GL database contains results obtained by the processing of earthquake ground motions, recorded by the seismic networks of Romania (INCERC - now
I.S. Borcia, I. G. Craifaleanu, E. A. Calarasu, N. F. Tanase, I. C. Praun
CONSTRUCŢII – No. 1 / 2015
4
Development URBAN-INCERC and ISPH-GEOTEC). The records were obtained at ground level, during strong seismic events with moment magnitude Mw ≥ 5 and with
epicenters situated in the Vrancea and Banat seismogenic zones. New numerical processing methodologies were developed and applied to the records of these earthquakes (i.e. instrumental intensity spectra averaged over various period intervals, response spectrum-based intensities, Arias intensities, destructiveness spectrum-based intensities), being used in defining the seismic action for building research and design and for a better understanding of the structural behavior of buildings during strong Vrancea and Banat earthquakes.
2.ADVANCED PROCESSING OF SEISMIC RECORDS OBTAINED AT GROUND LEVEL
First, the initial processing of the recorded accelerograms was performed, i.e. the time-histories (corrected by using an Ormsby filter with 0.16 Hz as Corner Frequency and 25 Hz as Terminal Frequency) of acceleration, velocity and displacement were obtained. Then, the calculation of peak acceleration,
pga, peak velocity, pgv, peak displacement,
pgd, for the records obtained at ground level and the secondary processing of accelerographic information were performed. Consequently, response spectra (absolute acceleration response spectra, Saa, relative velocity response spectra, Svr, and relative displacement response spectra, Sdr) were computed.
Based on these spectra, the “effective” values were estimated, i.e. effective peak ground acceleration, epa, effective peak ground velocity, epv, effective peak ground displacement, epd (all as defined in the Romanian P100-1/2013 seismic design code), according to the following relations:
5 . 2 / ) S
( aaaveraged on0.4s max
epa = (1)
5 . 2 / ) S
( vraveraged on0.4s max
epv= (2)
5 . 2 / ) S
( draveraged on0.4s max
epd = (3)
The above quantities were obtained by averaging the response spectra computed for a damping ratio n=5%, where (0.4 s) represents the moving average for a 0.4 s time window, performed on the 0.1 s … 4.0 s range. Based on these quantities, the control periods, TC and
TD, were computed as follows.
(
epv epa)
TC =2π / (4)
(
epd epv)
TD =2π / (5)
Additionally, instrumental intensity measures were computed (Sandi and Borcia, 2011a, Sandi and Borcia, 2014), as shown in the following.
1. Global instrumental intensities
The global intensity based on response spectrum, IS, a measure of ground motion
severity, is defined by using the following parameters: 5 . 2 / ) 05 . 0 , ( max ) /
(m s2 S T
EPAM = T aa (6)
5 . 2 / ) 05 . 0 , ( max ) /
(m s2 S T
EPVM = T va (7)
5 . 2 / ) 05 . 0 , ( max ) /
(m s2 S T
EPDM = T dr (8)
where:
- Saa(T,n) is the absolute acceleration response spectrum and Sva(T,n) is the absolute velocity spectrum, both expressed as functions of period and damping ratio; - Sdr(T,n) is the relative displacement
spectrum, expressed as a function of period; n is the damping ratio, and max T
is the maximum spectral value, for periods,
T, between 0.0625 s and 4.0 s. 0 . 8 ) (
log6 ⋅ +
= EPAM EPVM
IS (9)
1.2. Arias-type intensity:
∫
+=log6 [w ]2dt 7.05
IA g (10)
where wg (t) is the ground acceleration on a
SM-ROM-GL (Strong Motion Romania Ground Level) Database
CONSTRUCŢII – No. 1 / 2015 5
2. The following quantities were computed, as well, for intensities depending on the frequency φ (Hz).
2.1. Response spectrum-based intensity, is(φ):
( )
ϕ =log6[ aa(ϕ,0.05)⋅ va(ϕ,0.05)]+7.75s S S
i (11)
2.2. Destructivity spectrum-based intensity,
id(φ), determined from the (absolute) accelerogram wa (t,φ,0.05), for a pendulum
having the natural (undamped) frequency φ and a damping ratio of 0.05,
∫
+=log [ ( , ,0.05) ] 6.25
)
( 6 w2 t dt
id ϕ a ϕ (12)
3. Intensities based on the application of the averaging rule on a specified frequency band (φ', φ") were computed as well, using the following expressions.
3.1. For the response spectrum-based intensity,
is(φ):
{
}
75 . 7 ] / ) 05 . 0 , ( ) 05 . 0 , ( [ ) " , ' ln( / 1 log ) " , ' ( 6 * + + ϕ ϕ ϕ ⋅ ϕ ϕ ϕ ϕ = = ϕ ϕ∫
S d S di
va aa
s
(13)
3.2. For the destructivity-based intensity, id(φ):
{
}
25 . 6 ] / ) ) 05 . 0 , , ( [( ) " , ' ln( / 1 log ) " , ' ( 2 6 * + + ϕ ϕ ϕ ϕ ϕ = = ϕ ϕ∫ ∫
w t dt di
a d
(14) 4. Averaging rules for the two horizontal orthogonal directions were also provided.
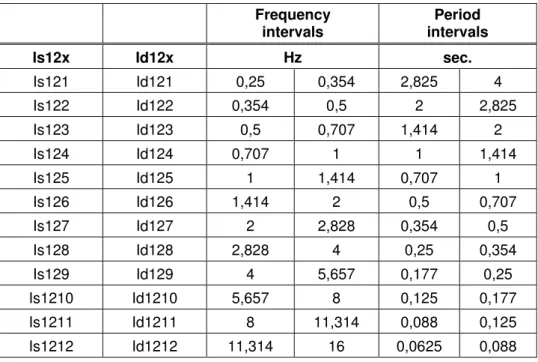
The following notations were used, as shown in the tables below:
Id1 = id*(0.25 Hz, 16.0 Hz)
for the averaging on the whole interval (0,0625 sec…4,0 sec) and
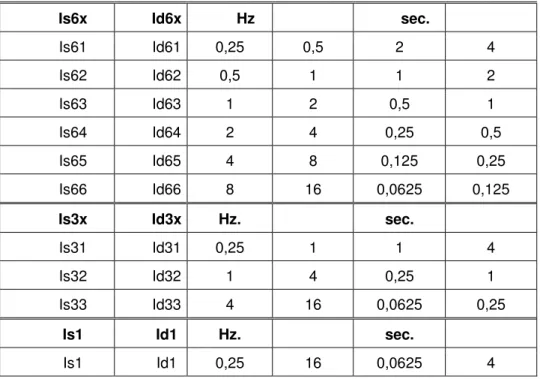
Id31= id*(0.25 Hz, 1.0 Hz)
Id32= id*(1.0 Hz, 4.0 Hz)
Id33= id*(4.0 Hz, 16.0 Hz),
for the averaging on 3 periods interval (i.e. (1… 4 sec), (0.25… 1 sec) and (0.0625…0.25 sec)).
Similar notation conventions were used for averaging on 6 and 12 intervals, respectively.
Table 1. Averaging intervals for instrumental intensities
Frequency intervals
Period intervals
Is12x Id12x Hz sec.
Is121 Id121 0,25 0,354 2,825 4
Is122 Id122 0,354 0,5 2 2,825
Is123 Id123 0,5 0,707 1,414 2
Is124 Id124 0,707 1 1 1,414
Is125 Id125 1 1,414 0,707 1
Is126 Id126 1,414 2 0,5 0,707
Is127 Id127 2 2,828 0,354 0,5
Is128 Id128 2,828 4 0,25 0,354
Is129 Id129 4 5,657 0,177 0,25
Is1210 Id1210 5,657 8 0,125 0,177
Is1211 Id1211 8 11,314 0,088 0,125
I.S. Borcia, I. G. Craifaleanu, E. A. Calarasu, N. F. Tanase, I. C. Praun
CONSTRUCŢII – No. 1 / 2015
6
Table 1 (cont’d). Averaging intervals for instrumental intensities
Is6x Id6x Hz sec.
Is61 Id61 0,25 0,5 2 4
Is62 Id62 0,5 1 1 2
Is63 Id63 1 2 0,5 1
Is64 Id64 2 4 0,25 0,5
Is65 Id65 4 8 0,125 0,25
Is66 Id66 8 16 0,0625 0,125
Is3x Id3x Hz. sec.
Is31 Id31 0,25 1 1 4
Is32 Id32 1 4 0,25 1
Is33 Id33 4 16 0,0625 0,25
Is1 Id1 Hz. sec.
Is1 Id1 0,25 16 0,0625 4
Numerical values for the seismic records of Vrancea and Banat earthquakes with moment magnitude Mw ≥ 5, obtained from
seismic networks in Romania (INCERC, NIEP, NCSRR and ISPH-GEOTEC), were determined by using software applications developed at INCERC. The numerical values and the graphical information thus obtained were used to create four MS Excel tables (SM-ROM-GL.xls) and a MS Access database (SM-ROM-GL.mdb).
3.DATABASE STRUCTURE
The adopted codifications and the fields associated with various information in the database are given in the following.
- Seismic events (source parameters) are given in the table SM-ROM-GL Earthquakes (containing information on the 11 earthquakes with Mw ≥ 5 that
occurred between 1977 and 2009, 8 with epicenters located in the Vrancea seismogenic zone and 3 with epicenters located in the Banat seismogenic zone) (Fig. 1).
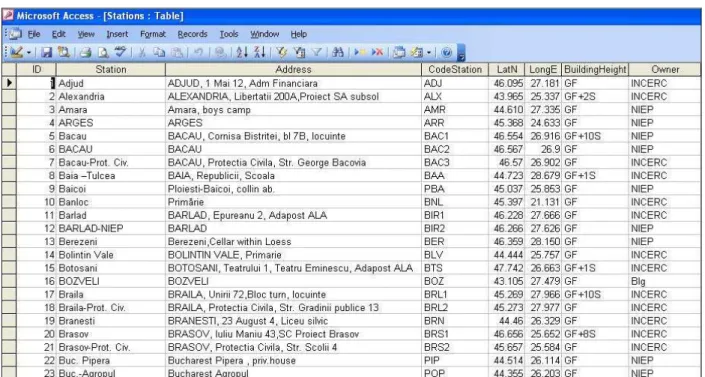
- Seismic stations (geographical coordinates, station code) are given in the table
SM-ROM-GL Stations (containing information on the 166 stations that provided at least one record in one of the earthquakes listed in the table
SM-ROM-GL Earthquakes) (Fig. 2). - Seismic records are given in table
SM-ROM-GL Records (Fig. 3), containing information on the 307 records obtained from the networks in Romania, Bulgaria and Moldova. The records were obtained at the above seismic stations during the mentioned earthquakes. For these records, charts are provided for absolute acceleration response spectra, relative velocity spectra and displacement spectra, as well as for instrumental intensity spectra.
- Representative parameters of seismic motion (peak values and "effective" values of acceleration, velocity and displacement, global instrumental intensities and intensities averaged on various period intervals and spectral values for periods whit ΔT = 0.05 sec.) are given in the table
SM-ROM-GL Components (Fig. 4), containing information on the 920 components of the records in the table
SM-ROM-GL (Strong Motion Romania Ground Level) Database
CONSTRUCŢII – No. 1 / 2015 7
Fig. 1. Screenshot of table SM-ROM-GL Earthquakes
Fig. 2.Screenshot of table SM-ROM-GL Stations
I.S. Borcia, I. G. Craifaleanu, E. A. Calarasu, N. F. Tanase, I. C. Praun
CONSTRUCŢII – No. 1 / 2015
8
Fig. 4.Screenshot of table SM-ROM-GL Components
a) b)
c) d)
SM-ROM-GL (Strong Motion Romania Ground Level) Database
CONSTRUCŢII – No. 1 / 2015 9
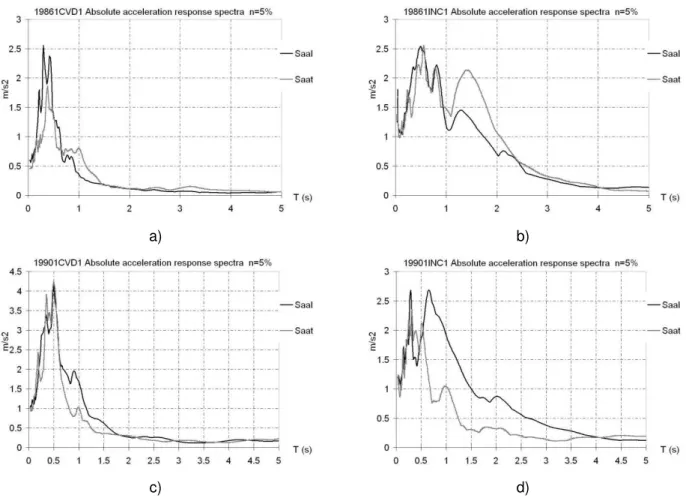
e) f)
Type (a) station: Cernavoda Town Hall Type (b) station: INCERC Bucharest
Fig. 5 (continued). Absolute acceleration response spectra for two distinct types of sites, computed for ground motion records obtained during the strong Vrancea earthquakes of 19771, 19861 and 1990 (1 and 2)
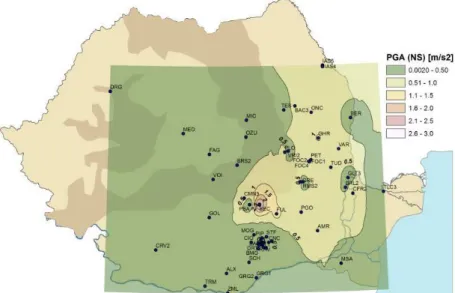
Fig. 6. Map of peak ground acceleration values (PGA) for the Vrancea earthquake of October 27, 2004 (NS components)
I.S. Borcia, I. G. Craifaleanu, E. A. Calarasu, N. F. Tanase, I. C. Praun
CONSTRUCŢII – No. 1 / 2015
10
4.EXAMPLES OF USE OF THE SM-ROM-GL DATABASE
The use of the information stored in the SM-ROM-GL database is first illustrated by an example that demonstrates the use of the provided spectral charts for observing differences between ground motion frequency content recorded on distinct types of sites.
According to previous studies of Sandi and Borcia (2011b), it was shown that, for seismic stations located in areas affected by strong subcrustal Vrancea earthquakes, the following classification of sites is adequate:
− type (a) sites, where a layer interface with a marked contrast of shear wave propagation velocity is identified; for these sites, a relatively stable spectral content is observed, for several strong events; a representative station for this site type is Cernavoda Town Hall;
− type (b) sites, where such an interface cannot be identified and a variability of spectral content characteristics is observed, from an event to another; a representative station for this site type is INCERC Bucharest.
The absolute acceleration spectra of ground motion records obtained during the strong Vrancea earthquakes of 1977, 1986 and 1990 are shown in Fig. 5, as provided in the SM-ROM-GL database for the two representative stations above.
Due to the inclusion of the geographical coordinates of seismic stations, the spatial distribution of the values provided in the database can also be easily obtained.
Examples are given in Fig. 6, where the map of effective peak ground acceleration values (EPA) for the Vrancea earthquake of October 27, 2004 (Mw = 6.0) is shown, and in
Fig. 7, where the map of effective peak ground acceleration values (EPA) is presented, for the same earthquake.
5.CONCLUDING REMARKS
The maintenance of the SM-ROM-GL database and the addition of new records to be obtained in the future will be provided by the developers. The database, along with the users’ guide, will be soon available on the BIGSEES project website (http://infp.infp.ro/ bigsees/default.htm), becoming thus accessible to any potential user.
ACKNOWLEDGEMENTS
Funding for this research was provided by the Romanian Ministry of National Education, UEFISCDI Agency, under the Contract Number 72/2012, Project BIGSEES. This support is gratefully acknowledged.
This paper was presented at the Second European Conference on Earthquake Engineering and Seismology, 2ECEES, August 24-29, 2014, Istanbul, Turkey.
REFERENCES
1. Sandi, H., Borcia, I.S., Intensity spectra versus response spectra. Basic concepts and applications, Pure and Applied Geophysics, 168(1-2):261-287, 2011a.
2. Sandi, H., Borcia, I.S., A summary of instrumental data on the recent strong Vrancea earthquakes, and implications for seismic hazard, Pure and Applied Geophysics, 168(3-4): 659-694, 2011b.