2004Institute of Mathematics and Informatics, Vilnius
The Effects of Pair Programming on Learning
Efficiency in Short Programming Assignments
Subbaraya KUPPUSWAMI
Department of Computer ScienceRamanujam School of Mathematics and Computer Science, Pondicherry University Pondicherry – 605 014, India
e-mail: [email protected]
Kalimuthu VIVEKANANDAN
Department of Computer Science and Engineering and Information Technology Pondicherry Engineering College
Pondicherry – 605 014, India e-mail: [email protected]
Received: April 2004
Abstract. Pair programming is one of the important practices of a lightweight development methodology namely eXtreme Programming (XP). It emphasizes the practice of two persons work-ing together at a swork-ingle computer terminal, to design, code and test computer programs. The effects of pair programming on software development in industrial organizations were studied and it was found that pair programming increases the productivity by 15%. This evidence created an interest in amongst community of computer science educators to apply pair programming in educational settings.
We have conducted an experiment with the students of computer science courses to compare the learning efficiency of students when they adopt pair programming with that of students using tradi-tional method to do laboratory exercises of short duration. The learning efficiency was measured by evaluating design documents, completion time, and marks obtained in a written test that was con-ducted after every exercise. Our research confirms that the adoption of pair programming improves the design ability, reduces time taken to do a laboratory exercise and increases the knowledge and programming skill.
Key words:extreme programming (XP), pair programming, computer science education, teaching methodology for laboratory courses.
1. Introduction
one of the important and innovative practices of XP. The pair programming refers to the practice of two developers working together in a single computer terminal to develop and test programs. The roles of pair programming are driver and navigator where the driver writes the code and the navigator helps the driver and looks for errors (Beck, 2000). The effects of pair programming on software development in industrial organizations were studied and it was found that pair programming increases the productivity by 15% (Cockburn and Williams, 2000). This evidence created an interest in the community of computer science educators to apply pair programming in educational settings.
Recently, many researchers have explored the suitability of pair programming to con-duct the programming laboratory classes in educational institutions. The pair program-ming can be considered as one form of collaborative learning. In collaborative learn-ing, small groups of students associate with each other where each member contributes his/her personal experience, information, perspective, insight, skills and attitudes, which can help, improve the learning efficiency of others (Klemm, 1994). When this kind of collaborative learning is adopted to do programming assignments, generally the students divide the work among them and complete it individually with little or no help from other students of the group. However, pair programming of XP, differs from the above form of collaborative learning. It insists that the entire program development (designing, coding, and testing) is to be carried out by two students (programmers) sitting side by side at single terminal.
Research on pair programming in academic environment has been carried out in two directions. In one direction, the researchers collected opinions of the students about pair programming and analyzed its impact (Melnik and Maurer, 2002; Sanders, 2001; Williams and Kesler, 2000; Peter, 2002; Timothy, 2003; Thomas et al., 2003; Frank, 2002; Lyndaet al., 2003). In the other direction, the researchers analyzed the academic performance of the students through formal experiments when they adopt pair program-ming for doing their programprogram-ming assignments (McDowellet al., 2002; Williamset al., 2002; Nawrocki and Wojciechowski, 2001; Matthias and Walter, 2001).
Most of the research works listed above was done in a context with two or three laboratory exercises that were spread over the entire semester. Such exercises are called long duration exercises. In this paper, we consider shortdurationexercises, which are generally conducted at one stroke without a break under the supervision of a laboratory instructor. Table 1 shows how long duration exercises differ from short duration ones.
Even though, the empirical evidence supports the effectiveness of pair programming in laboratory classes for long duration exercises, the extent to which this pair program-ming is beneficial in laboratory exercises of short duration is to be investigated. Moreover, the previous studies on pair programming have the following limitations:
Table 1
Comparison of long and short duration laboratory exercises Long-Duration Exercises Short-Duration Exercises Available time to complete an exercise is
general-ly more. Generalgeneral-ly the students have to demon-strate the working of the programs to the labora-tory instructor at the end of the semester.
Available time to complete an exercise is fixed and less. Generally, the students have to demon-strate the working of the programs at the end of the laboratory session to the laboratory instructor (normally 3-hour duration).
Students can work as per their schedule to com-plete the exercises. They may even work at home even if resources are available.
Students have to work in the institution under the supervision of the instructor without a break.
The long duration exercises are framed to impart a complete system level understanding.
The short duration exercises are framed in such a way that each exercise imparts a small teach-ing element such as a concept, technique, or pro-gramming skill.
• correctness (the extent to which the design represents the requirements
cor-rectly);
• completeness (the extent to which the design represents the requirements
completely).
2. When pair programming is used in long duration laboratory exercises, the students have to work together both at educational institutions and at home. In this kind of environment, the students had reported that it was difficult to find time to meet and work together (Sanders, 2001). Here, the instructor has little control over the students’ working patterns. This factor can become a severe internal validity con-straint and this concon-straint has not been handled adequately in previous research works.
3. Most of the previous researches have evaluated the effectiveness of pair program-ming by measuring the characteristics of the product (computer programs) that were developed by the students. Each of the products was delivered by a pair. How-ever, to prove that pair programming is an effective learning methodology, it should also improve the individual students’ subject knowledge and programming skills. Only, very few attempts have been made to measure the individual performance (Mcdowellet al., 2002; Williamset al., 2002). They measured individual student performance only at the final semester examination. However, the time difference between the final semester examination and the actual conduction of pair program-ming experiment was high and this factor may become severe internal validity constraint. This severe internal constraint had not been accounted for.
We have conducted a study to evaluate the effects of pair programming. The study involves the comparison of pair programming with traditional method. Here, the tradi-tional method is referring tosolo programmingwhere only one student is involved in the development of a program for a laboratory exercise. Thus, the focus of the present study was to compare the learning efficiency of the students when they adopt pair programming with that of traditional method for doing short-duration laboratory exercises.
The rest of the paper is organized as follows. In Section 2, the research method is briefly explained. Section 3 describes the study conducted to test the proposed hypothe-ses. It includes the description of experimental design, threats, data collection procedures, and the execution of the experiment. The results of the experiment are presented in Sec-tion 4. SecSec-tion 5 discusses the implicaSec-tion of the results. A brief conclusion is given in Section 6.
2. Research Approach
In the present study, we considered the following three parameters as learning efficiency: 1) the subject knowledge and programming skill that are gained by the individual
student;
2) quality of the design;
3) time taken to complete the exercises.
In order to evaluate the learning efficiency we propose the following hypotheses.
Hypothesis 1:The quality of design for laboratory exercises is better when the stu-dents adopt pair programming than that of stustu-dents using traditional method.
Hypothesis 2:The students who adopt pair programming complete the laboratory exercises faster than the students who adopt traditional method.
Hypothesis 3:The subject knowledge and programming skill that are gained by a student who uses the pair programming are higher than that of a student who uses the traditional method.
3. Experiment
3.1. Experimental Design
3.1.1. Variables
Independent Variable: The independent variables represent the cause for the effect in any experiment. The effect in our study is learning efficiency and the conjectured cause is the learning methodology. Thus, the independent variable for our study is learn-ing methodology. In the present study, we were interested in manipulatlearn-ing the learnlearn-ing methodology to find its effect on learning efficiency. Out of the three different ways of manipulating the independent variable (Johnson and Christensen, 2003), we have chosen the type technique in which we varied the type of the condition or treatment adminis-tered. The two types of independent variables for our study were pair programming and traditional method.
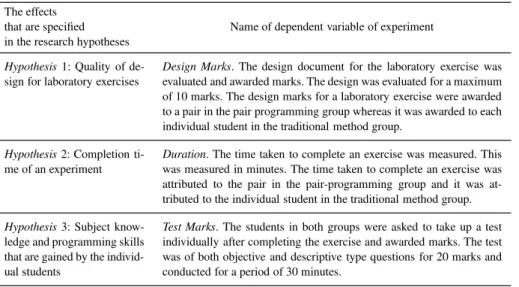
Dependent Variables:Dependent variables represent the effects that are specified in the hypotheses. The effects that are specified in the hypothesis and the corresponding dependent variables are given in Table 2.
Apart from these variables, cumulative percentage of marks for each student was also obtained. The cumulative percentage of marks is computed by the total marks scored in all subjects up to the semester in which a student is studying divided by the total num-ber of subjects. The computed fraction is represented as a percentage. This cumulative percentage of marks was used to verify for the equivalence of two groups and the exis-tence of a covariate. The covariate is a variable whose effect has not been studied but it influences the outcome of an experiment (David, 1995).
Table 2 Dependent variables The effects
that are specified in the research hypotheses
Name of dependent variable of experiment
Hypothesis1: Quality of de-sign for laboratory exercises
Design Marks. The design document for the laboratory exercise was evaluated and awarded marks. The design was evaluated for a maximum of 10 marks. The design marks for a laboratory exercise were awarded to a pair in the pair programming group whereas it was awarded to each individual student in the traditional method group.
Hypothesis2: Completion ti-me of an experiti-ment
Duration. The time taken to complete an exercise was measured. This was measured in minutes. The time taken to complete an exercise was attributed to the pair in the pair-programming group and it was at-tributed to the individual student in the traditional method group.
Hypothesis3: Subject know-ledge and programming skills that are gained by the individ-ual students
Quantification of Improvement in Learning Efficiency:The improvement in learn-ing efficiency (if any) of the pair-programmlearn-ing group compared to that of the traditional method group is quantified by adopting the following steps:
1. The improvement in the design marks (if any) due to the adoption of pair pro-gramming is expressed as the percentage difference between the mean values of design marks of pair programming and traditional method. In the same way, the improvement in completion time and test marks was computed.
2. Weights are assigned to the three values (computed in step 1) as follows:
Weights of 20%, 60% and 20% are assigned to the improvement of the design marks, completion time and test marks, respectively. The higher weight is assigned to the completion time as it involves the coding and testing skills. The weighing scheme is based on the evaluation pattern that is generally adopted in evaluating the students in the final semester examinations.
3. The improvement in learning efficiency is computed by finding the weighted aver-age of three independent variables as shown below:
The improvement in the learning efficiency
=((Improvement of the design marks in percentage X 20)
+(Improvement of the duration in percentage X 60)
+(Improvement of test marks in percentage X 20))/(20 + 60 + 20).
3.1.2. Design
We used the two-group single factor posttest-only design (William, 2000). The overview of the experimental design is given in Table 3. The selected students from the sampling process were randomly assigned to two different groups. Hence, the two groups were equivalent in all respects. The two groups were administered two different types of learn-ing methodologies: traditional method and pair programmlearn-ing. The students in the tradi-tional group were asked to work individually and the students in the pair-programming group were asked to work in pairs. In pair programming, programmers have to interact closely. In such situation the composition of pair, plays a major role for effective learn-ing. In software industry the successes of pair programming depends on the personality traits of pair partners (Dick and Zarnett, 2002). Even in academic environment, we be-lieve that choosing of pair partner plays a major role for effective learning. The random
Table 3
Overview of experimental design
Pair Programming Group Traditional Method Group Treatment Adopted Pair Programming Adopted Solo Programming Task Laboratory exercise of three hour duration
and a written test
Laboratory exercise of three hour duration and a written test
assignment of the partners to a pair may lead to an incompatible pair and it may pose an internal validity threat to the present experiment. In order to avoid this internal validity threat, the students were asked to form pairs based on the findings of the pilot study by the authors (Kuppuswami and Vivekanandan, 2002). The findings of the pilot study that were relevant to the design of the present experiment are given below:
1. Students prefer pair programming with the partners of same or higher academic achievement level.
2. Students prefer pair programming with the partners of the same gender.
3. Attitudes of female students do not differ significantly from that of male students.
3.1.3. Subjects
The concerned population for this study includes all the students who have software oriented laboratory subjects such as Programming Languages, Internet Programming, Database Programming and System programming laboratories. Due to the practical diffi-culties, the study was restricted only within the Department of Computer Science & En-gineering and Information Technology, Pondicherry EnEn-gineering College, Pondicherry, India. The department offers B.Tech (Bachelor of Technology) and M.C.A (Master of Computer of Applications) courses. The durations of B.Tech and M.C.A courses are three and four years, respectively. The students were from different parts of the country speak-ing different languages. The medium of instruction is English. The laboratory exercises for these students are of three hours duration. The students were divided into batches (around 22 students per batch) to do laboratory exercises.
Sampling:The process of selecting students from the original population, to partic-ipate in the experiments is known as sampling. We have adopted a quota sampling (Jo-honson, 2003), which is a non-random sampling technique. It involves setting of quotas and then using convenience sampling to obtain those quotas. The convenience sampling (Johonson, 2003) simply involves using the people who are the most available or the most conveniently selected. Based on the above method of sampling we have selected the students to participate in the experiments as shown in Table 4. However, the fourth year (final year) of B.Tech students and third year (final year) of MCA students were not considered as they generally have long duration exercises.
Table 4
Selected students from sampling process
Course Year Number of batches Number of students
B.Tech First 3 70
Third 5 96
M.C.A First 1 26
Second 1 22
3.2. Experiment Instrumentation and Preparation
The activities concerned with the preparation of the experiment including the preparation of instruments are described below:
1. The selected batches of students were given a lecture about pair programming for about an hour. In the lecture, students were taught about the roles of pair pro-gramming. They were also asked to practice pair programming for one laboratory session before the conduct of the actual experiment.
2. The test cases for the exercises were finalized by the laboratory instructor. 3. The laboratory exercises that were conducted for the present study were framed as
shown in Table 5. The selected students were assigned different exercises, based on the course and the year of study. The assignment of different questions rather than the same question to the students has posed an internal validity threat to our experiment. However, we have foreseen this threat and handled the threat as we explain in Section 3.4.
4. The question papers (objective and descriptive) were prepared for conducting a test on completion of the exercises. The questions were coined in such a way to test the knowledge gained in the subject and programming skills.
The next section describes the conduct of the experiment and the data collection pro-cess.
3.3. Conduct of Experiment and Data Collection
The experiments were conducted in different time slots. Students of each batch were randomly divided into two groups: pair programming versus traditional method. The stu-dents who adopted pair programming were requested to switch the roles of navigator and driver whenever it was required. The students were made to know the exercises only at the beginning of laboratory classes. The general workflow in doing the short-duration exercises consists of the following sequence of the activities:
Table 5
Laboratory exercises conducted Course and the
year of study
Number of
batches Laboratory Exercise B.Tech, first year 3 batches Array operations in C language
B.Tech, second year 3 batches Creation of database and accessing information through JDBC for SQL queries in Java language
B.Tech, third year 2 batches Graphical simulation of CPU scheduling algorithms with user interface in Visual Basic
1. The students have to prepare a design document. The design is represented by struc-ture charts and flowcharts and/or algorithms. The design document is evaluated for 10 marks by laboratory instructors. The design document is evaluated based on the completeness and correctness of the design. Any incomplete or wrong design is indicated to the students and they are asked to redo the design document correctly. Each pair in the pair-programming group will submit only one design document. 2. After submitting the design documents, the students directly key-in the code
with-out writing the programs in notebooks. During programming, they can check syn-tax errors of the programs. The students may decide about the test cases either before or after writing the programs. On completion of programming, the students can use their test cases to test the programs. Once they are satisfied with the work-ing of the programs, they have to demonstrate the correctness by executwork-ing the programs with the test cases of the instructor. If any errors are found then the in-structor asks the students to correct it. The exercise is considered as completed if all test cases for the exercise run successfully. The completion time is noted in min-utes. The programs are evaluated for only the correctness criteria and not for any other quality factor such as coding style, etc.
3. As soon as a student or a pair completes an exercise, the students were immedi-ately asked to take up the test individually in paper for half an hour. The tests are evaluated for examination of 20 marks.
3.4. Threats
Threats to validity are factors beyond our control that can affect the dependent variables. Such threats can be considered unknown independent variables causing uncontrolled ri-val hypotheses to exist in addition to the research hypotheses. One crucial step in an experimental design is to minimize the impact of these threats (Basisliet al., 1996). Two different classes of threats to validity are threats tointernalvalidity and threats toexternal validity. The threats that we anticipated and tried to control are explained below.
3.4.1. Internal Validity Threats
The two-group design of our experiment eliminates many of the internal validity threats (William, 2000). However, we found that there were still some other internal validity threads in our experiments and they were handled as explained below.
study. We have also ensured that the batches chosen for our experiment in a year have been taught by the same teacher.
Threat due to Selection:We have used the random assignment of subjects to groups. Each student in a batch was assigned randomly to either the pair-programming group or the traditional method group. The test for the equivalence of two groups is done and is explained in Section 4.
3.4.2. External Threat
Generally, the students in the department were very cordial to each other and they are ready to help each other. If this kind of environment does not exist, the results of our experiment are not valid.
4. Data Analysis
Equivalence of Two Groups
Even though the random assignment of subjects (students) to the two groups ensures equality, it is good to check the equality of the two groups (pair programming group and traditional method group) using some other parameter. We have decided to use aca-demic achievement level of the students as the parameter. For the present study, the academic achievement level is represented by the cumulative percentage of the marks. For uniformity, the Cumulative Grade Point Average (C.G.P.A) of M.C.A students was converted into cumulative percentage of marks through interpolation using conversion Table 6 (Delhi, 2000).
The independentt-tests are applied and the results of thet-tests indicate that the two groups do not differ significantly with respect to academic achievement level at 95% confidence level.
Checking of a Covariate
The cumulative percentage of marks of a student was not a factor in our design. Since the cumulative percentage of marks represents the academic achievement level of the
Table 6
Conversion table for C.G.P.A to percentage of marks C.G.P.A Percentage of marks
5.75 50.0
6.25 55.0
6.75 60.0
7.50 70.0
8.00 75.0
8.50 80.7
students, it may influence the output variables. If the cumulative percentage of marks in-fluences the outcome of the experiment considerably, it should be included as a covariate in our analysis. In order to test the extent of influence of the cumulative percentage of marks on the output (dependent) variables, the correlation relationship between percent-age of marks and the output (dependent) variables are to be computed. The computed correlation coefficients indicate that there exists no significant correlation between cu-mulative percentage marks and the dependent variables (design marks, duration and test marks). Hence, cumulative percentage of marks has not been considered as covariate.
4.1. Testing of Hypotheses
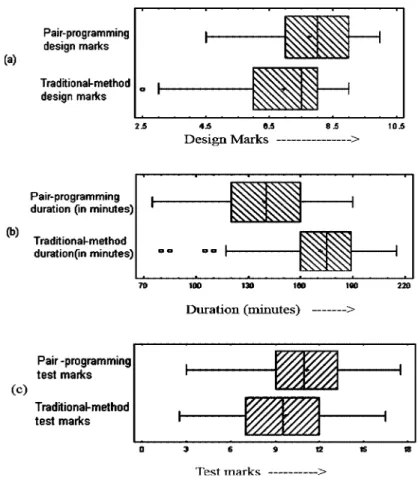
The box plots for the collected data of the dependent variables are shown in Fig. 1. The box plots show the individual data points, 10 and 90 percent quartiles (as whiskers), 25 and 75 percent quartiles (by the edges of the box), and the mean (by a cross line in the box). The outlier points in the data were identified and no abnormality has been found. Hence, the outlier points were also included for analysis.
Hypothesis1: The quality of design for laboratory exercises is better when the students adopt pair programming than that the traditional method to do laboratory exercises of short duration. In our experiment thedesign marks, a dependent variable represents the quality of the design of the laboratory exercises. In order to prove the hypothesis we look for significant difference in the mean values of design marks between the two groups. This can be expressed using the following statistical hypotheses:
Null Hypothesis MDM P P G=MDM T M G,
Alternate Hypothesis MDM P P G> MDM T M G,
whereMDM P P G– Mean value of Design Marks of Pair Programming Group,
MDM T M G– Mean value of Design Marks of Traditional Method Group.
Hypothesis2: The students who adopt pair programming complete the laboratory exercises faster than the students who adopt the traditional method. In the present study a dependent variable,duration, was used to measure the time (minutes) taken to complete an exercise. Our aim is to check whether the mean value of the completion time of the pair-programming group is significantly lower than that of the traditional group. This can be expressed by the following statistical hypotheses:
Null Hypothesis MDP P G=MDT M G,
Alternate Hypothesis MDP P G< MDT M G,
whereMDP P G– Mean value of Duration of Pair Programming Group,
MDT M G– Mean value of Duration Time of Traditional Method Group.
necessary to look for a significant difference between the mean values of two groups in the test marks. In order to do so the null and alternate hypotheses are specified as follows:
Null Hypothesis MT M P P G=MT M T M G,
Alternate Hypothesis MT M P P G> MT M T M G,
whereMT M P P G– Mean value of Test Marks of Pair Programming Group,
MT M T M G– Mean value of Test Marks of Traditional Method Group.
Thet-tests were applied on design marks, duration and test marks individually to test the statistical hypothesis. The results of the test parameters are shown in Table 7. From the table, it is clear thatp-value for all the threet-tests is less than 0.05. Hence, we reject null hypotheses and accept the alternate hypotheses at the significance level of 95%. This in turn leads to the acceptance of the three hypotheses.
Table 7
Testing parameters for hypotheses
Number of Students/Pair Mean Standard deviation Standard error Hypothesis testing parameters Pair Programming
58 pairs MDM P P G= 7.74 1.37 0.18 Hypothesis 1
(Design Marks)
t-value = 3.31, degrees of freedom=133, p= 0.001, significance level=0.05, difference in mean=0.798 Traditional
method
98 students MDM T G= 6.94 1.59 0.16
Pair Programming
58 pairs MDP P G= 138.9 26.4 3.5 Hypothesis 2
(Duration)
t-value=−7.33, degrees of freedom = 122, p-value =0.0, significance level = 0.05, difference in mean=−32.5 Traditional
method
98 students MDT M G= 171.4 27.3 2.8
Pair Programming
116 Students MT M P P G= 11.14 3.03 0.28 Hypothesis 3
(Test Marks)
t-value = 3.35, degrees of freedom = 195, p= 0.0, significance level = 0.05, difference in mean =1.492 Traditional
method
98 pairs MT M T M G= 9.65 3.42 0.35
5. Discussion and Recommendations
The mean values of design marks, test marks and duration to complete an exercise are given in Table 7. From the mean values it can be inferred that there is, an increase of 13% in the test marks and 11% in the design marks due to pair programming. In addition, students of the pair-programming group complete their programs earlier by 19% than that of the students who adopt the traditional method.
The improvement noted above in the mean values of the dependent variables between two groups is also used to quantify the improvement of learning efficiency as described in the Section 3.1.1. The improvement in learning efficiency due to the adoption of pair programming over traditional method was computed as 16%, which is a significant im-provement. Hence, we can conclude that pair programming increases the learning effi-ciency when it is adopted for small-duration exercises. In addition to these benefits, the following indirect benefits are also identified.
1. In pair programming, the students work in pairs. This requires cooperation between them. Thus, pair programming increases the team spirit among students.
3. Traditionally, the students used to clear their simple doubts from the laboratory in-structor. When pair programming is introduced, the students tend to clarify their doubts with the pair partners. This leads to the reduction in workload of the in-structor.
Since pair programming brings a number of significant benefits when introduced to do exercises of short duration, it can be adopted to do the laboratory exercises.
6. Conclusion
An experiment was conducted to find the effects of pair programming on learning effi-ciency of the students when they adopt pair programming for laboratory exercises short duration. The learning efficiency was evaluated by design marks, completion time and marks obtained in a written test. The results indicate that the learning efficiency of stu-dents is significantly higher when they adopt pair programming compared to that of the traditional method. Hence, it is observed that pair programming can be introduced as a new learning methodology to do exercises of shorter duration.
References
Basili, V.R., S. Green, O. Laitenberger, F. Lanubile, F. Shull, S. Sorumgard and M.V. Zelkowitz (1996). The empirical investigation of perspective reading.Journal of Empirical Software Engineering,1(2), 133–164. Beck, K. (2000).Extreme Programming Explained: Embrace Change. Addison Wesley.
Boehm, B. (2002). Get ready for agile methods with care.IEEE Computer, January, 64–69.
Cockburn, A., and L.A. Williams (2000). The costs and benefits of extreme programming. InProceedings of the International Conference on Extreme Programming and Flexible Processes in Software Engineering(XP 2000). Sardina, Italy.
David, R.B. (1995).Experiment Design and Statistical Methods. Chapman and Hall.
Delhi (2000).Indian Institute of Technology’s Admission Brochure. Indian Institute of Technology, Delhi, India. Dick, A.J., and B. Zarnett (2002). Paired programming and personality traits. InProceedings of the Third International Conference on Extreme Programming and Agile Process in Software Engineering(XP 2002). Alghero, Sardinia, Italy.
Frank, K. (2002). Experiences gained from teaching and learning extreme programming. InProceedings of the Third Annual Conference of LTSN. Looghborough university.
Highsmith, J., and A. Cockburn (2001). Agile software development: the business of innovation.IEEE Com-puter, September, 120–122.
Hodgetts, P., and D. Philips (2001).EXtreme Adoption Experiences of B2B Start up. http://www. AgileLogic.com
Johnson, B., and L.B. Christensen (2003).Educational Research: Quantitative, Qualitative, and Mixed Ap-proaches. Second Edition, Allyn & Bacon.
Klemm, W.R. (1994). Using a formal collaborative learning paradigm for veterinary medical education.Journal of Vertinary Medical Education,21(1).
http://www.scholar.lib.vt.edu/ejournals/JVME/V21-1/Klemm.html
Kuppuswami, S., and K. Vivekanandan (2002). Female students’ perspective on the adoption of pair program-ming to conduct laboratory experiments. InProceedings of the First Annual Conference on Women in Infor-mation Technology, Annamalai University. Annamalai Nagar, India.
Maurer, F., and S. Martel (2002). Extreme programming: rapid development for web-based applications.IEEE Internet Computing, January–February, 86–90
Matthias, M.M., and F.T. Walter (2001). Case study: extreme programming in a university environment. In
Proceedings of the 23rd International Conference on Software Engineering. pp. 537–544.
McDowell, C., H. Bullock, J. Fernald J. and W. Linda (2002). The effects of pair-programming on performance in an introductory programming course. InProceeding of the 33rd SIGCSE Conference.
Melnik, G., and F. Maurer (2002). Perceptions of agile practices: a student survey.Lecture Notes in Computer Science, 2418, Springer.
Nawrocki, J., and A. Wojciechowski (2001). Experimental evaluation of pair programming. InProceedings of the 12th European Software Control and Metrics Conference, London. pp. 269–276, 363–367.
Peter, L. (2002). No pain, No XP observations on teaching and mentoring extreme programming to univer-sity students. InProceedings of the Third International Conference on EXtreme Programming and Agile Processes in Software Engineering(XP 2002). Alghero, Sardinia, Italy.
Pressman, R. (2001).Software Engineering: A Practitioner’s Approach. Fifth Edition, McGraw Hill. Sanders, D. (2001). Student perceptions of the suitability of extreme and pair programming. InProceedings of
the XP Universe Conference. Raleigh, NC.
Thomas, L., M. Ratcliffe and A. Robertson (2003). Code warriors and code-a-phobes: a study in attitude and pair programming. InProceedings of 33rd SIGCSE Conference. pp. 363–367.
Timothy, H.D. (2003). Pair programming and pair trading effects on learning and motivation in a CS2 Course.
Journal of Computing for Small Colleges,18(5), 49–56.
Williams, L.A., and R.R. Kessler (2000). Experimenting with industry‘s pair programming model in the com-puter science classroom.Journal on Software Engineering Education, December.
Williams, L.A., K. Yang, E. Wiebe, M. Feizil and C. Miller (2002). Pair programming in an introductory com-puter science course: initial results and recommendations.Seventeenth Annual ACM Conference on Object-Oriented Programming, Systems, Languages and Applications(OOPSLA 2002). Seattle, WA.
William, M.K.T (2000).The Research Methods Knowledge Base.
http://www.trochim.human.cornell.edu/kb/ index.html
S. Kuppuswamiis a professor of computer science and a dean Ramanujam Computer School of Mathematics and Computer Science of Pondicherry University, India. He re-ceived his bachelor and master degrees in electronics from University of Madras, India and dr. ing degree in computer science University of Rennes I, France. His current re-search interests include software engineering, object oriented systems, multilingual sys-tems, software architecture, agent technology and computer networks.
Porinio programavimo poveikis mokymuisi efektyvinti
Subbaraya KUPPUSWAMI, Kalimuthu VIVEKANANDAN