2017 | Lavras | Editora UFLA | www.editora.ufla.br | www.scielo.br/cagro http://dx.doi.org/10.1590/1413-70542017416013017
Assessment of watermelon accessions for salt tolerance
using stress tolerance indices
Avaliação de acessos de melancia para tolerância ao sal utilizando índices de tolerância ao estresse
Ercan Ekbic1*, Cagri Cagıran1, Kursat Korkmaz2, Malik Arsal Kose1, Veysel Aras3
1University of Ordu, Department of Horticulture, Faculty of Agriculture, Ordu, Turkey
2University of Ordu, Department of Soil Science and Plant Nutrition, Faculty of Agriculture, Ordu, Turkey 3Alata Horticultural Research Institute, Mersin, Turkey
*Corresponding author: [email protected]
Received in May 12, 2017 and approved in September 29, 2017
ABSTRACT
Salt stress is the most significant constraint for agricultural production in arid and semi-arid regions. Thus, genetically improved stress-tolerant varieties are needed for the future. The identification of salt-stress-tolerant genotypes is the starting point for such breeding studies. This study was conducted to determine and assess the tolerance of different watermelon genotypes under saline conditions. Twenty-two
watermelon genotypes and accessions were grown in pots with 3 kg of soil in four saline stress conditions (0 mmol kg-1 as the control, 25, 50 and 100 mmol kg-1 NaCl). The detrimental effects of salt stress on the plants were evident with increasing doses of NaCl. Stress indices calculated over the plant dry weights under the 100 mmol kg-1 salinity level were used to assess the salt tolerance of the genotypes. Stress intensity was calculated as 0.76. Such a value indicated that the highest dose of salt exerted severe stress on the plants. The G04, G14 and G21 genotypes were considered to be salt tolerant, since these genotypes showed the highest values of K/Na and Ca/Na ratios in the plant tissue. The losses in dry mass at severe salt stress reached 75.48%. In principal component analyses, the genotypes had positive correlations with stress tolerance indices of MP (mean productivity), GMP (geometric mean productivity) and STI (stress tolerance index). The GMP and STI indices indicated that G04 (a member of Citrullus colocynthis), G14 and G21 could be prominent sources to develop salt tolerance.
Index terms: Citrullus lanatus; local varieties; stress tolerance attributes; tolerance for salt stress.
RESUMO
O estresse salino é a restrição mais importante para a produção agrícola em regiões áridas e semi-áridas. Portanto, há necessidade de plantas geneticamente tolerantes ao estresse salino no futuro. Identificação de genótipos tolerantes ao sal é o ponto de partida de estudos de melhoramento. O presente estudo foi conduzido para determinar e avaliar a tolerância de diferentes genótipos de melancia sob condições salinas. Um total de 22 genótipos e acessos de melancia foram cultivados em vasos de 3 kg de solo com quatro condições
de estresse salino diferentes (0 mmol kg-1 como controle, 25, 50 e 100 mmol kg-1 de NaCl). Dependendo do aumento da dose de NaCl, os efeitos prejudiciais do estresse salino nas plantas também aumentaram. Os índices de estresse calculados sobre os pesos secos das plantas com um nível de salinidade de 100 mmol kg-1 foram utilizados para avaliar a tolerância ao sal dos genótipos. A intensidade de tensão
foi calculada como 0.76. Indicando que a maior dose de sal exerce um estresse salino grave nas plantas. Os genótipos G04, G14 e G21 foram considerados tolerantes, uma vez que apresentaram os maiores valores nas relações K/Na e Ca/Na. As perdas em pesos secos com estresse salino grave atingiram 75.48%. Na análise de componentes principais, os genótipos tiveram correlações positivas com os índices
de tolerância ao estresse de PM (produtividade média), GMP (produtividade média geométrica) e STI (índice de tolerância ao estresse). Os índices GMP e STI indicaram G04 (um membro de C. colocynthis), G14 e G21 como materiais proeminentes para a tolerância ao sal.
Termos para indexação: Citrullus lanatus; variedades locais; atributos de tolerância ao estresse; tolerância ao estresse salino.
INTRODUCTION
Intensive input use, especially excessive fertilizer use, ultimately results in polluted lands. Salinity is a common problem in agricultural lands in arid and semi-arid
regions. It negatively influences plant water potential and
ion balance; has toxic impacts on plants, destroys plant metabolism, ultimately results in drastic yield losses; and
exerts significant threats on the agricultural production of
countries (Munns; Termaat, 1986; Sharma; Rao; Saxena, 2004; Wang et al., 2014). The majority of the plants cannot survive under high soil salinity conditions, or they exhibit
weak development and growth, resulting in serious yield
and quality losses. A decrease in the number of leaves and
leaf sizes, short plant heights and reduced dry weights
conditions disrupt the physiological and metabolic activities of plants as a result of osmotic stress (Slama et al., 2015). Osmotic imbalance in salt stress conditions
results in water deficit, stomatal closure and excess Na+
ion accumulation in older leaves (Roy; Negrao; Tester,
2014).
Increasing agricultural productions by solving
salt stress problems in agricultural lands is a significant
issue to meet the food demands of an ever-increasing
world population. Improved irrigation techniques or soil
reclamation practices provide expensive and palliative solutions for salinity problems (Singh; Singh, 2000).
Nevertheless, some chemical applications such as
jasmonic acid decrease the detrimental effects of salt stress (Azooz; Ashraf; Abou-Elhamd, 2015). Genetic variations in the salt tolerance of several plants have been
defined, and such variations have been successfully used in cultural practices. Defining a salt tolerant genitor in watermelon gene sources may provide significant germ
plasm sources for upcoming breeding studies. Plant resistance to salt stress is managed by several genes
(Silva; Geros, 2009), but it is also influenced considerably by environmental conditions. Therefore, the identification
of salt-tolerant genotypes is the starting point of breeding studies.
Various stress indices were developed and
used for the selection of stress-tolerant genotypes by
measuring plant performance under stress and taking
normal conditions into account (Fischer; Maurer, 1978; Rosielle and Hamblin, 1981; Fernandez, 1992; Mitra, 2001; Porch, 2006; Singh et al., 2015; Krishnamurthy et al., 2016). With these indices, performance losses under stress conditions compared to normal conditions are
identified, and the severity of stress is determined. These
indices are usually based on the resistance or sensitivity of genotypes to stress conditions (Fernadez, 1992).
Rosielle and Hamblin (1981) defined the difference in
plant performance under normal conditions (Yp) and stress conditions (Ys) as stress tolerance (TOL) and
defined the average performance under both conditions
as the mean productivity (MP).
However, if there is a large difference between the Yp and Ys, then the MP may allow the selection
of sensitive genotypes. Such a case then negatively
influences the success of selection. Instead, the geometric mean productivity (GMP), which is less sensitive to
extreme values, is more successful to select superior genotypes under both stress and normal conditions than the MP index. Another study indicated that the stress
sensitivity index (SSI) was not independent from the
productivity potential of the genotype and indicated the potential of the genotypes (Fischer; Maurer, 1978).
Fernandez (1992) defined the stress tolerance index
(STI) and indicated that the STI might be effective in the selection of high-yield genotypes under both stress and normal conditions. Stress indices have not been used
to select salt stress-tolerant watermelon genotypes. The present study was conducted to determine the effects of salinity on plant growth characteristics and to assess the efficiency of stress indices in the identification of salt stress-tolerant watermelon genotypes based on their dry
mass under high saline stress conditions.
MATERIAL AND METHODS
Watermelon genotypes and cultivars were obtained from the watermelon genetic resources of
the Alata Horticulture Research Station. A total of 22
watermelon genotypes were utilized in this study: 18 local watermelon genotypes collected from different regions of Turkey, three commercial cultivars (G01, G02, G03)
and one Citrullus colocynthis accession (G04: tolerant to
salt stress). Experiments were conducted in an unheated greenhouse with 28 °C day and 18 ºC night temperatures. Watermelon seeds were sown in peat-filled vials. When the seedlings had 2-3 true leaves, they were transplanted into 3 kg pots filled with sand-clay soil (pH: 6.6, EC:
0.11 dS m-1).
The experiment was conducted using completely
randomized plots in an experimental design of three
replications. Following the transplantation of the seedlings, 300 mg kg-1 N (NH
4SO4), 100 mg kg -1 P
(KH2PO4) and 125 mg kg-1 K (KH
2PO4) fertilizers (as
solution) were applied to the pots for normal plant growth. Sodium chlorite (NaCl) (Merck) was used to create salt stress conditions. Genotypes were tested under a control plot (0 mmol kg-1 NaCl) and three different NaCl
treatments (25 mmol kg-1, 50 mmol kg-1 and 100 mmol kg-1)
to represent different stress conditions. Data obtained from the different salt stress (mild-to-severe) conditions
were used to assess the effects of NaCl on the plants’ growth habit and nutritional content for all genotypes. Additionally, stress indices were calculated using the data
obtained from control plots (as the normal environment)
and 100 mmol kg-1 NaCl applied plots (as the severe salt
stress environment). The salt treatments were initiated five days after transplanting, and 25 mmol kg-1 was
2-day intervals to avoid acute impacts. The plants were left to grow for four weeks after they had been treated with the salt. All of the standard horticultural practices were implemented regularly and fully. At the end of the
4th week, the plants were harvested by cutting them from
the soil surface. The harvested plants were washed with tap water and roughly dried with paper towels. The main shoot length and fresh mass were measured. Plants were
then dried in paper bags at 70 oC for 48 h and reweighed
to obtain their dry mass. Measurement of Na, K, Ca, Mg, P, Fe, Zn, Cu and Mn were performed by an inductively coupled plasma optical emission spectrometer (ICP-OES;
Vista-Pro Axial; Agilent Tech., Mulgrave, Australia) after digesting the leaf samples (0.2 g of each sample) in a
closed microwave digestion system (MarsExpress CEM Corp., Matthews, NC) in the presence of concentrated HNO3 (5 ml) and H2O2 (2 ml). Deionized water was
used to bring the volume of the samples to 20 ml. The
analytical data was compared with the certified values of a standard reference material (SRM 1573a Tomato Leaf, National Institute of Standards and Technology,
Gaithersburg, MD).
Stress tolerance indices were calculated over
the dry mass of control and the plants subjected to
100 mmol kg-1 salinity level by using the following
equations:
Stress intensity (SI) 1 Ys
Yp
(Fischer; Maurer, 1978);
Tolerance (TOL) = (Yp – Ys) (Rosielle; Hamblin, 1981); Mean Productivity (MP) = (Ys – Yp)/2 (Rosielle; Hamblin, 1981);
Geometric Mean Productivity (GMP) = Ys Yp (Fernandez, 1992);
Stress Sensitivity Index (SSI) = (1–(Ys /Yp))/SI (Fischer; Maurer, 1978);
Stress Tolerance Index (STI) = (Ys×Yp)/
Yp 2 (Fernandez, 1992);where Yp: Performance under normal conditions; Ys: Performance under stress conditions; Yp: Mean
performance of the genotypes under normal conditions;
Ys: Mean performance of the genotypes under stress
conditions.
Descriptive statistics for the nutrients and plant
growing characteristics were analyzed with SPSS v.12 statistical software. Principal component analysis (PCA) was performed with Jump v.10.0 statistical software, and the biplot of the first two principal components was drawn.
RESULTS AND DISCUSSION
Effect of salt stress on some plant growing parameters
Descriptive statistics of the main shoot lengths and of the fresh and dry mass (g) of the different salt
treatments and the control are shown in Table 1. The values decreased with increasing salt stress levels. While the decreases in the main shoot lengths and fresh weights were similar to each other, there were severe decreases in the plant dry weights. Compared to the control treatment, there was a 61.44% decrease in the main shoot length, a 60.75% decrease in fresh weight and a 75.48% decrease
in dry weight under high salt stress conditions. Research
conducted on pepper (Chartzoulakis; Klapaki, 2000), watermelon and gourd species (Yetisir; Uygur, 2009), eggplant (HaiJun et al., 2013), tomato (Kıran et al., 2014;
Tuna, 2014) and cucumber (Tavares de Albuquerque et al., 2016) all reported that saline conditions dramatically
limited the plant growing parameters such as plant height, fresh weight and dry weight.
Effect of salt stress on plant nutrient contents of watermelon genotypes
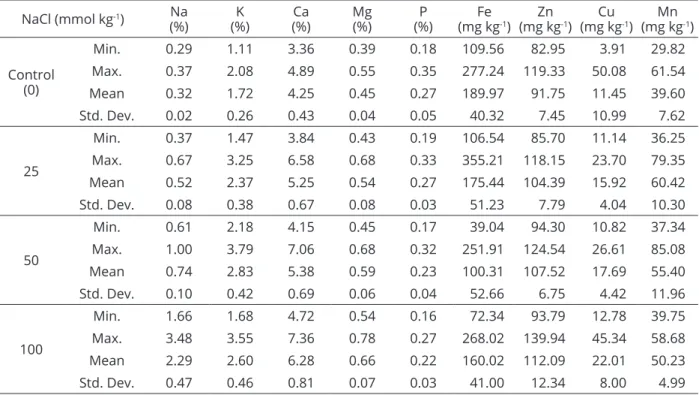
Descriptive statistics for the plant nutrients of
local watermelon genotypes are shown in Table 2. The data showed that a minor decrease was observed in P contents with increasing salt stress levels. Because the dry mass of the watermelon genotypes was reduced, the Na, Ca, Mg, Zn and Cu contents in plant tissue increased along with the saline stress level. Alternatively, the K,
Fe and Mn contents of the genotypes exhibited different responses to saline conditions. While increasing K and
Mn contents were observed under low salinity stress
levels, these values decreased under high salinity levels.
High concentrations of sodium can inhibit the uptake of K by plants through the antagonism between these two ions as well as potassium ion leakage when Ca substitutes for Na in the cell membranes (Marschner, 1995). Uygur and Yetisir (2006) investigated the phosphorus uptake of
different squash genotypes under saline conditions. These researchers reported that severe (16 dS m-1) salt stress
resulted in 3-fold increases in leaf P contents of sensitive
squash genotypes and such increases then resulted in P toxicity in these sensitive genotypes. Alternatively,
Oliveira Bosco et al. (2009) reported that progressive salt stress levels increased the Na and Cl ions in the leaves of eggplant and resulted in reductions in the Ca,
Table 2: Descriptive statistics of the watermelon gene pool based on the mineral elements under saline conditions.
NaCl (mmol kg-1) (%)Na (%)K (%)Ca Mg(%) (%)P (mg kgFe -1) (mg kgZn -1) (mg kgCu -1) (mg kgMn -1)
Control (0)
Min. 0.29 1.11 3.36 0.39 0.18 109.56 82.95 3.91 29.82
Max. 0.37 2.08 4.89 0.55 0.35 277.24 119.33 50.08 61.54
Mean 0.32 1.72 4.25 0.45 0.27 189.97 91.75 11.45 39.60
Std. Dev. 0.02 0.26 0.43 0.04 0.05 40.32 7.45 10.99 7.62
25
Min. 0.37 1.47 3.84 0.43 0.19 106.54 85.70 11.14 36.25
Max. 0.67 3.25 6.58 0.68 0.33 355.21 118.15 23.70 79.35
Mean 0.52 2.37 5.25 0.54 0.27 175.44 104.39 15.92 60.42
Std. Dev. 0.08 0.38 0.67 0.08 0.03 51.23 7.79 4.04 10.30
50
Min. 0.61 2.18 4.15 0.45 0.17 39.04 94.30 10.82 37.34
Max. 1.00 3.79 7.06 0.68 0.32 251.91 124.54 26.61 85.08
Mean 0.74 2.83 5.38 0.59 0.23 100.31 107.52 17.69 55.40
Std. Dev. 0.10 0.42 0.69 0.06 0.04 52.66 6.75 4.42 11.96
100
Min. 1.66 1.68 4.72 0.54 0.16 72.34 93.79 12.78 39.75
Max. 3.48 3.55 7.36 0.78 0.27 268.02 139.94 45.34 58.68
Mean 2.29 2.60 6.28 0.66 0.22 160.02 112.09 22.01 50.23
Std. Dev. 0.47 0.46 0.81 0.07 0.03 41.00 12.34 8.00 4.99
Min= Minimum; Max= Maximum; Std. Dev= Standard deviation.
Table 1: Descriptive statistics of watermelon genepool based on some morphological traits in different saline conditions.
NaCl
(mmol kg-1) Shoot length(cm) Fresh mass(g plant-1) Dry mass(g plant-1) RMSL (%) RMFW (%) RMDW (%)
Control (0)
Min. 52.33 34.53 5.66
Max. 127.00 56.39 11.21 - -
-Mean 75.08 45.73 8.40
Std. Dev. 15.18 4.75 1.26
25
Min. 47.67 26.10 3.58
Max. 110.67 47.58 7.28
Mean 60.93 35.95 5.59 -18.85 -21.39 -33.45
Std. Dev. 14.01 4.68 0.82
50
Min. 27.33 20.13 2.25
Max. 81.00 28.55 3.78
Mean 38.83 24.22 3.01 -48.28 -47.04 -64.17
Std. Dev. 10.72 2.17 0.48
100
Min. 20.67 10.66 0.76
Max. 55.00 22.35 2.59
Mean 28.95 17.95 2.06 -61.44 -60.75 -75.48
Std. Dev. 7.02 2.85 0.46
In studies of the salt stress tolerance of plants,
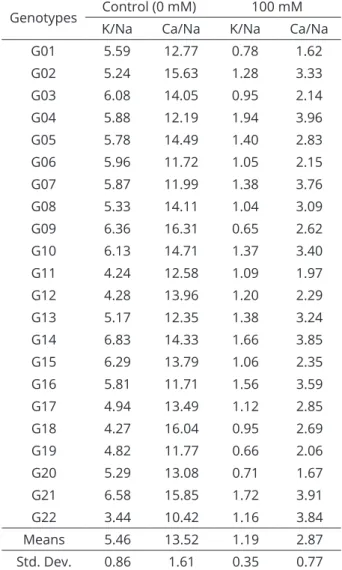
the potassium-to-sodium ratio (K/Na) and the calcium-to-sodium ratio (Ca/Na) are used as tolerance criteria in which higher ratios indicate a lower rate of inhibition from Na-induced stress (Salehi; Arzani, 2014). Compared to the control treatment, the K/Na and Ca/Na ratios significantly decreased under high salt stress levels (Table 3). While the mean K/Na ratio of the local genotypes was 5.46, and the Ca/Na ratio was 13.52 under normal conditions, the values
decreased to 1.19 and 2.87, respectively, under high salt
stress conditions. An analysis of the K/Na ratios of the
genotypes under high salt stress levels indicated that the
greatest values were obtained from the G04, G14 and G21 genotypes, and the lowest values were obtained from the G01, G09, G19 and G20 genotypes. Similar results were obtained with the Ca/Na ratios. While the greatest values were observed in the G04, G14, G21 and G22 genotypes, the lowest values were observed in the G01, G11, G19 and
G20 genotypes. Thus, the genotypes of G04, G14 and G21
with the greatest K/Na and Ca/Na ratios were considered to be salt stress-tolerant genotypes. ShiNong and ShiRong (2009) indicated that watermelon plants grafted on squash rootstocks take up a greater concentration of K+ ions
from the soil rather than taking up Na+ under salt stress
conditions. Yasar, Uzal and Yasar (2013) carried out a study examining the salt stress-tolerance of watermelon genotypes and indicated that the plants selectively took up Na+ and K+ ion under salt stress conditions, and the
resistant genotypes promoted the uptake of K+ ions rather
than Na+ ions. Moreover, under salinity stress conditions,
with increasing salt concentration, the K+ ion concentration
increases in salt tolerant plants (Goreta et al., 2008; Yetisir;
Uygur, 2009). Therefore, the K/Na ratio represents the tolerance level of a genotype. Yang, Newton and Miller (1990) reported that K/Na ratios increased in salt tolerant
plants. In addition, Dasgan et al. (2002) reported that the
K/Na ratio could be used reliably in the selection of plants
tolerant to salt stress.
Stress indices and correlations
Breeders usually start by screening genetic
pools to identify resistant or tolerant genotypes under stress conditions. Different criteria are employed other
than the K/Na ratio in the identification of
stress-tolerant individuals. Stress tolerance indices have long been used in screening studies to identify drought or stress tolerant genotypes in beans (Porch, 2006),
cowpeas (Fernandez, 1992), wheat (Fisher; Maurer,
1978; Asadi et al., 2012) and paddy (Hosseini et al., 2012; Krishnamurthy et al., 2016).
Table 3: K/Na and Ca/Na mean ratios of genotypes under normal and severe salt stress conditions.
Genotypes Control (0 mM) 100 mM
K/Na Ca/Na K/Na Ca/Na
G01 5.59 12.77 0.78 1.62
G02 5.24 15.63 1.28 3.33
G03 6.08 14.05 0.95 2.14
G04 5.88 12.19 1.94 3.96
G05 5.78 14.49 1.40 2.83
G06 5.96 11.72 1.05 2.15
G07 5.87 11.99 1.38 3.76
G08 5.33 14.11 1.04 3.09
G09 6.36 16.31 0.65 2.62
G10 6.13 14.71 1.37 3.40
G11 4.24 12.58 1.09 1.97
G12 4.28 13.96 1.20 2.29
G13 5.17 12.35 1.38 3.24
G14 6.83 14.33 1.66 3.85
G15 6.29 13.79 1.06 2.35
G16 5.81 11.71 1.56 3.59
G17 4.94 13.49 1.12 2.85
G18 4.27 16.04 0.95 2.69
G19 4.82 11.77 0.66 2.06
G20 5.29 13.08 0.71 1.67
G21 6.58 15.85 1.72 3.91
G22 3.44 10.42 1.16 3.84
Means 5.46 13.52 1.19 2.87
Std. Dev. 0.86 1.61 0.35 0.77
Std. Dev= Standard deviation.
The stress intensity calculated over the dry mass
of 22 watermelon genotypes and cultivars under high salt stress levels was identified as 0.76 (Table 4). Such a value indicated highly significant stress levels in watermelons. The stress index values of the genotypes are shown in Table 4. The dry matter quantities of the watermelon
genotypes produced under salt stress conditions varied
between 0.76 g and 2.59 g, and the values under normal conditions varied between 5.66 g and 10.25 g. While the
G22, G10 and G12 genotypes yielded the greatest dry
conditions, the lowest values were observed in the G09 and
G18 genotypes. The greatest values of mean productivity (MP), calculated as the mean performance under normal
and stress conditions, were observed in the G04, G14 and G21 genotypes and the lowest in the G09, G11 and G18
genotypes. Measurements of the geometric mean productivity
(GMP) indicated that the greatest values were observed in the G04, G14, G21 and G22 genotypes, and the lowest values were observed in the G03, G11, G15 and G17 genotypes.
Alternatively, the greatest tolerance index (TOL) values were observed in the G03, G04, G14 and G21 genotypes and the lowest in the G05, G09 and G18 genotypes. With regard to the stress sensitivity index (SSI), the greatest values were seen in the G03, G11 and G15 genotypes, and the lowest values were observed in the G09 and G18 genotypes. Considering the stress tolerance index (STI) of the genotypes, it was observed that the genotypes G04 (0.34), G14 (0.33), G22 (0.32) and G21 (0.31) had higher values.
Table 4: Estimates of salt tolerance attributes from dry mass data for watermelon genotypes.
Genotypes YP YS MP TOL GMP SSI STI
G01 8.21 1.74 4.97 6.48 3.77 1.04 0.20
G02 8.54 1.99 5.26 6.56 4.12 1.02 0.24
G03 8.81 0.76 4.78 8.06 2.58 1.21 0.09
G04 11.11 2.18 6.64 8.93 4.91 1.06 0.34
G05 7.44 2.39 4.92 5.05 4.22 0.90 0.25
G06 8.76 2.15 5.46 6.61 4.34 1.00 0.27
G07 8.75 2.09 5.42 6.67 4.27 1.01 0.26
G08 7.65 2.30 4.98 5.35 4.20 0.92 0.25
G09 5.66 2.40 4.03 3.26 3.69 0.76 0.19
G10 7.79 2.55 5.17 5.24 4.45 0.89 0.28
G11 7.48 1.30 4.39 6.18 3.12 1.09 0.14
G12 8.34 2.45 5.39 5.89 4.52 0.93 0.29
G13 8.44 2.36 5.40 6.08 4.46 0.95 0.28
G14 11.21 2.06 6.63 9.15 4.80 1.08 0.33
G15 7.98 1.37 4.67 6.61 3.30 1.10 0.15
G16 8.68 2.21 5.44 6.47 4.38 0.99 0.27
G17 7.87 1.42 4.64 6.45 3.34 1.08 0.16
G18 6.64 2.39 4.51 4.26 3.98 0.85 0.22
G19 8.75 2.17 5.46 6.58 4.35 1.00 0.27
G20 7.88 2.20 5.04 5.68 4.16 0.95 0.24
G21 10.18 2.16 6.17 8.02 4.69 1.04 0.31
G22 8.72 2.59 5.65 6.13 4.75 0.93 0.32
Mean 8.40 2.06 5.23 6.35 4.11 0.99 0.24
Std. Dev. 1.26 0.46 0.66 1.37 0.59 0.10 0.03
SI 0.76
Correlation coefficients between the stress indices of watermelon genotypes grown under salt stress conditions are shown in Table 5. The performance of genotypes under normal conditions (Yp) was highly correlated with the MP (0.94) and GMP (0.94). The GMP index was also highly correlated with the Ys (0.83). Alternatively, the Ys correlated negatively with the TOL (-0.40) and SSI (-0.83). Such negative correlations indicated that the genotypes with high TOL and SSI values had low values under stress conditions. There was a high positive correlation between the TOL and SSI (0.82). The STI had significant positive correlations with
the Ys (0.80), MP (0.80) and GMP (0.99). The correlations
between the dry weights under normal conditions and the dry weights under stress conditions were found to not be significant. Such insignificant correlations indicated that the genotypes with high performances under normal conditions
did not yield similar responses under stress conditions, and
thus the tolerance levels of the genotypes were different
from each other.
Principal Component Analysis (PCA) and Biplot Display
Statistical multivariate algorithms are highly effective methods to characterize genetic materials and elucidate the genetic relations among them (Mohammadi;
Prasanna, 2003).
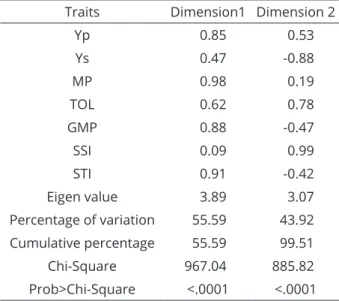
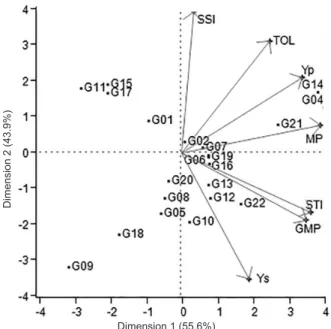
The relationships between the genotypes and stress tolerance indices are shown in Table 6 and Figure 1. A biplot display is usually carried out with principal component analysis allowing visual assessments of the relationships between the genotypes and stress indices by placing each index over different axes. While the first principal component had a high positive correlation with the MP
(0.98), STI (0.91), GMP (0.88) and Yp (0.85) indices,
it explained 55.6% of the total variation. The second principal component had a high positive correlation with
the SSI (0.99) and TOL (0.78) and a negative correlation
with the Ys (-0.88), GMP (-0.47) and STI (-0.42) indices and explained 43.9% of the total variation. These two principal components together explained 99.5% of the total variation among watermelon genotypes. The first principle component constituted 3.89% of the variation
in salt-tolerance indices, and the second principal
component constituted 3.07% of such variations. The genotypes G04, G14 and G21 ranked strongly in the
STI, GMP and MP indices. Alternatively, the sensitive
genotype G03 ranked strongly in the SSI index. The TOL index did not separate the genotypes significantly based
on stress conditions.
Table 5: Linear correlation among stress index attributes.
Yp Ys MP GMP TOL SSI
Ys -0.06ns 1.00
MP 0.94** 0.29ns 1.00
GMP 0.49* 0.83** 0.76** 1.00
TOL 0.94**-0.40ns 0.76** 0.17ns 1.00
SSI 0.58**-0.83** 0.27ns -0.38ns 0.82** 1.00
STI 0.55* 0.80** 0.80** 0.99** 0.23ns -0.33ns
YP = Dry weight under normal condition; YS = Dry weight under saline condition; MP = Mean dry weight; GMP = Geometric mean dry weight; TOL= Tolerance; SSI = Stress susceptibility
index; STI = Stress tolerance index; Ns= not significant; *= significant at 5% level; **= significant at 1% level.
Asadi et al. (2012) reported that the GMP and STI
indices were quite distinctive in the identification of the salt-tolerance of bread wheat. Hosseini, Sarvestani and Pirdashti (2012) indicated the paddy genotypes with high MP and STI index values and low SSI values to be salt-tolerant. In
another study, Krishnamurthy et al. (2016) indicated that the
GMP and STI indices identified the salt-tolerant genotypes, and the TOL and SSI indices were able to separate sensitive
paddy genotypes. In addition, in beans, the STI and GMP
indices were found to effectively identify drought-tolerant
genotypes (Porch, 2006). Similarly, in some other studies,
positive correlations of salt-tolerance with the MP, GMP and STI indices were reported (Clarke et al., 1984; Winter; Musick; Porter 1988; Mardeh et al., 2006).
Table 6: Principal component for salt stress indices based on dry mass of watermelon genotypes.
Traits Dimension1 Dimension 2
Yp 0.85 0.53
Ys 0.47 -0.88
MP 0.98 0.19
TOL 0.62 0.78
GMP 0.88 -0.47
SSI 0.09 0.99
STI 0.91 -0.42
Eigen value 3.89 3.07
Percentage of variation 55.59 43.92
Cumulative percentage 55.59 99.51
Chi-Square 967.04 885.82
Singh et al. (2015) carried out a study on the salt
tolerance of bread wheat and indicated that principle component analysis separated the genotypes into two groups. These researchers reported that the first two principal components were able to explain 99.74% of the variation among the genotypes, the first principal component constituted 5.24% of variation in the salt
tolerance indices, and the second component constituted
3.74%.
Collado et al. (2015) reported that the GMP, MP and STI indices clearly identified and grouped the high
yielding maize accessions in both the stress and normal
environments by biplot. Moreover, it was reported that principal component analysis showed that the shoot dry weight had the highest contribution and was associated with the GMP, MP and STI indices in stress
environments. Krishnamurthy et al. (2016) reported
that the first dimension of biplot analysis explained 66.9% of the total variation among paddy genotypes
under salt stress conditions. These researchers also
reported high correlations of seed yields with the MP, GMP and STI indices and negative correlations with
the TOL and SSI indices. The second dimension of the
biplot explained 32.1% of the total variation, and seed yields were positively correlated with the TOL and SSI
indices (Krishnamurthy et al. 2016). Fernandez (1992)
carried out a study with cowpea genotypes and reported
that the first dimension of the biplot explained 63%
of the total variation among genotypes under severe
stress conditions and that there were high correlations
among the MP, SSI and STI. The second dimension
of the biplot explained 39% of the total variation, and there was a positive correlation between the TOL and
Yp (Fernandez, 1992).
CONCLUSIONS
To our knowledge, this is the first study on the responses of watermelon genotypes to salt stress. This
study found that stress indices could yield reliable
selections for watermelon genotypes under high salt
stress conditions. Watermelon genotypes are generally sensitive to high salt stress conditions and, as expected,
the dry weights of the genotypes decreased under stress
conditions. The stress indices calculated over the dry
weights were highly successful at identifying salt-tolerant
genotypes and delineated the genetic variability among
watermelon genotypes in terms of their salt tolerance
levels. Of the stress indices used in this study, the GMP
and STI indicated that the G04, G14 and G21 were tolerant genotypes. Thus, these stress indices were highly effective at screening the watermelon genotypes
for salt stress.
ACKNOWLEDGMENTS
The authors thank the Research Project Coordinator of Ordu University (TF-1331) for financial support of this
research.
REFERENCES
ASADI, M. et al. Assesment of salinity tolerance of different
promising lines of bread wheat (Triticum aestivum L.). Advances in Applied Science Research, 3(2):1117-1121, 2012.
AZOOZ, M. M.; ASHRAF, M.; ABOU-ELHAMD, M. F.
Jasmonate-induced tolerance of Hassawi okra seedlings to salinity in brackish water. Acta Physiologiae Plantarum, 37:77, 2015.
CHARTZOULAKIS, K.; KLAPAKI, G. Response of two greenhouse pepper hybrids to NaCl salinity during
different growth stages. Scientia Horticulturae, 86:247-260, 2000.
CLARKE, J. M. et al. Growth analysis of spring wheat cultivars
of varying drought resistance. Crop Science, 24(3):537-541, 1984.
Figure 1: The biplot display of stress-tolerance
attributes and watermelon genotypes based on dry mass levels under salt stress conditions (SI = 0.76).
Dimension 1 (55.6%)
COLLADO, M. B. et al. Evaluation of salinity tolerance indices in seedling of maize (Zea mays L.). Revista de la Facultad de Agronomía, La Plata, 114(1):27-37, 2015.
DASGAN, H. Y. et al. Determination of screening techniques to
salinity tolerance in tomatoes and investigation of genotype responses. Plant Science, 163:695-703, 2002.
FERNANDEZ, G. C. J. Effective selection criteria for assessing
stress tolerance. In: KUO, C. G. (Ed.). Proceedings of the International Symposium on Adaptation of Vegetables and Other Food Crops in Temperature and Water Stress,
Tainan, Taiwan, 1992. p.257-270.
FISCHER, R. A.; MAURER, R. Drought resistance in spring wheat cultivars. I. Grain yield response. Australian Journal of Agricultural Research, 29:897-907, 1978.
GORETA, S. et al. Vegetative growth, superoxide dismutase
activity and ion concentration of salt-stressed watermelon as influenced by rootstock. The Journal of Agricultural Science, 146(6):695-704, 2008.
HAI-JUN, Z. et al. Growth, ion distribution and salt-tolerance
mechanism of eggplant seedlings under salt stress. Journal of China Agricultural University, 18(4):77-83, 2013.
HOSSEINI, S. J.; SARVESTANI, Z. T.; PIRDASHTI, H. Analysis of
tolerance indices in some rice (Oryza sativa L.) genotypes at salt stress condition. International Research Journal of Applied and Basic Sciences, 3(1):1-10, 2012.
KIRAN, S. et al. Changes on some characteristics of tomato
genotypes in different tolerance levels for salt stress
under drought stress conditions. Journal of Agricultural Faculty of Gaziosmanpasa University, 31(3):41-48, 2014.
KRISHNAMURTHY, S. L. et al. Effect of different salt stresses on agro-morphological traits and utilisation of salt stress
indices for reproductive stage salt tolerance in rice. Field Crops Research, 190:26-33, 2016.
MARSCHNER, H. Mineral nutrition of higher plants. 2. Ed. London: Academic Press, 1995. 889p.
MARDEH, A. et al. Evaluation of drought resistance indices under various environmental conditions. Field Crops Research, 98:222-229, 2006.
MITRA, J. Genetics and genetic improvement of drought
resistance in crop plants. Current Science, 80:758-762, 2001.
MOHAMMADI, S. A.; PRASANNA, B. M. Analysis of genetic
diversity in crop plants - Salient statistical tools and
considerations. Crop Science, 43(4):1235-1248, 2003.
MUNNS, R.; TERMAAT, A. Whole-plant responses to salinity.
Australian Journal of Plant Physiology, 13(1):143-160, 1986.
OLIVEIRA BOSCO, M. R. de et al. Influence of salt stress on
the mineral composition of eggplant seedlings. Revista Ciência Agronômica, 40(2):157-164, 2009.
PORCH, T. G. Application of stress indices for heat tolerance screening of common bean. Journal of Agronomy and Crop Science, 192:390-394, 2006.
ROSIELLE, A. A.; HAMBLIN, J. Theoretical aspects of selection for yield in stress and non-stress environments. Crop Science,
21:943-946. 1981.
ROY, S. J.; NEGRAO, S.; TESTER, M. Salt resistant crop
plants. Current Opinion in Biotechnology, 26:115-124, 2014.
SALEHI, M.; ARZANI, A. Evaluation of triticale genotypes for salt tolerance using physiological traits. Emirates Journal of Food and Agriculture, 26(3):277-283, 2014.
SHARMA, R. C.; RAO, B. R. M.; SAXENA, R. K. Salt affected soils in India - Current assessment. In: Advances in sodic land reclamation. International Conference on Sustainable Management of Sodic Lands, 9–14 February, Lucknow,
India, p.1-26. 2004.
SHINONG, Z.; SHIRONG, G. Effects of grafting on K+, Na+
contents and distribution of watermelon (Citrullus vulgaris
Schrad.) seedlings under NaCl stress. Acta Horticulturae Sinica, 36(6):814-820, 2009.
SILVA, P.; GEROS, H. Regulation by salt of vacuolar H+-ATPase and H+-pyrophosphatase activities and Na+/ H+ exchange. Plant Signaling and Behavior, 4(8):718-726, 2009.
SINGH, S. et al. Assessment of multiple tolerance indices for salinity stress in bread wheat (Triticum aestivum L.). Journal of Agricultural Science, 7(3):49-57, 2015.
SINGH, S.; SINGH M. Genotypic basis of response to salinity stress in some crosses of spring wheat Triticum aestivum
L. Euphytica, 115:209-214, 2000.
SLAMA, I. et al. Diversity, distribution and roles of osmoprotective compounds accumulated in halophytes under abiotic stress. Annals of Botany, 115(3):1-15, 2015.
TAVARES DE ALBUQUERQUE, J. R. et al. Crescimento inicial
TUNA, A. L. Influence of foliarly applied different triazole compounds on growth, nutrition, and antioxidant enzyme activities in tomato (Solanum lycopersicum L.) under salt stress. Australian Journal of Crop Science, 8(1):71-79, 2014.
UYGUR V.; YETISIR H. Phosphorous uptake of gourds species
and watermelon under different salt stress. Journal of Agronomy, 5(3):466-470, 2006.
WANG, Y. H. et al. Screening okra varieties of salt tolerance and correlation analysis among salt tolerance indices at germinating stage. Southwest China Journal of Agricultural Sciences, 27(2):788-792, 2014.
WINTER, S. R.; MUSICK, J. T.; PORTER, K. B. Evaluation of screening techniques for breeding drought-resistant winter
wheat. Crop Phisiology and Metabolism, 28(3):512-516, 1988.
YANG, Y. W.; NEWTON, R. J.; MILLER, F. R. Salinity tolerance in
Sorghum. 1. Whole plant response to sodium chloride in S. bicolor and S. halepense. Crop Science, 30:775-781, 1990.
YASAR, F.; UZAL, O.; YASAR, O. Identification of ion accumulation
and distribution mechanisms in watermelon seedlings (Citrullus lanatus (Thunb.) Mansf.) grown under salt stress. Yüzüncü Yil Üniversitesi Journal of Agricultural Sciences, 23(3):209-214, 2013.
YETISIR, H.; UYGUR, V. Plant growth and mineral element
content of different gourd species and watermelon under