David C. Wyld et al. (Eds) : ITCS, CST, JSE, SIP, ARIA, DMS - 2015
pp. 71–79, 2015. © CS & IT-CSCP 2015 DOI : 10.5121/csit.2015.50108
Saiqa Aleem
1, Luiz Fernando Capretz
1and Faheem Ahmed
21
Western University, Department of Electrical & Computer Engineering, London,Ontario, Canada, N6A5B9
{saleem4, lcapretz}@uwo.ca
2
Thompson Rivers University, Department of Computing Science, Kamloops, British Columbia, Canada, V2C 6N6
fahmed@tru.ca
A
BSTRACTMachine learning techniques can be used to analyse data from different perspectives and enable developers to retrieve useful information. Machine learning techniques are proven to be useful in terms of software bug prediction. In this paper, a comparative performance analysis of different machine learning techniques is explored for software bug prediction on public available data sets. Results showed most of the machine learning methods performed well on software bug datasets.
K
EYWORDSMachine Learning Methods, Software Bug Detection, Predictive Analytics.
1.
I
NTRODUCTIONThe advancement in software technology causes an increase in the number of software products, and their maintenance has become a challenging task. More than half of the life cycle cost for a software system includes maintenance activities. With the increase in complexity in software systems, the probability of having defective modules in the software systems is getting higher. It is imperative to predict and fix the defects before it is delivered to customers because the software quality assurance is a time consuming task and sometimes does not allow for complete testing of the entire system due to budget issue. Therefore, identification of a defective software module can help us in allocating limited time and resources effectively. A defect in a software system can also be named a bug.
developers to improve the architectural design of a system by identifying the high risk segments of the system [5, 6, 7].
Machine learning techniques can be used to analyse data from different perspectives and enable developers to retrieve useful information. The machine learning techniques that can be used to detect bugs in software datasets can be classification and clustering. Classification is a data mining and machine learning approach, useful in software bug prediction. It involves categorization of software modules into defective or non-defective that is denoted by a set of software complexity metrics by utilizing a classification model that is derived from earlier development projects data [8]. The metrics for software complexity may consist of code size [9], McCabe’s cyclomatic complexity [10] and Halstead’s Complexity [11].
Clustering is a kind of non-hierarchal method that moves data points among a set of clusters until similar item clusters are formed or a desired set is acquired. Clustering methods make assumptions about the data set. If that assumption holds, then it results into a good cluster. But it is a trivial task to satisfy all assumptions. The combination of different clustering methods and by varying input parameters may be beneficial. Association rule mining is used for discovering frequent patterns of different attributes in a dataset. The associative classification most of the times provides a higher classification as compared to other classification methods.
This paper explores the different machine learning techniques for software bug detection and provides a comparative performance analysis between them. The rest of the paper is organized as follows: Section II provides a related work on the selected research topic; Section III discusses the different selected machine learning techniques, data pre-process and prediction accuracy indicators, experiment procedure and results; Section VI provides the discussion about comparative analysis of different methods; and Section V concludes the research.
2. R
ELATEDW
ORKLessmann et al. [12] proposed a novel framework for software defect prediction by benchmarking classification algorithms on different datasets and observed that their selected classification methods provide good prediction accuracy and supports the metrics based classification. The results of the experiments showed that there is no significant difference in the performance of different classification algorithms. The study did not cover all machine learning techniques for software bug prediction. Sharma and Jain [13] explored the WEKA approach for different classification algorithms but they did not explore them for software bug prediction. Kaur and Pallavi [14] explored the different data mining techniques for software bug prediction but did not provide the comparative performance analysis of techniques. Wang et al. [15] provided a comparative study of only ensemble classifiers for software bug prediction. Most of the existed studies on software defect prediction are limited in performing comparative analysis of all the methods of machine learning. Some of them used few methods and provides the comparison between them and others just discussed or proposed a method based on existing machine learning techniques by extending them [16, 17, 18].
3.
M
ACHINEL
EARNINGT
ECHNIQUESF
ORS
OFTWAREB
UGD
ETECTIONare classified into two broad categories in order to compare their performance; such as supervised learning versus unsupervised learning. In supervised learning algorithms such as ensemble classifier like bagging and boosting, Multilayer perceptron, Naive Bayes classifier, Support vector machine, Random Forest and Decision Trees are compared. In case of unsupervised learning methods like Radial base network function, clustering techniques such as K-means algorithm, K nearest neighbour are compared against each other.
3.1 Datasets & Pre-processing
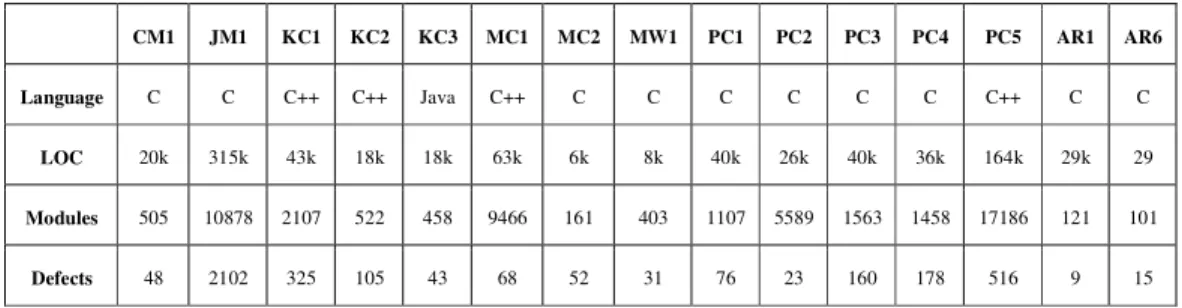
The datasets from PROMISE data repository [20] were used in the experiments. Table 1 shows the information about datasets. The datasets were collected from real software projects by NASA and have many software modules. We used public domain datasets in the experiments as this is a benchmarking procedure of defect prediction research, making easier for other researcher to compare their techniques [12, 7]. Datasets used different programming languages and code metrics such as Halstead’s complexity, code size and McCabe’s cyclomatic complexity etc. Experiments were performed by such a baseline.
Waikato Environment for Knowledge Analysis (WEKA) [20] tool was used for experiments. It is an open source software consisting of a collection of machine learning algorithms in java for different machine learning tasks.The algorithms are applied directly to different datasets. Pre-processing of datasets has been performed before using them in the experiments. Missing values were replaced by the attribute values such as means of attributes because datasets only contain numeric values. The attributes were also discretized by using filter of Discretize (10-bin discretization) in WEKA software. The data file normally used by WEKA is in ARFF file format, which consists of special tags to indicate different elements in the data file (foremost: attribute names, attribute types, and attribute values and the data).
3.2 Performance indicators
For comparative study, performance indicators such as accuracy, mean absolute error and F-measure based on precision and recall were used. Accuracy can be defined as the total number of correctly identified bugs divided by the total number of bugs, and is calculated by the equations listed below:
Accuracy = (TP + TN) / (TP+TN+FP+FN)
Accuracy (%) = (correctly classified software bugs/ Total software bugs) * 100
Precision is a measure of correctness and it is a ratio between correctly classified software bugs and actual number of software bugs assigned to their category. It is calculated by the equation below:
Precision = TP /(TP+FP)
Table 1. Datasets Information
CM1 JM1 KC1 KC2 KC3 MC1 MC2 MW1 PC1 PC2 PC3 PC4 PC5 AR1 AR6
Language C C C++ C++ Java C++ C C C C C C C++ C C
LOC 20k 315k 43k 18k 18k 63k 6k 8k 40k 26k 40k 36k 164k 29k 29
Modules 505 10878 2107 522 458 9466 161 403 1107 5589 1563 1458 17186 121 101
Table 2. Performance of different machine learning methods with cross validation test mode based on Accuracy
Supervised learning Unsupervised learning
Datasets Naye
Bayes MLP SVM Ada
Boost Bagging
Decision Trees
Random
Forest J48 KNN RBF K-means AR1 83.45 89.55 91.97 90.24 92.23 89.32 90.56 90.15 65.92 90.33 90.02
AR6 84.25 84.53 86.00 82.70 85.18 82.88 85.39 83.21 75.13 85.38 83.65
CM1 84.90 89.12 90.52 90.33 89.96 89.22 89.40 88.71 84.24 89.70 86.58
JM1 81.43 89.97 81.73 81.70 82.17 81.78 82.09 80.19 66.89 81.61 77.37
KC1 82.10 85.51 84.47 84.34 85.39 84.88 85.39 84.13 82.06 84.99 84.03
KC2 84.78 83.64 82.30 81.46 83.06 82.65 82.56 81.29 79.03 83.63 80.99
KC3 86.17 90.04 90.80 90.06 89.91 90.83 89.65 89.74 60.59 89.87 87.91
MC1 94.57 99.40 99.26 99.27 99.42 99.27 99.48 99.37 68.58 99.27 99.48
MC2 72.53 67.97 72.00 69.46 71.54 67.21 70.50 69.75 64.49 69.51 69.00
MW1 83.63 91.09 92.19 91.27 92.06 90.97 91.29 91.42 81.77 91.99 87.90
PC1 88.07 93.09 93.09 93.14 93.79 93.36 93.54 93.53 88.22 93.13 92.07
PC2 96.96 99.52 99.59 99.58 99.58 99.58 99.55 99.57 75.25 99.58 99.21
PC3 46.87 87.55 89.83 89.70 89.38 89.60 89.55 88.14 64.07 89.76 87.22
PC4 85.51 89.11 88.45 88.86 89.53 88.53 89.69 88.36 56.88 87.27 86.72
PC5 96.93 97.03 97.23 96.84 97.59 97.01 97.58 97.40 66.77 97.15 97.33
Mean 83.47 89.14 89.29 88.59 89.386 88.47 89.08 88.33 71.99 88.87 87.29
Recall is a ratio between correctly classified software bugs and software bugs belonging to their category. It represents the machine learning method’s ability of searching extension and is calculated by the following equation.
Recall = TP / (TP + FN)
F-measure is a combined measure of recall and precision, and is calculated by using the following equation. The higher value of F-measure indicates the quality of machine learning method for correct prediction.
F = (2 * precision * recall ) / (Precision + recall)
3.3 Experiment Procedure & Results
For comparative performance analysis of different machine learning methods, we selected 15 software bug datasets and applied machine learning methods such as NaiveBayes, MLP, SVM, AdaBoost, Bagging, Decision Tree, Random Forest, J48, KNN, RBF and K-means. We employed WEKA tool for the implementation of experiments. The 10- fold cross validation test mode was selected for the experiments.
Table 3. Performance of different machine learning methods with cross validation test mode based on mean absolute error
Supervised learning Unsupervised learning
Datasets NayeB ayes
ML
P SVM AdaBoost Bagging
Decision Trees
Random
Forest J48 KNN RBF K-means
AR1 0.17 0.11 0.08 0.12 0.13 0.12 0.13 0.13 0.32 0.13 0.11
AR6 0.17 0.19 0.13 0.22 0.24 0.25 0.22 0.23 0.25 0.22 0.17
CM1 0.16 0.16 0.10 0.16 0.16 0.20 0.16 0.17 0.16 0.17 0.14
KC1 0.18 0.21 0.15 0.22 0.20 0.29 0.19 0.20 0.18 0.23 0.17
KC2 0.16 0.22 0.17 0.22 0.22 0.29 0.22 0.23 0.21 0.23 0.21
KC3 0.15 0.12 0.09 0.14 0.14 0.17 0.14 0.13 0.39 0.15 0.12
MC1 0.06 0.01 0.01 0.01 0.01 0.03 0.01 0.01 0.31 0.01 0.01
MC2 0.27 0.32 0.28 0.39 0.37 0.40 0.35 0.32 0.35 0.41 0.31
MW1 0.16 0.11 0.08 0.12 0.12 0.15 0.12 0.12 0.18 0.12 0.13
PC1 0.11 0.11 0.07 0.11 0.10 0.14 0.09 0.10 0.12 0.12 0.08
PC2 0.03 0.01 0.00 0.01 0.01 0.02 0.01 0.01 0.18 0.01 0.01
PC3 0.51 0.14 0.10 0.16 0.15 0.21 0.15 0.15 0.36 0.18 0.13
PC4 0.14 0.12 0.11 0.15 0.14 0.16 0.14 0.12 0.43 0.20 0.13
PC5 0.04 0.03 0.03 0.04 0.03 0.06 0.03 0.03 0.33 0.05 0.03
Mean 0.16 0.14 0.10 0.15 0.15 0.18 0.14 0.14 0.27 0.16 0.13
Table 4. Performance of different machine learning methods with cross validation test mode based on F-measure
Supervised learning Unsupervised learning
Datas ets
NayeBay
es MLP SVM
AdaBoo
st Bagging
Decision Trees
Random
Forest J48 KNN RBF K-means AR1 0.90 0.94 0.96 0.95 0.96 0.94 0.96 0.95 0.79 0.95 0.94
AR6 0.90 0.91 0.93 0.90 0.92 0.90 0.92 0.90 0.84 0.92 0.90
CM1 0.91 0.94 0.95 0.95 0.95 0.94 0.94 0.94 0.91 0.95 0.93 JM1 0.89 0.90 0.90 0.90 0.90 0.90 0.90 0.88 0.80 0.90 0.86 KC1 0.90 0.92 0.92 0.91 0.92 0.92 0.92 0.91 0.89 0.92 0.91 KC2 0.90 0.90 0.90 0.88 0.90 0.89 0.89 0.88 0.86 0.90 0.88 KC3 0.91 0.94 0.95 0.95 0.95 0.95 0.94 0.94 0.72 0.95 0.93 MC1 0.97 1.00 1.00 1.00 1.00 1.00 1.00 1.00 0.81 1.00 1.00 MC2 0.82 0.78 0.82 0.80 0.81 0.77 0.80 0.78 0.76 0.81 0.77 MW1 0.90 0.95 0.96 0.95 0.96 0.95 0.95 0.95 0.89 0.96 0.93 PC1 0.94 0.97 0.96 0.96 0.97 0.97 0.97 0.97 0.94 0.96 0.96 PC2 0.99 1.00 1.00 1.00 1.00 1.00 1.00 1.00 0.90 1.00 1.00 PC3 0.60 0.94 0.95 0.95 0.94 0.95 0.94 0.94 0.77 0.95 0.93 PC4 0.92 0.94 0.94 0.94 0.94 0.93 0.94 0.93 0.72 0.93 0.92 PC5 0.98 0.99 0.99 0.98 0.99 0.98 0.99 0.99 0.80 0.99 0.99
Mean 0.89 0.93 0.942 0.93 0.94 0.93 0.93 0.93 0.82 0.93 0.92
i) The software bug repository datasets:
D= {AR1, AR6, CM1, JM1, KC1, KC2, KC3, MC1, MC2, MW1, PC1, PC2, PC3, PC4, PC5} ii) Selected machine learning methods
M = {Nayes Bayes, MLP, SVM, AdaBoost, Bagging, Decision Tree, Random Forest, J48, KNN, RBF, K-means}
Data pre-process:
a) Apply Replace missing values to D b) Apply Discretize to D
Test Model - cross validation (10 folds): for each D do for each M do
Perform cross-validation using 10-folds end for
Select accuracy
Select Mean Absolute Error (MAE) Select F-measure end for
Experiment procedure:
Output:
a) Accuracy
b) Mean Absolute Error c) F-measure
3.4 Experiment results
Table 2, 3 & 4 show the results of the experiment. Three parameters were selected in order to compare them such as Accuracy, Mean absolute error and F-measure. In order to compare the selected algorithms the mean was taken for all datasets and the results are shown in Figure 1, 2 & 3.
Figure 1. Accuracy results for selected machine learning methods
Figure 3. F-measure results for selected machine learning methods
4.
D
ISCUSSION&
C
ONCLUSIONAccuracy, F-measure and MAE results are gathered on various datasets for different algorithms as shown in Table 2, 3 & 4. The following observations were drawn from these experiment results:
NaiveBayes classifierfor software bug classification showed a mean accuracy of various datasets 83.47. It performed really well on datasets MC1, PC2 and PC5, where the accuracy results were above 95%. The worst performance can be seen on dataset PC3, where the accuracy was less than 50%. MLP also performed well on MC1 and PC2 and got overall accuracy on various datasets 89.14 %. SVM and Bagging performed really well as compared to other machine learning methods, and got overall accuracy of around 89 %. Adaboost got accuracy of 88.59, Bagging got 89.386, Decision trees achieved accuracy around 88.47, Random Forest got 89.08, J48 got 88.33 and in the case of unsupervised learning KNN achieved 71.99, RBF achieved 88.87 and K-means achieved 87.29. MLP, SVM and Bagging performance on all the selected datasets was good as compared to other machine learning methods. The lowest accuracy was achieved by KNN method.
The best MAE achieved by SVM method which is 0.10 on various datasets and got 0.00 MAE for PC2 dataset. The worst MAE was for KNN method which was 0.27. K-means, MLP, Random Forest and J48 also got better MAE around 0.14. In the case of F-measure, higher is better. Higher F-measure was achieved by SVM and Bagging methods which were around 0.94. The worst F-measure as achieved by KNN method which was 0.82 on various datasets.
A
CKNOWLEDGEMENTThe authors would like to thank Dr. Jagath Samarabandu for his constructive comments which contributed to the improvement of this article as his course work.
R
EFERENCES[1] Kumaresh, Sakhti and Baskaran, R. (2010) “Defect analysis and prevention for software process quality improvement”, International Journal of Computer Applications, Vol. 8, Issue 7, pp. 42-47. [2] Ahmad, Khalil and Varshney, Natasha (2012)“On minimizing software defects during new product
development using enhanced preventive approach”, International Journal of Soft Computing and Engineering, Vol. 2, Issue 5, pp. 9-12.
[3] Andersson, Carina (2007) “A replicated empirical study of a selection method for software reliability growth models”, Empirical Software Engineering, Vol.12, Issue 2, pp. 161-182.
[4] Fenton, Norman E. & Ohlsson, Nichlas (2000) “Quantitative analysis of faults and failures in a complex software system”, IEEE Transactions on Software Engineering, Vol. 26, Issue 8, pp. 797-814.
[5] Khoshgoftaar, Taghi M. & Seliya, Naeem (2004) “Comparative assessment of software quality classification techniques: An empirical case study”, Empirical Software Engineering, Vol. 9, Issue 3, pp. 229-257.
[6] Khoshgoftaar, Taghi M., Seliya, Naeem & Sundaresh, Nandani (2006) “An empirical study of predicting software faults with case-based reasoning”, Software Quality Journal, Vol. 14, Issue 2, pp. 85-111.
[7] Menzies, Tim., Greenwald, Jeremy & Frank, Art (2007) “Data mining static code attributes to learn defect predictors”, IEEE Transaction Software Engineering., Vol. 33, Issue 1, pp. 2-13.
[8] Spiewak, Rick & McRitchie, Karen (2008) “Using software quality methods to reduce cost and prevent defects”, Journal of Software Engineering and Technology, pp. 23-27.
[9] Shiwei, Deng (2009) “Defect prevention and detection of DSP-Software”, World Academy of Science, Engineering and Technology, Vol. 3, Issue 10, pp. 406-409.
[10] Trivedi, Prakriti & Pachori, Som (2010) “Modelling and analyzing of software defect prevention using ODC”, International Journal of Advanced Computer Science and Applications, Vol. 1, No. 3, pp. 75- 77.
[11] Nair, T.R. Gopalakrishan & Suma, V. (2010) “The pattern of software defects spanning across size complexity”, International Journal of Software Engineering, Vol. 3, Issue 2, pp. 53- 70.
[12] Lessmann, Stephen., Baesens, Bart., Mues, Christopher., & Pietsch, Swantje (2008) “Benchmarking classification models for software defect prediction: A proposed framework and novel finding”, IEEE Transaction on Software Engineering, Vol. 34, Issue 4, pp. 485-496.
[13] Sharma, Trilok C. & Jain, Manoj (2013) “WEKA approach for comparative study of classification algorithm”, International Journal of Advanced Research in Computer and Communication Engineering, Vol. 2, Issue 4, 7 pages.
[14] Kaur, Puneet Jai & Pallavi, (2013) “Data mining techniques for software defect prediction”, International Journal of Software and Web Sciences (IJSWS), Vol. 3, Issue 1, pp. 54-57.
[15] Wang, Tao., Li, Weihua., Shi, Haobin., & Liu, Zun. (2011) “Software defect prediction based on classifiers ensemble”, Journal of Information & Computational Science, Vol. 8, Issue 1, pp. 4241– 4254.
[16] Adiu, Surendra & Geethanjali, N. (2013) “Classification of defects in software using decision tree algorithm”, International Journal of Engineering Science and Technology (IJEST), Vol. 5, Issue 6, pp. 1332-1340.
[17] Dommati, Sunil J., Agrawal, Ruchi., Reddy, Ram M. & Kamath, Sowmya (2012) “Bug classification: Feature extraction and comparison of event model using Naïve Bayes approach”, International Conference on Recent Trends in Computer and Information Engineering (ICRTCIE'2012), pp. 8-12. [18] Xu Jie., Ho Danny. and Capretz Luiz Fernando (2010) "An empirical study on the procedure to derive
[19] G. Boetticher, Menzies, Tim & T. Ostrand, (2007) PROMISE Repository of Empirical Software Engineering Data, http://promisedata.org/, West Virginia University, Department of Computer Science.
[20] WEKA, http://www.cs.waikato.ac.nz/~ml/weka, accessed on December 13th, 2013.
AUTHORS
Saiqa Aleem received her MS in Computer Science (2004) from University of Central Punjab, Pakistan and MS in Information Technology (2013) from UAEU, United Arab Emirates. Currently, she is pursuing her PhD. in software engineering from University of Western Ontario, Canada. She had many years of academic and industrial experience holding various technical positions. She is Microsoft, CompTIA, and CISCO certified professional with MCSE, MCDBA, A+ and CCNA certifications.
Dr. Luiz Fernando Capretz has vast experience in the software engineering field as practitioner, manager and educator. Before joining the University of Western Ontario (Canada), he worked at both technical and managerial levels, taught and did research on the engineering of software in Brazil, Argentina, England, Japan and the United Arab Emirates since 1981. He is currently a professor of Software Engineering and Assistant Dean (IT and e-Learning), and former Director of the Software Engineering Program at Western. He was the Director of Informatics and Coordinator of the computer science program in two universities in Brazil. He has published over 200
academic papers on software engineering in leading international journals and conference proceedings, and co-authored two books: Object-Oriented Software: Design an Maintenance published by World Scientific, and Software Product Lines published by VDM-Verlag. His current research interests are software engineering, human aspects of software engineering, software analytics, and software engineering education. Dr. Capretz received his Ph.D. from the University of Newcastle upon Tyne (U.K.), M.Sc. from the National Institute for Space Research (INPE-Brazil), and B.Sc. from UNICAMP (Brazil). He is a senior member of IEEE, a distinguished member of the ACM, a MBTI Certified Practitioner, and a Certified Professional Engineer in Canada (P.Eng.). He can be contacted at lcapretz@uwo.ca; further information can be found at: http://www.eng.uwo.ca/people/lcapretz/
Dr. Faheem Ahmed received his MS (2004) and Ph.D. (2006) in Software Engineering from the Western University, London, Canada. Currently he is Associate Professor and Chair at Thompson Rivers University, Canada. Ahmed had many years of industrial experience holding various technical positions in software development organizations. During his professional career he has been actively involved in the life cycle of software development process including requirements management, system analysis and design, software development, testing, delivery and maintenance. Ahmed has authored and co-authored many peer-reviewed research articles in leading journals