Concentration in Knowledge Output: A case of
Economics Journals
Paul Gopuran Devassy Binoa , Sasidharan. Subashb, Ananthakrishnan
Ramanathan b
a TA Pai Management Institute, Manipal – b Indian Institute of Technology, Bombay
Abstract
This paper assesses the degree of author concentration in seven economics journals, which were published in India during 1990-2002. To measure the degree of author concentration, Lotka’s Law was used. Moreover, we also make an exploratory analysis of the geographic, economics subfield and institutional concentration in 704 economics journals. An important finding of this paper is that specialized journals in the sample report the highest degree of author concentration. This result is quite similar to the findings by Cox and Chung (1991). Furthermore, there are several instances showing that the journals lean towards certain norms; this may affect the flow of innovative ideas into economics. We conclude that a knowledge activity, involving the high degree of concentration and a biased publication process, may affect the flow of new ideas into the discipline.
JEL Classification: A14, B50, B52
Keywords: Concentration, Lotka’s Law
1. Introduction
This paper examines the degree of concentration that exists in the distribution of knowledge output among individuals. The analysis is based on seven economics journals, which were published in India during 1990-2002. It also gives an analysis of macro units of concentration such as geography, area and institution; for this purpose it covers 704 economics journals. Further, we discuss some aspects of the publication process, and explore how it affects the discipline. The analytic approach in this paper is of a mixed type. Lotka’s Law, following Cox and Chung (1991), is applied to the author data, while simple measures like the Herfindahl-Hirschman Index (HHI) and the share of top three institutions are used as the measures for the other units of concentration.
Journals, in any academic discipline, play a crucial role by facilitating the exchange of knowledge, and thereby contributing to the overall expansion of knowledge. An article, published in a journal, is often referred to as an item of knowledge output (Lovell, 1973); it provides a variety of benefits to its author. Naturally, a typical researcher will try to publish her papers in reputed journals. It is quite likely that there is an excess demand for such opportunities. The degree of scarcity is more severe in the prestigious journals. Unlike simple market clearing, the exchange between authors and a journal is more complex. In such an exchange, norms play a significant role. Each journal has its own norms. However, a few norms such as the degree of formalism are common across economics journals.1 Moreover, the decisions
by a journal’s editors and referees are often sensitive to such norms. The norms, which the journals adopt, have specific cultural contexts. In many instances, the norms evolve in the universities and schools of thought, and later the journals adopt them. Reflecting
on this cue, we can say that such institutions have a role in the publication process. An author has to comply with the norms for getting her article published while many lack the skills to fulfill them. The institutions often act as the conduits through which the authors get acquaintance with these norms.2 Such norms often constrain the chances of
an author, who is less familiar with the skills specific to these norms, from publishing her article. It is quite likely that the authors from the institutions, which have expertise in such skills, tend to have more publications.
The contents of this paper are as follows: Section 2 deals with the concentration in knowledge output. Section 3 covers the analysis of different concentration indicators. Section 4 discusses the issues related to the publication process. Section 5 concludes the paper.
2. Concentration in Knowledge Output
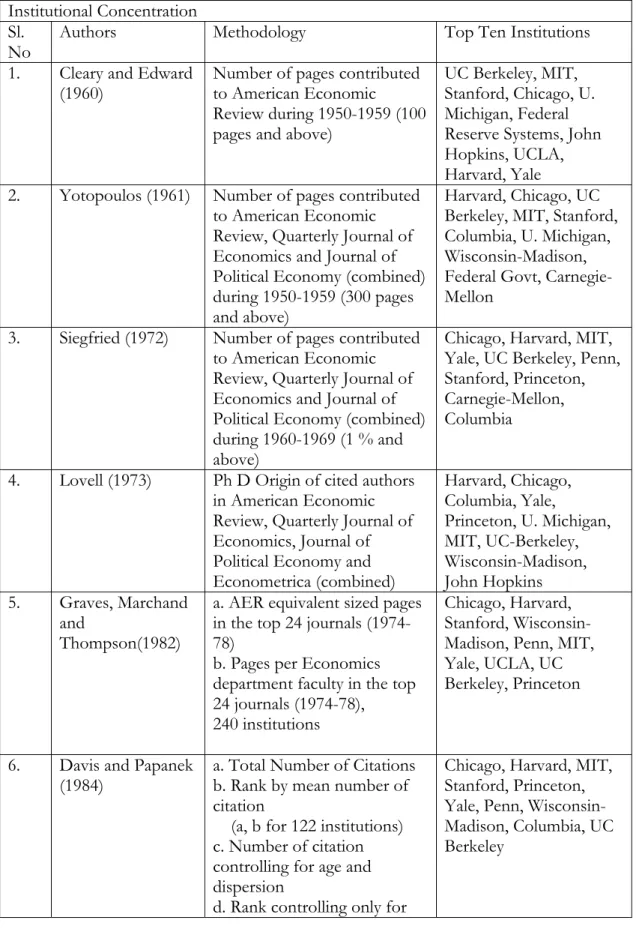
The knowledge output in economics has shown significant growth in recent times. One fourth of Social Science publications are in economics; it gets one third of the citations in Social Science (Ingwersen et al., 2001). Siegfried and Stock (1999) note that economics is one of the highly paid professions. Moreover, it is the only social science, which has the Nobel Prize as the top honour for scholars. However, the concentration in the knowledge output is a salient feature of economics journals (Hodgson and Rothman, 1999). On the issues related to this, quite a number of articles have been published (Table A1, Appendix). It is apparent from the studies that a few American institutions (e.g. Harvard, Stanford, MIT, Chicago, Yale etc.) occupy the top of the institutional order. Furthermore, Hodgson and Rothman (1999) bring out the issue of ‘institutional oligopoly in journals’. They say:
Overall, strong evidence has been presented of the domination of journal articles and editorships in economics by just a few U.S. academic institutions. Clearly, this evidence raises disturbing questions about the existence of an ‘oligopoly’ of U.S. institutions dominating leading journals in economics and economics research throughout the world… There is strong evidence here of the domination of publications in 30 leading economics journals by authors coming from, or located in, relatively few U.S. academic institutions. (p 172-174)
The authors identify the following reasons for the issue: editorial favouritism, path dependent processes, and increasing language compatibility within the institutions. As observed by them, the editorial favouritism does not adequately explain the concentration. However, Laband and Piette (1994) find editorial favouritism as a significant determinant of citation.3 The second factor, ‘path dependence’, refers to the
long survival of an institutional order, which has a few institutions at the top. If such a situation prevails, the journals may tend to show resistance to new ideas. Hodgson and Rothman (1999) reflect their concern about this issue:
2 Doctoral training is an example for this.
3 Laband and Piette (1994) specified citation as function of characteristics of journal, gender,
The danger with such a high degree of institutional concentration in the editors and authors of journals as is evidenced by the 1995 data is that it may be difficult for further change to take place. ‘Lock-in’ may occur, where specific institutions defend specific, and possibly outdated, ideas and approaches. In these circumstances, it would be quite difficult for alternative or innovative approaches to establish themselves. (p 182)
The third factor denotes that the institutions and journals agree on certain theoretical and methodological assumptions as the norms for publishing the articles. For instance, it is known that most of the institutions and journals agree on using the neoclassical models as the theoretical frame. Besides, there seems to be lesser disagreement among the institutions on the norms such as the degree of formalism. An appropriate proxy, for this factor, may be the trend towards increasing use of mathematics in economics (Stigler et al., 1995).4
3. Analysis of Concentration Indicators
3.1 Economics field, Geographic and Institutional Concentration
The present analysis covers 704 journals. There are three units of analysis, namely area, geography, and institution; they represent the sub-field in economics, the region, and the university, respectively. The data is obtained from a website.5
Herfindahl-Hirschman Index (HHI) has been computed to measure the area and geographic concentration. According to Hirschman (1964), HHI can be used for measuring concentration in an industry; it is the sum of squared market shares. The index may be expressed as:
(
)
2 1n
i i
HHI MS
=
=
∑
(1)Where MSi represents the market share (in per cent) of firm i, and there are n firms in the market.6 The distribution of journals over 19 subfields is given in table A2
(Appendix). Geographic distribution consists of nine regions.7
HHI values are classified into three categories: unconcentrated (HHI below 1000), moderately concentrated (HHI between 1000 and 1800), and highly concentrated (HHI above 1800).8 The results are presented in Table 1.
4 As regards the technical content in journal articles, as shown by Stigler et al. (1995), mathematics has
clear dominance over the natural language such as English.
5 <http://homepages.ulb.ac.be/~tcoupe/ranking.html>
6The HHI takes into account the relative size and distribution of the firms in a market; it approaches zero
when a market consists of a large number of firms of relatively equal size. The HHI increases both as the number of firms in the market decreases and as the disparity in size between those firms increases.
7The regions are Asia, Africa, Canada, European Union, Ex-USSR, Latin America, Middle East, Oceania,
and USA (http://homepages.ulb.ac.be/~tcoupe/ranking.html).
8 The U.S. Department of Justice and the Federal Trade Commission (1992) use this classification for
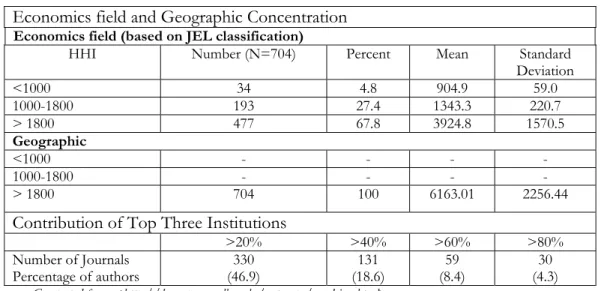
Table 1. Economics field, Geographic and Institutional Concentration
Economics field and Geographic Concentration Economics field (based on JEL classification)
HHI Number (N=704) Percent Mean Standard
Deviation
<1000 34 4.8 904.9 59.0
1000-1800 193 27.4 1343.3 220.7
> 1800 477 67.8 3924.8 1570.5
Geographic
<1000 - - - -
1000-1800 - - - -
> 1800 704 100 6163.01 2256.44
Contribution of Top Three Institutions
>20% >40% >60% >80%
Number of Journals Percentage of authors
330 (46.9)
131 (18.6)
59 (8.4)
30 (4.3)
Source: Computed from <http://homepages.ulb.ac.be/~tcoupe/ranking.html>
Nearly 66 % of journals report high degrees of field concentration (i.e. HHI greater than 1800). A major implication of this result is that there seems to be higher degree of specialization in the subject. However, the specialization need not imply that there is diversity in the language and methodology, which form the base for many articles in different fields. It is quite likely that competence in certain languages and methods enables a person to publish in a wide range of fields. In other words, the subject may have a variety of areas, but there is no desirable diversity in the language and methodology. Two major trends, i.e. neoclassical hegemony and mathematization of economics, seem to support this observation (Beed and Kane, 1991).
All the journals report high degrees of geographic concentration. As shown by the results, the United States of America (US) has a clear dominance over other regions in most of the journals, barring a few journals from the other regions. All the journals report HHI values greater than 1800, which implies high degree of geographic concentration; a large majority of authors in most of the journals is US based. The influx of the scholars from different countries to the US seems to be a major reason that explains the US dominance in the knowledge output (Coupe, 2001).
Since there are many institutions with small shares in knowledge output, HHI has a considerable limitation in capturing the degree of institutional concentration.9
Considering this limitation, the share of the top three institutions is taken as a measure of the institutional concentration. It can be observed from table 1 that the top three institutions for each of the 330 journals contribute more than 20 % of authors. At the same time, 30 journals have more than 80 % of authors, who are from the top three institutions. What emerges from the analysis is that a high degree of institutional concentration exists in a large number of journals.
There seems to be a relation between institutional concentration and geographic concentration.10 The contribution of the top three institutions and HHI represent these
two variables, respectively. The following model can specify the relation:
9 Especially, when the shares are less than one percent.
10 This relation satisfies the criteria such as statistical significance, no misspecification, and
Y = β0 +β1 X + u (2)
Y = HHI in respect of geographic concentration X = Contribution of top three institutions β0, β1 = Parameters, u = error
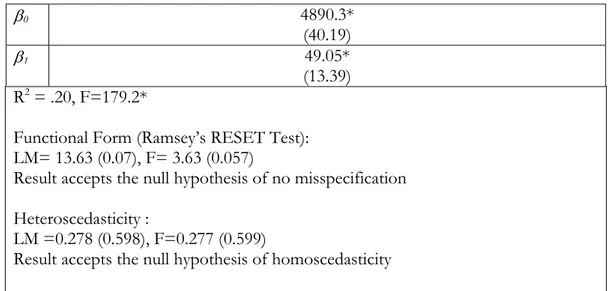
The OLS estimates indicate that there is a significant relation between Y and X.11 However, the low R2 seems to indicate the need for more explanatory variables in the model.
Table 2: Ordinary Least Square (OLS) Estimate of Equation 2
β0 4890.3*
(40.19)
β1 49.05*
(13.39) R2 = .20, F=179.2*
Functional Form (Ramsey’s RESET Test): LM= 13.63 (0.07), F= 3.63 (0.057)
Result accepts the null hypothesis of no misspecification
Heteroscedasticity :
LM =0.278 (0.598), F=0.277 (0.599)
Result accepts the null hypothesis of homoscedasticity
N= 704
* Statistically significant at 1%. Figures in parenthesis show ‘t’ values
3.2 Author Concentration
Among the units of concentration, that of author is the most basic. It is desirable to examine the author distribution to gain some insights on the degree of concentration at the micro level. In this we make use of Lotka's Law, which is not well-known in the economics profession and does therefore require a brief introduction.
3.2.1. Lotka’s Law
In 1926, Alfred J. Lotka analysed the author data to study scientific productivity.12 Based on the author distribution, he came up with a law (Lotka, 1926). The law states that the number of authors producing n papers relative to the number of authors producing one paper is the inverse of n2. Lotka’s Law can be stated as follows
(Subramanyam, 1979; Chung and Cox, 1990; Cox and Chung, 1991):
2 1
n a
an = , n = 1,2,3,…… (3)
11 The US has major share in most of the journals. However, a few top order institutions dominate the US
pie. This function is not a redundant one, since it is quite likely to have the combinations such as high Y and low X.
12 Decennial index of Chemical Abstracts and name index of Auerbach’s Geschichtstafeln der Physik were the
an = Number of authors publishing n papers n = Number of papers
This implies that for every 100 authors, who produce only one paper in a given period of time, there are 25 authors who produce two papers, and one author, who produces 10 papers. Lotka’s law is often used for examining either the scientific productivity or the author concentration. Cox and Chung have used a generalized Lotka’s Law (Cox and Chung, 1991), as follows:
1 n
a a
nβ
= n = 1,2,3…… (4)
where β is a constant.
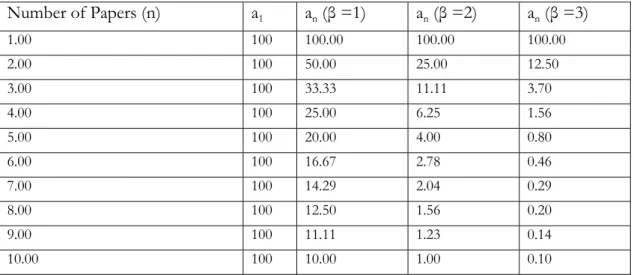
The fit of the Equation (4), for different values of β, is given in Appendix Table A3. As β and n increase, an declines. An increase in β implies a reduced author
concentration. The proportion of authors with just one paper increases with an increase in β and vice versa for a smaller β.
The procedure for testing Lotka’s Law, as described by Cox and Chung (1991), requires the comparison between observed and theoretical distributions of authors over number of papers.
As specified by Cox and Chung (1991), equation (4) can be converted into the following regression model for measuring the degree of concentration:
1
log an * log
n u a
⎛ ⎞
= β + ⎜ ⎟
⎝ ⎠ (5)
The negative parameter β indicates the degree of author concentration in any given journal. We shall refer to the absolute value of β. A low β, i.e., a low |β|, implies high degree of author concentration, and vice versa.
3.2.2 A Review of Cox and Chung (1991)
Cox and Chung (1991) studied author distribution in the top twenty economics journals during 1963-1988. The main objective of their study was to identify the empirical regularity in the author distribution; by ‘regularity’, they mean the prevalence of Lotka’s law in sample journals. By testing the prevalence of Lotka’s Law, two results are expected: (i) likelihood of multiple publications (ii) the degree of the author concentration. Cox and Chung (1991) put:
We believe that the identification of such empirical regularities is useful, since it will help assess both the likelihood of multiple publications in the economics literature and the degree of author concentration among different journals. (p 741)
of authors, who have authored multiple papers. Cox and Chung perform the Chi-square goodness-of-fit test for examining if Lotka’s Law applies to the data. The results show that only two out of 18 journals conform to Lotka’s Law. They then use the parameter β to measure the degree of author concentration—see equation (5). β is the slope of regression between the logarithm of ratio of number of authors with n papers to number of authors with just one paper (as dependent variable) and logarithm of number of papers (as independent variable).13 The estimated slopes vary from 2.04 to 3.11.14
Brookings Papers on Economic Activity and the Quarterly Journal of Economics report the highest and lowest concentration respectively (Table 6).
An interesting finding from the study is that journals like the Quarterly Journal of Economics, which cover general themes, show a high β, i.e., a low degree of concentration. On the other hand, the specialized journals like the Journal of Financial Economics exhibit a low β, i.e., a high degree of concentration. According to Cox and Chung, similar evidence can be found in other disciplines such as computer science and finance.15 To examine if the specialization explains the concentration, the βs were
regressed with the average number of papers the journal published per year and a dummy variable for specialization.16 The results show that the dummy variable has a
negative sign and is significant at the five per cent level. Cox and Chung (1991) note:
The regression result shows that the coefficient of the dummy variable has the predicted sign and is significant at the 5 % level, suggesting that the journals with specialized focus have a high author concentration. (p. 745)
Further, Cox and Chung (1991) observe that the institutional concentration is a salient feature of the journals. As noted by the authors, the top three schools produce more than half of the top 100 scholars, who contribute to the top 20 journals.
3.2.3 A Study of Author Concentration in Seven Indian Journals
Regional journals often have a critical role in shaping the life cycle of economists, particularly those outside the US/EU regions. It is therefore interesting to compare the Cox and Chung (1991) findings with degree of author concentration in India.
We study seven journals, which are published in India. They include the Indian Economic Review, the Indian Economic Journal, the Journal of Quantitative Economics, the Indian Economic and Social History Review, the Indian Journal of Economics, the Indian Journal of Agricultural Economics and the Artha Vijnana. These journals are published either by reputed universities (e.g. Delhi University) or by professional associations (e.g. Indian Society of Agricultural Economics). Among these journals, the Indian Journal of Agricultural Economics seems to be more specialized than the rest.17 On the other hand,
most of the articles in the Indian Economic Review, the Indian Journal of Economics, the Indian Economic Journal, andthe Artha Vijnana appear to be general in nature. The content in the Journal of Quantitative Economics and the Indian Economic and Social History Review seem to
13 Intercept was forced to be zero. Smaller the β, the author concentration will be higher. 14 We take absolute value ofβ.
15 For evidence on computer science literature, see Subramanyam (1979), and for the same on finance
literature, Chung and Cox (1990).
16 1 for specialized filed and 0 for general field
have moderate degree of specialization. Articles in all these journals are predominantly concerned with the Indian economy. It is difficult to say how representative this sample is because the India is yet to have an institutional mechanism to enforce the scientometric standards.18 In India, there are more than 150 universities and college
departments offering research graduate programmes in economics; many of them have their own journals. Most of these journals are published at irregular intervals, and they are not widely read by the professionals. However, the journals in our sample are widely subscribed by the universities. Different scholarly works on the Indian Economy have often cited these journals. A few of them have found mention in policy papers from the Reserve Bank of India and the Government of India Departments. Most Indian authors contribute to these journals, and most of the authors who publish in these journals have current affiliations to Indian institutions or happen to be their alumni.
It can be seen from Table 3 that the share of the top three institutions varies from 15 % to 30 %. Delhi University accounts for 17.6 % of the authors in the Indian Economic Review; the journal belongs to its School of Economics. Moreover, the Institute of Economic Growth, with the second largest share, has close links with Delhi University. The top three institutions constitute 28 % of authors in the Indian Economic and Social History Review, and the Delhi University has the highest share. However, for the Indian Economic Journal and Journal of Quantitative Economics, the shares of the top three institutions are just half of the figure representing the Indian Economic Review.
Table 3: Share of Top Three Institutional Contributors to a Sample of Indian Journals, 2000
Journal Rank 1 Rank 2 Rank 3
Institution % Institution % Institution %
Indian Economic Review
University of Delhi
17.6
Institute of Economic Growth, New Delhi
8.67
Bureau of statistics India
4.18
Indian Economic Journal
University of
Bombay 4.56 University of Delhi 3.03
Journal of Quantitative Economics
Indira Gandhi Institute of Development Research
(IGIDR) 6.9
Bureau of statistics
India 5.72 U CA
Riverside 4.08 Indian Economic
and Social History Review
University of Delhi
15.6
Jawaharlal Nehru University, New
Delhi 3.57
* Authors’ without institutional affiliation.19
Source: Compiled from http://homepages.ulb.ac.be/~tcoupe/ranking.html
18 India is yet to have scientometric measures (e.g. citation) for comparing the journals and the articles. It
is often found that even the basic information on the author and the discipline is not readily available. The Indian Council of Social Science Research publishes the database on abstracts. However, there is only partial coverage of the institutional affiliation of the authors. Moreover, the institutional affiliation of the authors is not provided by some journals. Some journals do not give even the JEL code of the article.
19Institutional affiliation is not given in ECONLIT (verified from Tom Coupe, the author of the database:
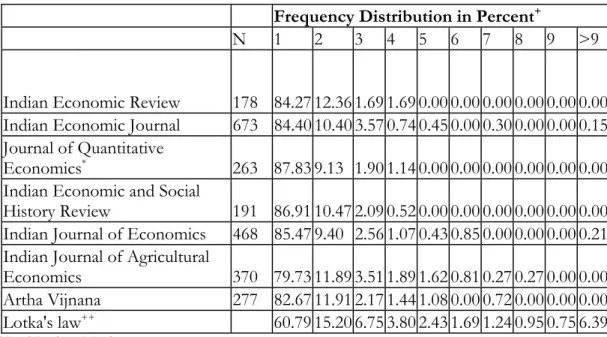
Table 4 shows the distribution of authors by the number of articles in the journals in the sample during the period 1990-2002. In order to test if Lotka’s Law is applicable to the journals in the present sample, we can compare the observed distribution against the distribution predicted by Lotka’s Law. It can be seen from the data that the percentage of authors with just one article varies from 80 to 88 against the prediction of Lotka’s Law that these authors should constitute 61 % of the total, i.e., the Indian journals do not conform to Lotka’s Law. However, the author distribution in the field specific Indian Journal of Agricultural Economics is the closest to Lotka’s Law. This agrees with the findings of Cox and Chung (1991), who show that the Journal of Financial Economics, one of the highly specialized journals in the sample, is closest to Lotka’s Law. In other words, these journals have a higher proportion of authors with more than one article than the others. On the other hand, the proportion of authors with just one article is lower in the specialized journals than in the other journals. This phenomenon calls for further research.20
Table: 4: Frequency Distribution of Authors by Number of Publications, 1990-2002
Frequency Distribution in Percent+
N 1 2 3 4 5 6 7 8 9 >9
Indian Economic Review 178 84.2712.36 1.69 1.69 0.00 0.00 0.00 0.00 0.00 0.00 Indian Economic Journal 673 84.40 10.40 3.57 0.74 0.45 0.00 0.30 0.00 0.00 0.15 Journal of Quantitative
Economics* 263 87.83 9.13 1.90 1.14 0.00 0.00 0.00 0.00 0.00 0.00
Indian Economic and Social
History Review 191 86.91 10.47 2.09 0.52 0.00 0.00 0.00 0.00 0.00 0.00 Indian Journal of Economics 468 85.47 9.40 2.56 1.07 0.43 0.85 0.00 0.00 0.00 0.21 Indian Journal of Agricultural
Economics 370 79.73 11.89 3.51 1.89 1.62 0.81 0.27 0.27 0.00 0.00 Artha Vijnana 277 82.67 11.91 2.17 1.44 1.08 0.00 0.72 0.00 0.00 0.00 Lotka's law++ 60.79 15.20 6.75 3.80 2.43 1.69 1.24 0.95 0.75 6.39
N = Number of Authors.
+ Percentage of authors publishing ‘n’ papers. * For the period 1990-2001
++ The proportions of authors predicted by Lotka’s law.
Source: tabulated from the data compiled by authors from different journals
The conformity of the observed distribution of authors with Lotka’s distribution and can be tested for each journal by conducting the chi-square goodness-of-fit test. We start with a null hypothesis that there is no difference between Lotka’s and the observed distribution. The results (Table 5) report the rejection of the null hypothesis for all the
20 It is quite likely that an author with only one article is younger than one with multiple articles (see
journals. Moreover, Cox and Chung (1991) report the rejection of the null hypothesis for 18 out of 20 journals.21
Table 5: Indian Economics Journals—Using the Generalised Lotka’s Law to Test Author Concentration, 1999-2000
Chi-Square Statistics for Lotka’s Law
Author Concentration
χ2 β t F R2
Indian Economic Review 38.52*+ -3.06* -14.9 224 0.98
Indian Economic Journal 137.11*+ -3.1* -32.18 1035 0.99
Journal of Quantitative Economics 70.65*+ -3.27* -35.15 1235 0.99
Indian Economic and Social History
Review 49.26*+ -3.5* -27.35 748 0.99
Indian Journal of Economics 102*+ -2.86* -22.19 492.4 0.99
Indian Journal of Agricultural Economics 43.86*+ -2.7* -43.04 1852 0.99
Artha Vijnana 48.52*+ -2.72* -21.31 453 0.99
* Statistically significant at the one per cent.
+ Rejection of the Null Hypothesis of the prevalence of Lotka’s Law
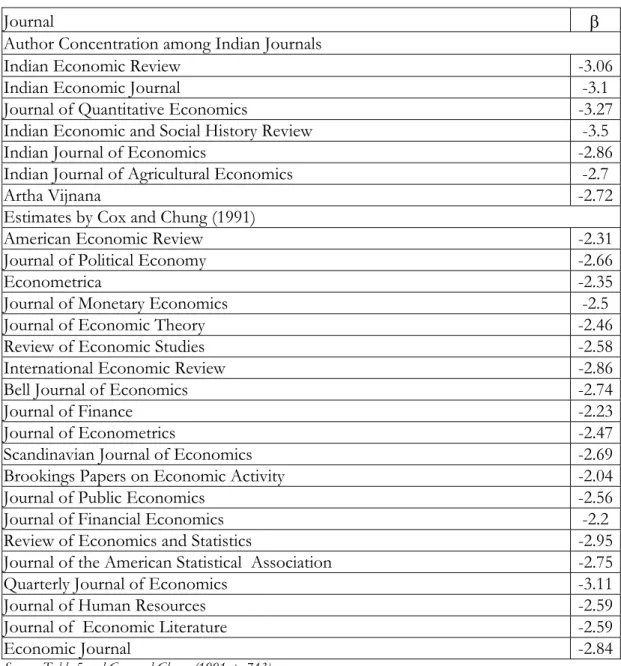
The concentration measure β ranges from 2.7 to 3.5 (Table 5).22 All coefficients
are statistically significant at the one per cent level. The Indian Journal of Agricultural Economics reports the highest author concentration, and the Indian Economic and Social History Review has the lowest concentration. The institutional concentration with respect to this journal (i.e. share of top three institutions) is the second highest. This observation is consistent with the findings by Cox and Chung (1991), who observe:
It is interesting to note that journals which have been known as exhibiting higher institutional concentrations among their authors do not exhibit higher individual concentrations among their contributors. (p 745)
In other words, this result suggests that the competition for publication is limited to the authors from the top institutions. Another important observation from table 5 is that the Indian Journal of Agricultural Economics, the most specialized journal in the sample, shows the highest author concentration. Further, Cox and Chung (1990) also show a similar finding. They find a significant relation between the degree of specialization and the degree of author concentration. They infer that the higher the degree of specialization, the higher will be the degree of author concentration.
It is interesting to note that the degree of author concentration in Indian journals is, in general, considerably lower than that of the leading journals that Cox and Chung (1991) report upon. (Table 6). However, to generalize the relations, which are
21 The null hypothesis is accepted for the Journal of Financial Economics and the Brookings Papers on Economic Activity.
discussed in this paper requires more rigorous approach in terms of sample and measurement.
Table 6: Author Concentration: A comparison between Indian Journals and Cox and Chung (1991)
Journal β
Author Concentration among Indian Journals
Indian Economic Review -3.06
Indian Economic Journal -3.1
Journal of Quantitative Economics -3.27
Indian Economic and Social History Review -3.5
Indian Journal of Economics -2.86
Indian Journal of Agricultural Economics -2.7
Artha Vijnana -2.72
Estimates by Cox and Chung (1991)
American Economic Review -2.31
Journal of Political Economy -2.66 Econometrica -2.35
Journal of Monetary Economics -2.5
Journal of Economic Theory -2.46
Review of Economic Studies -2.58
International Economic Review -2.86
Bell Journal of Economics -2.74
Journal of Finance -2.23
Journal of Econometrics -2.47
Scandinavian Journal of Economics -2.69
Brookings Papers on Economic Activity -2.04
Journal of Public Economics -2.56
Journal of Financial Economics -2.2
Review of Economics and Statistics -2.95
Journal of the American Statistical Association -2.75
Quarterly Journal of Economics -3.11
Journal of Human Resources -2.59
Journal of Economic Literature -2.59
Economic Journal -2.84
Source: Table 5 and Cox and Chung (1991, p. 743)
We are doubtful whether any scholarly work has tested Lotka’s Law in Indian economics journals in India before.23 However, we found a recent paper, which tests the
prevalence of Lotka’s Law in Indian Physics during 1800-1945 (Gupta et al., 1998). The paper reports that the Lotka’s distribution is applicable to the initial stages of the discipline’s growth (i.e. during 1800-1920). It is shown in the paper that for the remaining period, 1920-1945, the period in which Indian physics exhibited major growth, the data do not fit Lotka’s Law. An important limitation of the study is that only aggregate data are tested, not that for individual journals.
4. Publication Process
A major issue, which is related to the publication process, which is worth considering, is the growing publication lag. Ellison (2002a), Trivedi (1993), and Mason et al. (1992) address the issues related to the publication lag. These papers report the publication lag at different points of time. Ellison (2002b) proposes the q-r theory and tries to explain the phenomenon of the publication lag. This theory specifies that two characteristics of an article determine whether it is accepted for publication, the quality of its ideas, q, and the polish of the article, r. According to his theory, r is given more weight than q by the editors and referees of the journals. As a result, more time is spent on polishing the article so that the chance of its acceptance by the journal is improved. A likely consequence of the lag, according to Ellison, is that other scholars, who come up later with similar ideas, may get their article published earlier in another journal, thereby robbing the credit for a new idea.
Gans and Shepherd (1994) cite a few instances of the rejection of papers, which became path-breaking works in economics (table A4, Appendix). Referees and editors, according to Gans and Shepherd, tend to show insensitivity to the novel ideas, which may even change the scope of the discipline. George Akerlof's seminal contribution, 'The Market for Lemons: Quality, Uncertainty and the Market Mechanism', is a remarkable case of rejection. Gans and Shepherd narrate Akerlof’s ordeal (1994):
Before the Quarterly Journal of Economics finally accepted Akerlof's paper four years after he first sought to publish it, three journals called it a lemon... The rejections discouraged Akerlof. Akerlof believes that journal editors refused the article both because they feared the introduction into economics of informational considerations and because they disliked the article's readable style. (pp. 171)
Gans and Shepherd (1994) cite a number of such cases. It can be observed from Table A4 (Appendix) that all the authors of these rejected papers are affiliated to top institutions. One would like to believe that the author’s efforts help her to attain the publication rather than she gets the support from the institutions. Nevertheless, the literature shows instances of the institution finally coming to the rescue of the author. Paul Krugman’s experience can be a good case of institutional intervention helping the author. Krugman sent his article ‘Increasing Returns, Monopolistic Competition, and International trade’ to the Quarterly Journal of Economics. He got the rejection letter after eight months. Finally, the paper was published in the Journal of International Economics (JIE). Jagdish Bhagwati, the editor of JIE at that point of time, vetoed two referee's objection and accepted Krugman's work. Gans and Shepherd (1994) quote Bhagwati :
I published it myself despite two adverse referee reports by very distinguished experts on the theory of increasing returns! It did take some courage and also a strong sense of the importance of the paper for me to do so, since Krugman had been my student and normally I would lean over backwards not to publish my own students' work. (p 171)
It is doubtful if the effort and quality get more weight than the factors such as the luck and compliance with the norms when the journals accept the papers for the publication.
5. Conclusion
A large number of journals (out of 704) show the high degrees of field, geographic, and institutional concentration. The author concentration is measured for seven journals, which are published in India. There are similarities between our findings and Cox and Chung (1991); for instance, the relation between specialization and degree of concentration, which emerge from the discussion in this paper, is also a major finding by Cox and Chung. Furthermore, the tests of Lotka’s Law show results which are similar to those of Cox and Chung. An important cue, drawn from the literature, is that the competition for the publication in the prestigious journals is largely confined to the authors from institutions of repute; this is also applicable to leading Indian journals such as the Indian Economic Review.
Given the high degrees of concentration, the publication lag is a major issue that emerges from the literature on the publication process; this has been evolving as a norm, which often affects decision-making in journals (Ellison, 2000b). This evolution has a few consequences, which may even affect the growth of the discipline. Ellison’s theory that polish replaces the quality of the content of economics journals is quite relevant in this context; this theory shows similarities with the theory of institutional oligopoly (Hodgson and Rothman, 1999). For instance, Hodgson and Rothman argue that the lock-in that prevails in the profession may affect the flow of innovative ideas into Economics. Future research may look into the relation between degree of concentration and scientific progress in economics.
References
Beed C., Kane O. (1991), ‘What is the Critique of the Mathematization of Economics’, Kyklos,.44, 581-612.
Chung K. H., Cox R. A. K (1990), ‘Patterns of Productivity in the Finance Literature: A Study of the Bibliometric Distributions’, Journal of Finance, 45, 301-309.
Cleary F. R.,. Edwards D. J (1960), ‘The Origins of the Contributors to the A. E. R. During the Fifties’, American Economic Review, 50, 1011-1014.
Coupe T. (2001), ‘Revealed Performances: World Wide Ranking of Economics Departments and Economists, 1969-2000’, downloadable at <http://homepages.ulb.ac.be/~tcoupe/ranking.html>
Cox R. A. K, Chung K. H. (1991), ‘Patterns of research Output and Author Concentration in economics Literature’, Review of Economics and Statistics, 73, 740-747.
Davis P., Papanek G. F.. (1984), ‘Faculty Ratings of Major Economics Departments by Citation’, American Economic Review, 74, 225-230.
Dusansky R., Vernon C. J. (1998), ‘Ranking of US Economics Departments’, Journal Economic Perspectives, 12, 157-70.
Ellison G. (2002a), ‘The Slowdown of economics Publishing Process’, Journal of Political Economy, 110, 947-993
Ellison G. (2002b), ‘Evolving Standards for Academic Publishing: A q-r Theory’, Journal of
Gans J.S., Shepherd G.B.(1994), ‘How Are the Mighty Fallen: Rejected Classic Articles by Leading Economists’, Journal of Economic Perspectives, 8, 165-179.
Graves P. E.,. Marchand J. R, Thompson G.(1982), ‘Economics Departmental Ranking: Research Incentives, Constraints and Efficiency’, American Economic Review, 72, 1131-1141. Gupta B. M., Sharma L., Kumar S. (1998), ‘Literature Growth and Author Productivity in
Indian Physics’, Information Processing & Management, 34, 121- 131
Hirsch B. T., Randall A., Brooks J., Moore J. B. (1984), ‘Economics Departmental Rankings: Comment’, American Economic Review, 74, 822-26.
Hirschman A. O. (1964), ‘The Paternity of an Index’, American Economic Review, 56, 761-762. Hodgson G. M., Rothman H. (1999), ‘The Editors and Authors of Economics Journals: A Case
of Institutional Oligopoly’, Economic Journal, 109, 165-186.
Hogan T. D. (1984), ‘Economics Departmental Rankings: Comment’, American Economic Review,
74, 827-33.
Ingwersen P., Larsen B., Noyons E. (2001), ‘Mapping National Research Profiles in Social Science Disciplines’, Journal of Documentation, 57, 715-740.
Kalaitzidakis P., Theofanis M., Thanasis S. (1999), ‘European Economics: An Analysis Based on Publications in the Core Journals’, European Economic Review, 43, 1150-1168.
Kocher M. G., Sutter M. (2001), ‘The Institutional Concentration of Authors in Top Journals of Economics During the Last Two Decades’, Economic Journal, 111, 405-421.
Laband D., Piette M. (1994), ‘Favouritism versus Search for Good Papers: Empirical Evidence Regarding the Behaviour of Journal editors’, Journal of Political Economy, 102, 194-203.
Liebowitz, S. J., J. P. Palmer (1988), ‘Assessing Assessments of Economics Departments’, Quarterly Review of Economics and Business, 28, 88-113.
Lotka A. J (1926), ‘The Frequency Distribution of Scientific Productivity’, Journal of the Washington Academy of Sciences, 16, 317-23.
Lovell M. C. (1973), ‘The Production of Economic Literature: An Interpretation’, Journal of Economic Literature, 11, 27-55.
Mason P. M., Steagall J. W., Fabritius, M. M. (1992), ‘Publication delays in Economics: What to do about them’, Applied Economics, 24, 859-874.
Scott L., Mitias P. (1996), ‘Trends in Rankings of Economics Departments in the US: An Update’, Economic Inquiry, 34, 378-400.
Siegfried J., Stock W. (1999), ‘The Labour Market for New Ph D Economists’, Journal of Economic Perspectives, 13, 115-134.
Siegfried J. (1972), ‘The Publishing of Economic Papers and Its Impact on Graduate Faculty Ratings, 1960-1969’, Journal of Economic Literature, 10, 31-49.
Stigler G. J., Stigler S. M., Friedland C. (1995), ‘The Journals of Economics’, Journal of Political Economy, 103, 331-359
Subramanyam K. (1979), ‘Lotka’s Law and Computer Science Literature’, IEEE Transactions on Professional Communication, 22, 187-189.
Thursby J. G. (2000), ‘What do We Say About Ourselves and What does it Mean? Yet Another
Look at Economics Department Research’, Journal of Economic Literature, 38, 383-404. Trivedi P. K. (1993), ‘An Analysis of Publication Lags in Econometrics’, Journal of Applied
Econometrics, 8, 93-100.
U.S. Department of Justice and Federal Trade Commission (1997), Merger Guidelines downloadable at <http://www.usdoj.gov/atr/public/guidelines/horiz_book/toc.html> Yotopoulos, P. (1961), ‘Institutional Affiliation of the Contributors to Three Professional
Appendix
Table A1: An Outline of Literature on Institutional and Regional Concentration in Economics Journals
Institutional Concentration Sl.
No
Authors Methodology Top Ten Institutions
1. Cleary and Edward (1960)
Number of pages contributed to American Economic Review during 1950-1959 (100 pages and above)
UC Berkeley, MIT, Stanford, Chicago, U. Michigan, Federal Reserve Systems, John Hopkins, UCLA, Harvard, Yale 2. Yotopoulos (1961) Number of pages contributed
to American Economic Review, Quarterly Journal of Economics and Journal of Political Economy (combined) during 1950-1959 (300 pages and above)
Harvard, Chicago, UC Berkeley, MIT, Stanford, Columbia, U. Michigan, Wisconsin-Madison, Federal Govt, Carnegie-Mellon
3. Siegfried (1972) Number of pages contributed to American Economic Review, Quarterly Journal of Economics and Journal of Political Economy (combined) during 1960-1969 (1 % and above)
Chicago, Harvard, MIT, Yale, UC Berkeley, Penn, Stanford, Princeton, Carnegie-Mellon, Columbia
4. Lovell (1973) Ph D Origin of cited authors in American Economic Review, Quarterly Journal of Economics, Journal of Political Economy and Econometrica (combined)
Harvard, Chicago, Columbia, Yale,
Princeton, U. Michigan, MIT, UC-Berkeley, Wisconsin-Madison, John Hopkins
5. Graves, Marchand
and
Thompson(1982)
a. AER equivalent sized pages in the top 24 journals (1974-78)
b. Pages per Economics department faculty in the top 24 journals (1974-78),
240 institutions
Chicago, Harvard, Stanford, Wisconsin-Madison, Penn, MIT, Yale, UCLA, UC Berkeley, Princeton
6. Davis and Papanek (1984)
a. Total Number of Citations b. Rank by mean number of citation
(a, b for 122 institutions) c. Number of citation controlling for age and dispersion
d. Rank controlling only for
age
e. Rank controlling for dispersion (c, d, e for 40 institutions)
7. Hirsch et al. (1984) Total pages (1978-83) 240 institutions
(Methodology of Greaves, Marchand and Thompson (1982))
Chicago, Harvard,
Stanford, London School of Economics, Penn, Yale, Northwestern, MIT, Wisconsin-Madison, UC Berkeley 8. Hogan (1984) a. Total Pages by current
faculty
b. Total Pages by listed affiliation
(50 institutions)
Harvard, Princeton, MIT, Yale, Chicago, Stanford, Wisconsin-Madison, Minnesota, UCLA, Penn
9. Liebowitz and
Palmer (1988)
a. Citation based on various weighting schemes
b. Citation based on publications
(60 institutions)
Chicago, MIT, Harvard, Stanford, Princeton, UCLA, Minnesota, Yale, Columbia, Northwestern
10. Scott and Mitias (1996)
a. Ranking based on flow of pages 1984-93
(240 institutions) b. Departmental Stock Ranking of Pages in top 36 journals (80 institutions) 1984-93
(Methodology of Greaves, Marchand and Thompson (1982)
Harvard, Chicago, Penn, MIT, Northwestern, Stanford, Princeton, U. Michigan, UC Berkeley, UCLA
11. Dusansky and
Vernon (1998)
a. Aggregate adjusted pages b. Adjusted Pages per faculty (80 institutions)
Princeton, Harvard, MIT, Penn, Northwestern, New York U, Boston, Yale, Stanford, U C San Diego
12. Kalaitzidakis et al. (1999)
a. Ranking Based on total AER standardized pages b. Ranking based on total unadjusted pages
(198 institutions)
Chicago, Harvard, MIT, Northwestern, Princeton, Penn, Stanford, Yale, Columbia, UC-Berkeley
13 Hodgson and
Rothman (1999)
a. Institutional origin (Ph D School) and Current affiliation of authors
b. Institutional origin (Ph D School) and Current affiliation of Editors
(30 journals)
Harvard, MIT, Chicago, Stanford, U. Michigan, UC Berkeley, Princeton, Yale,
13. Thursby (2000) Performance perception (104) institutions
Harvard, Stanford, Chicago, MIT, Princeton, Yale, UC-Berkeley, Penn, Northwestern, Minnesota 14. Coupe (2001) Ranking on the basis of
citation and publication counts (200 institutions) 1969-2000
Harvard, Chicago, Penn, Stanford, MIT, UC-Berkeley, Northwestern, Yale, U. Michigan, Columbia
Regional Concentration
1 Hodgson and
Rothman (1999)
Regional Distribution of Institutional origin (Ph D School) and Current affiliation of authors
(30 journals) and Editors
U.S.A ‘s share is in the range of 65-83%
2 Kocher and Sutter
(2001)
Regional Distribution of Institutional origin (Ph D School) and Current affiliation of authors
(15 journals, 1977-1997)
U.S.A ‘s share is in the range of 65-85%
Table A2: The Distribution of Journals over the Sub fields [2000]
JEL Code Sub field Number of
Journals
Percentage
A General Economics and Teaching 5 0.71 B Methodology and History of Economic
Thought
19
2.70 C Mathematical and Quantitative Methods 25 3.55
D Microeconomics 51 7.24
E Macroeconomics and Monetary Economics 84 11.93
F International Economics 63 8.95
G Financial Economics 76 10.80
H Public Economics 16 2.27
I Health, Education and Welfare 16 2.27 J Labour and Demographic Economics 60 8.52
K Law and Economics 10 1.42
L Industrial Organization 39 5.54
M Business Administration and Business Economics
17
2.41
N Economic History 19 2.70
O Economic Development, Technical Change and Growth
87
12.36
P Economic systems 31 4.40
Q Agricultural and Natural Resources 47 6.68 R Urban, Rural and Regional Economics 37 5.26
Z Other Topics 2 0.28
Total 704 100
Table A3: Fitting Lotka’s Law for different values of β (assuming a1 = 100)
Number of Papers (n) a1 an (β =1) an (β =2) an (β =3)
1.00 100 100.00 100.00 100.00
2.00 100 50.00 25.00 12.50
3.00 100 33.33 11.11 3.70
4.00 100 25.00 6.25 1.56
5.00 100 20.00 4.00 0.80
6.00 100 16.67 2.78 0.46
7.00 100 14.29 2.04 0.29
8.00 100 12.50 1.56 0.20
9.00 100 11.11 1.23 0.14
10.00 100 10.00 1.00 0.10
Note: β
n a an = 1
Source: Hypothetical Data
Table A4: Rejected Papers*
Authors Name Rejected Paper: Title
Akerlof, George The Market for Lemons
Arthur W Brain Competing Technologies, Increasing Returns, and Lock-In by Historical Events
Becker Gary S Competition and Democracy Becker Gary S A Theory of the Allocation of Time Bhagwati, Jagdish Immiserizing Growth: A Geometrical Note Black, Fischer, and Myron
Scholes
The Pricing of Options and Corporate Liabilities
Buchanan, James M External and Internal Public Debt
Chichilinisky, Graciela Basic Goods, Commodity Transfers and the New International Economic Order
Corden, W. Max The Structure of a tariff System and the Effective Protective Rate Debreu, Gerard Numerical Representations of Technological change
Fisher, Franklin M, Zvi Griliches, Carl Kaysen
The Costs of Automobile Model Changes Since 1949
Friedman Milton Professor Pigou’s Method for Measuring Elasticities of Demand from Budgetary Data
Harrod, Roy The Law Decreasing Costs
Hotelling, Harold Economics of Exhaustible Resources
Jonung, Lars Ricardo on Machinery and the present Unemployment: An Unpublished Manuscript by Knut Wicksell
Kalecki, Michal A Theorem on Technical Progress
Krugman, Paul Increasing Returns, Monopolistic Competition, and International Trade
Krugman, Paul Target Zones and Exchange Rate Dynamics
Rosen
Lucas Robert E Expectations and the Neutrality of Money May, Robert, and John
Beddington
Nonlinear Difference Equations: Stable Points, Stable Cycles, Chaos
May, Robert Simple Mathematical Models with Very Complicated Dynamics Modigliani Franco Fluctuations in the Savings-Income Ratio: A Problem in Economic
Forecasting
Ohlin, Bertil Interregional and International Trade Scitovsky, Tibor A Reconsideration of the Theory of Tariffs
Sharpe, William Capital Asset Prices: A Theory of Equilibrium Under Conditions of Risk
Stolper, Wolfgang, and Samuelson, Paul A.
Protection and Real Wages
*These articles were later published in other journals.


![Table A2: The Distribution of Journals over the Sub fields [2000]](https://thumb-eu.123doks.com/thumbv2/123dok_br/17070836.235389/17.892.146.775.138.559/table-a-distribution-journals-sub-fields.webp)