Fledging Birds in the Field? A Test Using Common Terns
(
Sterna hirundo)
Christy N. Wails*, Stephen A. Oswald, Jennifer M. Arnold
Division of Science, The Pennsylvania State University, Berks Campus, Reading, Pennsylvania, United States of America
Abstract
Age is a key component of fitness, affecting survival and reproductive capacities. Where it is not possible to study known individuals from birth, morphometrics (predominantly patterns of plumage development for birds) are most often used to estimate age. Although criteria for age estimations exist for many species, the degree to which these criteria improve the precision of estimates remains to be tested, restricting their widespread acceptance. We develop a photographic tool for estimating ages of Common Tern (Sterna hirundo) chicks and test it using 100 human observers of varying prior experience across four breeding colonies (three North American sites and one European site) and under controlled laboratory conditions. We followed the design approach of other morphometric tools, expanding it to create a user-friendly guide (divided into six age groupings). The majority (86%) of observers improved in chick-aging accuracy when using the tool by an average of 20.1% (61.4 SE) and correctly estimated 60.3% (61.4) of chick ages. This was similar to the intrinsic aging ability of our best field observer (63.3%). Observers with limited experience showed the greatest increases in chick-aging accuracy over experienced observers who likely had established a method for estimating chick ages prior to using the tool. Even the best observers only correctly estimated ages of chicks 62.9% (62.8) of the time in the field and 84.0% (62.9) of the time in the lab when using the tool and typically underestimated ages. This indicates that developmental variation between individual chicks can prevent completely reliable age estimates and corroborates the few existing data that suggest that morphometric criteria fail to achieve robust levels of accuracy and may introduce error into studies that rely on them. We conclude that novel approaches for estimating age, not only morphometric criteria, must be pursued.
Citation:Wails CN, Oswald SA, Arnold JM (2014) Are Morphometrics Sufficient for Estimating Age of Pre-Fledging Birds in the Field? A Test Using Common Terns (Sterna hirundo). PLoS ONE 9(11): e111987. doi:10.1371/journal.pone.0111987
Editor:Hans-Ulrich Peter, Institute of Ecology, Germany
ReceivedMay 14, 2014;AcceptedOctober 7, 2014;PublishedNovember 6, 2014
Copyright:ß2014 Wails et al. This is an open-access article distributed under the terms of the Creative Commons Attribution License, which permits unrestricted use, distribution, and reproduction in any medium, provided the original author and source are credited.
Data Availability:The authors confirm that all data underlying the findings are fully available without restriction. All relevant data are within the paper and its Supporting Information files.
Funding:Funding for this study was provided by the Pennsylvania State University Berks Campus, Pennsylvania State University Summer Discovery Grant (2013), Ned Smith Center for Nature and Art, Friends of Presqu’ile Provincial Park and Baird Ornithological Club. The funders had no role in study design, data collection and analysis, decision to publish, or preparation of the manuscript.
Competing Interests:The authors have declared that no competing interests exist.
* Email: [email protected]
Introduction
Age is a key component of fitness, often influencing survival and reproductive capacities [1]. Consequently, determining age is a key consideration in many areas of ecology, including population dynamics [2], life history evolution [3], development [4], senescence [5], behavioral ecology [6], and for conservation initiatives [7]. For birds, addressing population declines in a range of species requires detailed data on productivity that often rely on accurate estimations of chick ages [7], [8]. The nestling period can be studied more easily than other life stages [9] but, because chick survival is often strongly dependent on age, without an accurate way to estimate age, productivity can easily be over- or underestimated depending on survey frequency or methodology [10], [11].
While the most accurate way to determine age is to band chicks at hatching and visit nests at regular intervals [12], [13], this is time-consuming and labor-intensive, and often not practical due to difficulties accessing nesting sites [14], financial or logistical constraints [15], [16], or the sensitivity of species to human
disturbance [17], [18]. Even colonial species often breed asynchronously, exhibiting a large spread around modal laying and hatching dates, e.g. [19], [20], and thus during a given study period there will be chicks of a wide variety of ages, e.g. [21], [22], further restricting the practicality of following many individual chicks from hatching.
published data tables or formulae that guide the user to estimate ages based on certain morphometric measurements (see Table S1 for details). Generally, species-specific tools designed for estimating ages of chicks are scarcer than publications elucidating or comparing age-related developmental changes that impact life history, breeding, or survivorship (Table S1).
Of those tools that do exist (Table S1), only three have provided some form of testing to indicate the accuracy that might result from their use [29–31]. However, these were not independent analyses of how well criteria improved age estimates of naı¨ve observers but instead either a reassessment of a small number of chicks by a single experienced researcher [29] or differences between predictions from regression equations and known chick ages [30], [31]. Additionally, no previous studies have provided controlled tests that compared the accuracy of age estimates of observers before using a tool with the same observer using the tool, or included any assessment of the influence of prior experience or regional variation in bird morphology. Thus, robust tests are needed, not only to gauge the utility of these species-specific tools, but also to understand the accuracy of these and similar morphometric age estimation procedures routinely used in ecology.
In 2011 and 2012, we developed a tool to estimate ages of Common Tern (Sterna hirundo) chicks in the field following the same basic design as illustrated morphometric aging tools available for other species, e.g. [9], but expanded to a user-friendly, two-page photographic guide that can be printed double-sided for ease of use in the field (Fig. S1). This allowed users to quickly estimate ages of chicks without resorting to biometric measurements and regardless of previous experience. We then tested this tool in 2013 to evaluate its effectiveness at improving age estimates. We quantified its capacity to increase the ability of 100 investigators (of varying prior experience) to estimate chick ages accurately in trials at three field sites in North America, one in Europe, and under laboratory conditions. Specifically, we assessed the following predictions that visual tools based primarily on morphometrics can: (1) lead to improvements in age estimation for both inexperienced and experienced observers, (2) be used successfully at a range of different geographical locations, and (3) facilitate sufficiently high levels of precision in age estimations for these methods to be widely adopted.
Methods and Experimental Design
Ethics Statement
All activities were performed under appropriate permits (Canadian Wildlife Service Scientific Permits CA 0142, 0218, 0267, and 0308; Environment Canada Banding permits 10431V and 10431W; Ontario Parks Letter of Authorization to Conduct Research in a Provincial Park; and relevant permits held by collaborators at US and German sites) and approved by Pennsylvania State University’s Institute on Animal Care and Use Committee (protocols#28103 and#36295). Participants in laboratory tests provided written consent to participate in this study. For the field tests, written consent was provided electron-ically by the field site coordinators prior to tests and the volunteers present at the time of the testing visits provided additional verbal consent prior to actual tests. Pennsylvania State University’s Office of Research Protections determined that this research was of non-human/non-research status and thus further review by the Institutional Review Board or the Office for Research Protections was not required.
Tool Development
Fieldwork was conducted at Gull Island, Presqu’ile Provincial Park, Ontario, Canada (43u59.19N, 77u44.29W) in the summers of 2011 and 2012, although additional data collected at the same site from 2008–2010 was used in biometric summaries in the tool. Each year, nests were marked with numbered stakes as Common Terns initiated clutches and subsequently monitored on a near-daily basis to ensure accurate determination of hatching dates. Individual chicks were banded at hatching. Chicks were hand-caught, photographed, and measured (mass, head-plus-bill length, and wing length) regularly (every 1–7 days) from hatching to fledging. Chicks were selected arbitrarily from those available as these were years of intense nest predation by Black-crowned Night Herons (Nycticorax nycticorax). Therefore, since sample sizes of photographs and head-plus-bill measurements among the very oldest chicks were low, we supplemented these data with corresponding measurements of Common Tern chicks at other North American sites (see Fig. S1 for details). While photograph-ing, chicks were placed on a small white table with a stationary ruler to establish a uniform photograph background and scale. An Olympus SP-590UZ camera (Olympus America Inc., 3500 Corporate Parkway, Center Valley, PA 18034) was mounted so the lens was approximately 35 cm above the platform. Photo-graphs of the whole body of the chick and a detailed photograph of the outstretched wing were taken.
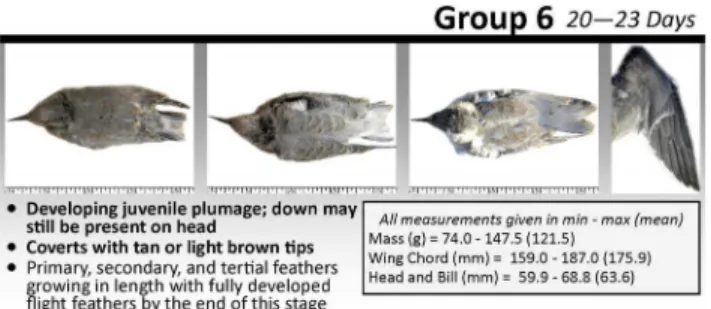
The tool is a double-sided photographic card (Fig. S1) designed for use in the field and was prepared in Microsoft Publisher 2010 (version 14.0; Microsoft, 15010 NE 36th Street, Redmond, WA 98052). Chicks were divided into six distinct age groups (to facilitate ease of use in the field) based primarily on feather development and commonly identified growth phases, e.g. [22], approximately 3–5 days in length (0–3 days, 4–7 days, 8–12 days, 13–15 days, 16–19 days, 20–23 days; Fig. 1). Of the 73 chicks available to be photographed at Presqu’ile, the final photographs used were selected to demonstrate the variation of color and pattern differentiation that can occur within each specific age range. Raw photographs were selected based on clarity and uniformity. Photographs were then scaled identically within the age group in Adobe Photoshop (CS5 and CS6; Adobe Systems Inc., 345 Park Avenue, San Jose, CA 95110) using the rulers in images, and a white background and clear scale were superim-posed. Each chick was pictured only once on the tool with the exception of two individuals pictured in separate age groups due to the limited number of usable photographs available. Biometric summaries (means and ranges) were calculated for measurements of chicks in each age group (sample size range per age group: mass, 270–1581; head-plus-bill length, 7–96; wing length, 13–57). Biometrics were chosen based on those regularly used to describe chick development in this species (Table S1) [21].
Testing Approaches
We used three different testing approaches in 2013. In each, human test subjects (‘‘observers’’, n = 100) estimated ages of Common Tern chicks over a number of trials held on the same day to address our predictions of the effects of the tool on age estimation:
2.Direct testing (Bird Island, MA [41u40.29N, 70u43.09W] and Banter See, Wilhelmshaven, Germany [53u30.79N, 08u06.39E]) was used when learning-phase testing was not possible. We quantified theimmediateeffect of using the tool by having each of the two observers estimate ages of chicks twice: first without the tool and then with the tool.
3.Laboratory testing (at Pennsylvania State University, Berks Campus, Reading, PA), using whole-body photographs of chicks, was performed to facilitate a large sample size (87 observers) that included a range of less-experienced observers. This approach only differed from direct testing in that the image of the chick appeared on an overhead projector. An outstretch wing and ruler (for scale) were visible in all images.
All observers estimated ages of all chicks in each trial (these were known-age [banded within 48 hours of hatching in most cases] but ages were never disclosed to observers until after all trials). Chicks that were not banded on their hatch date were aged using egg signs from previous visits (e.g. ‘‘pipped’’ or ‘‘starred’’ eggs), information on siblings, and whether or not their plumage was still damp from hatching. In all field tests, Common Tern chicks were held in a variety of temporary collection boxes (e.g. car dboard boxes, plastic crates) with an assistant removing chicks individually from the box in an arbitrary sequence and recording bands to identify the chicks. Each observer then recorded their estimates of chick ages either with or without access to the tool (according to the trial).
All observers were instructed to use visual cues as primary diagnostics rather than take time to procure detailed measure-ments because age estimates were strictly limited to 30s per chick (as necessary for time-constraints of most field situations). After each trial, laboratory observers recorded the main features they used in their determination of chick ages. In all trials, except those at Little Island, the same chicks (or images) were used in each subsequent trial, just presented in different orders.
Analysis
We analyzed results from the three testing procedures separately, as a result of important differences in methodologies. Before analyzing learning-phase data using an information-theoretic approach [32], we tested the key assumption that learning did not take place for observers during repeated trials when not using the tool. We used a Wilcoxon Signed Rank test to compare the percent of chicks correctly aged for each of eight observers between trial 1 and trial 3 (i.e. first time estimating age
and third time estimating age in repeated trials without the tool). Three observers were omitted from this prior analysis because several chicks had to be excluded as a result of inconsistencies in their recorded hatch date which resulted in reduced sample sizes for these individuals in the first trial only.
Chick-aging accuracy of observers (correct or incorrect estimate of the age of each chick) was analyzed in generalized linear mixed models (GLMMs) with binomial errors and logit links, for both learning-phase data and laboratory data separately. This approach has been used previously for analyzing repeated measures treatments in presence of covariates [33]. Use of tool or not (‘‘Tool’’), number of previous trials of the same type (either with or without the tool, [‘‘Learning’’], for learning-phase testing only), field experience ($1 yr field experience with Common Tern-s = ‘‘Experienced’’ [n = 6] in field teTern-stTern-s; any previouTern-s experience with birds = ‘‘Experienced’’ [n = 28] in laboratory testing, [‘‘Exp’’]), chick age group (2–6 for field data as there were no Group 1 chicks in tests at Gull Island; 1–6 for laboratory data, [‘‘Group’’]), colony site location ([‘‘Colony’’], for learning-phase testing only), and date ([‘‘Date’’], for laboratory testing only) were entered as fixed factors. Observer and chick identities were included as random factors. For each dataset, the maximal model was constructed (including all covariates and all two-way and three-way interactions that were biologically-meaningful). Model reduction using AICcmodel selection [32] was used to identify the most parsimonious model using the R package MuMIn [34]. Evidence ratios [35] were used to compare the best model with the highest-ranking competing model that did not include tool use as a predictor. Where top models (DAICc,2) differed in their inclusion of tool use as a predictor, we used model averaging across all models [36] to determine the relative importance of tool use compared to other predictor variables. Statistical comparison of direct testing sites was not possible due to limited numbers of observers.
We summarized the key identification features used by observers in each trial. Means are presented with 6 SE and medians with [lower quartile, upper quartile] unless otherwise stated.
Results
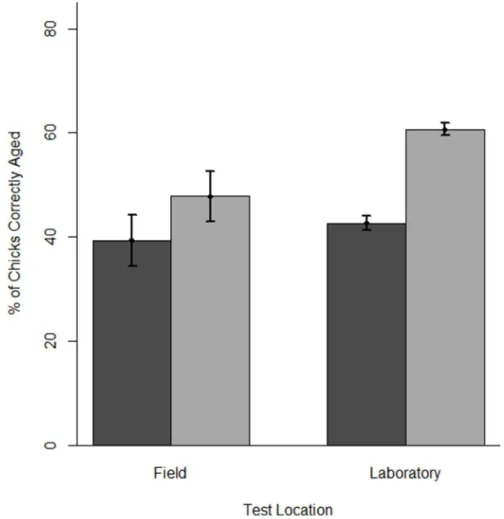
Overall, the tool improved chick-aging accuracy by 16.8% (61.5), with 86% of observers showing improvement (on average: 20.161.4%) and only 14 not improving (range: 210%–0%). Observers in laboratory tests showed a greater improvement in chick-aging accuracy than observers in field tests (18.061.6% vs. 8.462.6% respectively, Fig. 2). When using the tool, the best five observers from laboratory tests and field tests (those achieving the greatest chick-aging accuracy) correctly estimated 84.0% (62.9) of chick ages and 62.9% (62.8) of chick ages, respectively. In the field, the tool improved chick-aging accuracy at all sites (Bird Island: 15.9%, Banter See: 6.7%, Gull Island: 9.266.3%, Little Island 6.762.9%).
Eighty-four percent of laboratory observers mostly used characteristics of feather development to estimating chick ages without the tool and this increased to 95% when using the tool (Table 1). Observers in field and laboratory tests had the most difficulty in estimating ages of chicks in later age groups (Groups 4–6; 13–23 days of age) both with and without the tool (Table S2) but underestimated age for Groups 5 and 6 (16–23 days of age) more when using the tool. Additionally, observers late in the season at Gull Island and Little Island frequently underestimated ages of chicks in Group 2 (4–7 days of age) when using the tool.
Figure 1. Example of age group from the tool. Age group 6 (chicks 20–23 days old) is shown (full tool is provided as Fig. S1). Within the age group, pictured chicks increase in age from left to right; an image of the outstretched wing of the oldest chick is provided. Morphometric data summaries and key diagnostic characteristics are also shown.
Field Tests
When not using the tool, there was no evidence for learning (any improvement in observer ability to age Common Tern chicks during learning-phase trials) during consecutive trials (Wilcoxon Signed Rank W8= 17.5, p = 0.612). Even though our sample of observers in this test was small (only eight were available across all five trials), performance decreased slightly which is the opposite of what would be expected if observers were learning (1stvs. 3rdtrial without tool: 50.0 [38.8, 60.9] vs. 45.0 [38.8, 50.0]). Additionally, changes in aging accuracy between consecutive trials (either both
with the card or both without the card) were not retained in the best GLMM model for learning-phase testing (Table 2). For both direct testing and learning-phase field tests, observers did show marked improvement in chick-aging accuracy when using the tool (Fig. 2, Table 2). This improvement was retained in the best GLMM model for learning-phase over the second-best competing model (without tool use; Evidence Ratio = 1.24, Table 2). Model averaging of coefficients across all GLMMs indicated that the age of chicks was the most important determinant of observer aging performance (Relative Importance = 0.98), followed by prior
Figure 2. Mean chick-aging accuracy without and with the tool for observers in field and laboratory tests.Chick-aging accuracy is the percentage of chicks aged correctly by observers when not using (dark gray) and when using (light gray) and the aging tool. Error bars are61 SE. doi:10.1371/journal.pone.0111987.g002
Table 1.Morphometric features most often used for aging estimates prior to and when using the tool.
Before Tool
Feathers on Wing Feathers on Body Sizing Ruler on Pictures Egg Tooth Presence
44.8% 39.1% 16.1% 0.0%
After tool
Feathers on Wing Feathers on Body Descriptions of Feathers Sizing Ruler on Pictures Egg Tooth Presence
57.5% 23.0% 14.9% 2.3% 2.3%
experience (0.67), colony location (0.64) and tool use (0.62, Table S3).
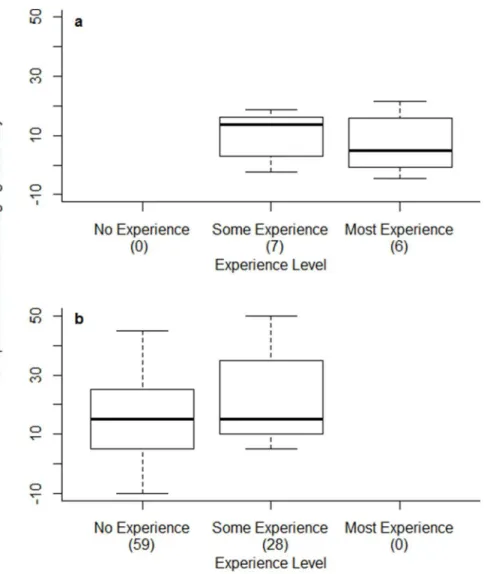
Most field observers improved (by 1.4%–21.7%); only four did not (24.5%–20.8%). Observers with some experience (those with ,1 year of experience working with Common Terns) showed a greater level of improvement than more experienced personnel (Table 2, Fig. 3).
Laboratory Trials
Eighty-eight percent of observers in laboratory tests showed improvement (by 5%–54.58%) when using the tool over when not doing so; only ten (11.5%) did not improve (210%–0%). Use of the tool was retained in the most parsimonious GLMM (Table 3) and was strongly supported in comparison to the highest-ranking competing model without tool use as a predictor (model rank 17, Table 3; Evidence Ratio = 4.461026), however, there was no
evidence for any effect of prior experience on ability to age chicks in the laboratory (experience was not retained in the best model (Table 3, Fig. 3).
Discussion
We developed a photographic field tool designed to improve estimates of age of Common Tern chicks for users of varying levels of experience (Fig. 1, Fig. S1). More importantly, we provided an extensive, independent validation of the tool, showing that it improved the accuracy of age estimations for 86% percent of our 100 observers, by 20% on average. This level of improvement is similar to the difference in intrinsic ability (without the tool) between a naı¨ve observer and our best field observer, who had over a decade of experience working with Common Terns. The tool was universally effective, improving estimates for both experienced and inexperienced observers across sites in North America and Europe. Unsurprisingly, observers with a little (,1 year) or no experience showed the greatest increases in chick-aging accuracy (Fig. 3), presumably because more experienced observers had already established a method for aging chicks prior to using the tool. This also explains why observers in laboratory tests (with little prior experience) showed more marked improvement with the tool than the more experienced field observers (18% vs. 8% improvement on average, Fig. 3).
Despite the obvious improvements when using the tool, even the best five field observers (those achieving the greatest chick-aging accuracy) only correctly estimated the chick age groups 63% of the time, suggesting that developmental variation between individual chicks appear to hinder completely reliable age estimates. Gender, parental quality, and hatching date and order are known factors that influence growth and survival of tern chicks [20–22] and any of these may have been responsible for the observed developmen-tal variation. Chicks between 13–19 days of age (Groups 4 and 5) were the most challenging for age estimation both with and without the tool (Table S2). This may be because they lacked the clear signs of the oldest age group (fledging-age chicks that lacked down on their heads and wings and had well-developed primaries and head caps, Fig. 1) but had had many days since hatching to diverge in their individual rates of development. Additionally, when using the tool, observers tended to underestimate the age of the oldest chicks (Groups 5 and 6; 16–23 days) more frequently than without it (Table S2). In a study using molt patterns, Parr [19] noted that when using his aging criteria (molt and development of primary feathers) he consistently underestimated ages of older Red Grouse (Lagopus lagopus) chicks that exhibited slow development (‘runts’). Presumably, by providing a consistent frame of reference, both our tool and that of Parr [19] increase the possibility of underestimating age for any older chicks that have less well-developed plumages.
Our tool has a wide range of features that can be used to estimate age but most observers cited feather development as the main feature they used for age estimation. We believe this focus on feather development was a main reason our inexperienced observers improved so quickly, as other morphometrics and visual cues are generally more variable, but it may also have led to the consistent trend of underestimating ages for late-hatched chicks. Poor dietary conditions can retard mass growth and primary feather development disproportionately [20], [37], [38] leading to underestimations in age if using only feather development [31]. At Gull Island and Little Island, our observers experienced difficulty estimating ages of young chicks (Group 2; 4–7 days) late in the breeding season. This was probably because late-hatched chicks are generally offspring of young adults or re-nesting birds [37], which commonly exhibit retarded provisioning, growth, and development [22], [39].
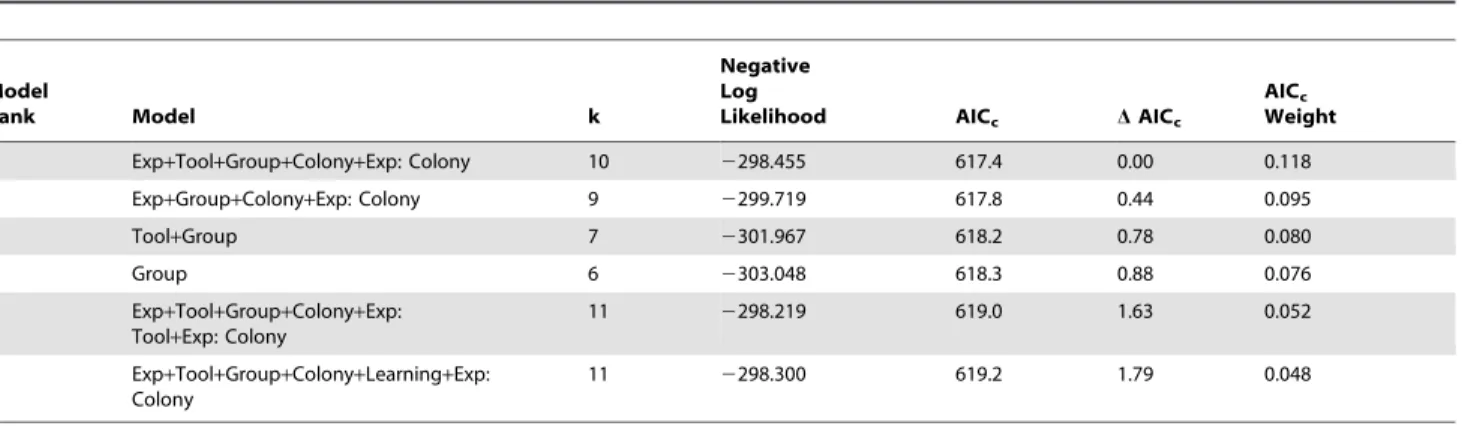
Table 2.Highest-ranked GLMMs (DAICc,2) for observer chick-aging accuracy (correct or incorrect estimation of chick age) in learning-phase trials.
Model
Rank Model k
Negative Log
Likelihood AICc DAICc
AICc Weight
1 Exp+Tool+Group+Colony+Exp: Colony 10 2298.455 617.4 0.00 0.118
2 Exp+Group+Colony+Exp: Colony 9 2299.719 617.8 0.44 0.095
3 Tool+Group 7 2301.967 618.2 0.78 0.080
4 Group 6 2303.048 618.3 0.88 0.076
5 Exp+Tool+Group+Colony+Exp: Tool+Exp: Colony
11 2298.219 619.0 1.63 0.052
6 Exp+Tool+Group+Colony+Learning+Exp:
Colony
11 2298.300 619.2 1.79 0.048
Figure 3. Boxplots of improvement in chick-aging accuracy when using tool for observers of different prior experience in (a) field and (b) laboratory tests.Improvement in chick-aging accuracy is the difference in the percentage of chicks aged correctly when using the tool versus without the tool. Sample sizes of observers are given in parentheses next to axis labels. ‘‘No Experience’’ = no prior experience working with any birds, ‘‘Some Experience’’ =,1 year working with birds (including Common Terns) [for laboratory trials this was any previous experience with birds], and ‘‘Most Experience’’ = 1+years working with Common Terns.
doi:10.1371/journal.pone.0111987.g003
Table 3.Highest-ranked (DAICc,2) and other GLMMs for observer chick-aging accuracy accuracy (correct or incorrect estimation of chick age) in laboratory trials.
Model
Rank Model k
Negative Log
Likelihood AICc DAICc
AICc Weight
1 Group+Tool 9 2147.0 4312.0 0.00 0.293
2 Exp+Group+
Tool+Exp: Tool
11 2145.5 4313.0 1.06 0.173
3 Date+Group+Tool 15 2141.6 4313.3 1.28 0.155
4 Exp+Group+Tool 10 2146.6 4313.3 1.28 0.154
17 Group 8 2209.3 4434.7 122.67 6.75610228
18 Date+Group 14 2203.9 4435.9 123.92 3.61610228
Fixed factors included tool use (‘‘Tool’’), experience (any previous experience with birds = experienced, [‘‘Exp’’]), chick age group (‘‘Group’’), and test date (‘‘Date’’). Tool use was retained in 89% of the top 18 ranked models: models ranked 17 and 18 were the only ones not to retain tool use as a factor. Model selection (reduction) began from the maximal model (not shown) that included all two-way and three-way interactions. Two models which did not include tool use as a predictor are shown for comparison. Number of parameters (k), and AICcweights are given.
Previous studies have suggested, but not shown, that using a combination of morphometric measurements is a practical way for estimating age (see Table S1). However, only three of these studies developed tools based on morphometrics and provided some estimate of their effectiveness, either a single observer estimating ages for very few chicks [29] or statistical estimates of the fit of predictive regression equations [30], [31]. Although we show through an extensive testing protocol that visual aging tools based in morphometrics do improve accuracy, this leads at best to only 63% chick-aging accuracy in the field and 84% chick-aging accuracy in the laboratory (performance of top five observers in both tests). While promoting the use of feather development cues from photographs instead of purely biometric measurements facilitated rapid age estimations in our study, it could be argued that quantitative measurements may provide higher levels of accuracy. However, the ability of our best observers in our study to estimate chick ages correctly 60–80% of the time is consistent with conclusions for other species from less extensive tests of tools based more on quantitative measurements, e.g. [29], [31]. Thus, estimating ages using guides based on morphometric criteria alone may be unreliable and lead to a high level of error in age estimation. Even within the same year and under similar environmental conditions, individual chicks can experience variations in growth and development [21], [40], [41] which can cause bias in aging estimates from standardized morphometric criteria. Therefore, studies that rely on estimating age solely from morphometrics may be subject to inaccuracies that need to be accounted for during experimental design.
For conservation initiatives that require robust estimates of reproductive success and are often based on criteria using chick age, accommodating age-specific chick survival using age estimates from morphometric tools may misrepresent individual chick survival and bias productivity estimates. The development of species-specific tools for estimating age should therefore focus on using innovative approaches rather than relying solely on morphometrics (Table S1). Seasonality, diet, parental quality, and environmental factors all influence growth and development [21], [40], [41] and alternative approaches should seek to unite this information with visible morphometrics.
Despite the possible short-comings we highlight, morphometric tools for estimating age in the field are currently the best solution to increase accuracy of age determination for birds of unknown hatch-date in field studies. Such conditions commonly arise where regular nest visits are impractical, for example for reasons of disturbance [18], extensive study area, e.g. [42] or other logistical limitations [15], [16]. Therefore, we still recommend the widespread use of existing species-specific aging tools following their extensive testing but suggest that new tools should use more
than just morphometric characteristics. One promising approach would be to combine metadata on important variables that affect growth and development (e.g. seasonal timing, dietary status, parental quality) with morphometric characteristics to accommo-date problematic individual variation in growth rate.
Supporting Information
Figure S1 Morphometric tool for estimating ages of Common Tern chicks in the field.
(DOCX)
Table S1 Review of published species-specific aging criteria.
(DOCX)
Table S2 Bias in estimation errors during all tests of the tool.
(DOCX)
Table S3 Model averaging results for learning-phase tests.
(DOCX)
File S1 Biometric measurements used in tool develop-ment.
(XLSX)
File S2 Data from all testing procedures. (XLSX)
Acknowledgments
We thank P. Becker, S. Bouwhuis, E. Craig, L. Harper, C. Mostello, T. Mates, and D. Tyerman for assistance in coordinating field tests. We thank H. Alexander, B. Amos, K. Arndt, J. Bossert, P. Careless, R. Cunningham, T. Kemfort, C. Kilheffer, E. Knoll, P. McFarland, M. McLaughlin, B. Morey, N. Polini, B. Portner, T. Ruland, A. Rutter, S. Smith, R. Tyerman, and all site volunteers for field support, assistance with testing, and data collection. S. Zervanos and two Pennsylvania State University Ecology classes for assisted with laboratory testing. I. Nisbet, P. Becker, F. Cuthbert, D. Weseloh, I. Mazzocchi, D. Moore, and all members of Great Lakes Area Working Group on Colonial Waterbirds and the Upper Great Lakes Waterbird Working Group provided valuable feedback on drafts of our aging tool. We thank an anonymous reviewer for comments that improved this manuscript.
Author Contributions
Conceived and designed the experiments: JMA SAO CNW. Performed the experiments: CNW JMA SAO. Analyzed the data: CNW SAO JMA. Contributed reagents/materials/analysis tools: JMA SAO CNW. Contrib-uted to the writing of the manuscript: CNW SAO JMA.
References
1. Martin K (1995) Patterns and mechanisms for age-dependent reproduction and survival in birds. Am Zool 35: 340–348.
2. Skalski JR, Ryding KE, Millspaugh JJ (2005) Wildlife demography: Analysis of sex, age, and count data. Burlington MA: Elsevier Academic Press. 3. Stearns SC (1977) The evolution of life history traits: A critique of the theory and
a review of the data. Annu Rev Ecol Syst 8: 145–171.
4. Shanawany MM (1984) Inter-relationship between egg weight, parental age and embryonic development. Br Poult Sci 25: 449–455.
5. Monaghan P, Charmantier A, Nussey DH, Ricklefs RE (2008) The evolutionary ecology of senescence. Funct Ecol 22: 371–378.
6. Elias PK, Elias MF (1976) Effects of age on learning ability: Contributions from the animal literature. Exp Aging Res 2: 165–186.
7. Holmes RT, Sherry TW (2001) Thirty-year bird population trends in an unfragmented temperate deciduous forest: Importance of habitat change. Auk 118: 589–609.
8. Erickson WP, Johnson GD, Young DP Jr (2005) A summary and comparison of bird mortality from anthropogenic causes with an emphasis on collisions. USDA Forest Service General Technical Report PSW-GTR 191: 1029–1042.
9. Morales Fernaz J, Schifferli L, Gru¨ebler MU (2012) Ageing nestling Barn Swallows Hirundo rustica: An illustrated guide and cautionary comments. Ringing Migr 72: 65–75.
10. Erwin RM, Custer TW (1982) Estimating reproductive success in colonial waterbirds: An evaluation. Waterbirds 5: 49–56.
11. Nisbet ICT, Burger J, Safina C, Gochfeld M (1990) Estimating fledging success and productivity in Roseate Terns (Sterna dougallii). Waterbirds 13: 85–91. 12. Mayfield HF (1961) Nesting success calculated from exposure. Wilson Bull 73:
225–261.
13. Mayfield HF (1975) Suggestions for calculating nesting success. Wilson Bull 87: 456–466.
14. Steinkamp M, Peterjohn B, Byrd V, Carter H, Lowe R (2003) Breeding season survey techniques for seabirds and colonial waterbirds throughout North America. Waterbird Conservation for the Americas Initiative. Available: www. waterbirdconservation.org/pubs/psgmanual03.pdf.
16. Ricklefs RE, Bloom G (1977) Components of avian breeding productivity. Auk 94: 86–96.
17. Anderson DW, Keith JO (1980) The human influence on seabird nesting success: Conservation implications. Biol Conserv 18: 65–80.
18. Carney KM, Sydeman WJ (1999) A review of human disturbance effects on nesting colonial waterbirds. Waterbirds 22: 68–79.
19. Pratt HM, Winkler DW (1985) Clutch size, timing of laying, and reproductive success in a colony of Great Blue Herons and Great Egrets. Auk 102: 49–63. 20. Arnold JM, Hatch JJ, Nisbet ICT (2004) Seasonal declines in reproductive
success of the Common TernSterna hirundo: Timing or parental quality? J Avian Biol 35: 33–45.
21. Becker PH, Wink M (2003) Influences of sex, sex composition of brood, and hatching order on mass growth in Common TernsSterna hirundo. Behav Ecol Sociobiol 54: 136–146.
22. Arnold JM, Hatch JJ, Nisbet ICT (2006) Effects of egg size, parental quality, and hatch-date on growth and survival of Common TernSterna hirundochicks. Ibis 148: 98–105.
23. Reed LM, Caccamise DE, Orrell EP (1998) Aging Laughing Gull nestlings using head-bill length. Waterbirds 21: 414–417.
24. Elowe KD, Payne S (1979) Aging young Herring Gulls from measurements of body parts. Bird Banding 50: 49–55.
25. Petersen LR, Thompson DR (1977) Aging nestling raptors by 4th-primary measurements. J Wildl Manage 41: 587–590.
26. Carlsson BG, Ho¨rnfeldt B (1994) Determination of nestling age and laying date in Tengmalm’s Owl: Use of wing length and body mass. Condor 96: 555–559. 27. Horwich RH (1966) Feather development as a means of aging young
Mockingbirds (Mimus polyglottos). Bird Banding 37: 257–267.
28. Hunter JM (1995) A key to ageing goslings of the Hawaiian GooseBranta sandvicensis. Wildfowl 46: 55–58.
29. Parr R (1975) Aging Red Grouse chicks by primary molt and development. J Wildl Manage 39: 188–190.
30. Bechard MJ, Zoellick BW, Nickerson M (1985) Accuracy in determining the age of nestling Red-tailed Hawks. J Widl Manage 49: 226–228.
31. Rodway MS (1997) Relationship between wing length and body mass in Atlantic Puffin chicks. J Field Ornithol 68: 338–347.
32. Burnham KP, Anderson DR (2002) Model selection and multimodel inference: A practical information theoretic approach. New York, NY: Springer-Verlag. 33. Blas J, Baos R, Bortolotti GR, Marchant TA, Hiraldo F (2006) Age-related
variation in the adrenocortical response to stress in nestling White Storks (Ciconia ciconia) supports developmental hypothesis. Gen Comp Endocrinol 148: 172–180.
34. Barton K (2009) MuMIn: Multi-model inference. Vienna, Austria. Available: http://r-forge.r-project.org/projects/mumin/.
35. Anderson DR (2008) Model based inference in the life sciences: A primer on evidence. New York, NY: Springer-Verlag.
36. Symonds MR, Moussalli A (2011) A brief guide to model selection, multinomial inference and model averaging in behavioural ecology using Akaike’s information criterion. Behav Ecol Sociobiol 65: 13–21.
37. Dahdul WM, Horn HM (2003) Energy allocation and postnatal growth in captive Elegant Tern (Sterna elegans) chicks: Responses to high- versus low-energy diets. Auk 120: 1069–1081.
38. Benowitz-Fredericks ZM, Kitaysky AS, Thompson CW (2006) Growth and allocation in captive Common Murre (Uria aalge) chicks. Auk 123: 722–734. 39. Wendeln H, Becker PH, Gonza´lez-Solı´s J (2002) Parental care of replacement
clutches in Common Terns (Sterna hirundo). Behav Ecol Sociobiol 47: 382–392. 40. Ricklefs RE (1968) Patterns of growth in birds. Ibis 110: 419–451.
41. Ricklefs RE (1973) Patterns of growth in birds. II. Growth rate and mode of development. Ibis 115: 177–201.