CPD
10, 291–340, 2014Southern high-latitude terrestrial climate
change
L. Contreras et al.
Title Page
Abstract Introduction
Conclusions References
Tables Figures
◭ ◮
◭ ◮
Back Close
Full Screen / Esc
Printer-friendly Version Interactive Discussion
Discussion
P
a
per
|
D
iscussion
P
a
per
|
Discussion
P
a
per
|
Discuss
ion
P
a
per
|
Clim. Past Discuss., 10, 291–340, 2014 www.clim-past-discuss.net/10/291/2014/ doi:10.5194/cpd-10-291-2014
© Author(s) 2014. CC Attribution 3.0 License.
Open Access
Climate of the Past
Discussions
This discussion paper is/has been under review for the journal Climate of the Past (CP). Please refer to the corresponding final paper in CP if available.
Southern high-latitude terrestrial climate
change during the Paleocene–Eocene
derived from a marine pollen record
(ODP Site 1172, East Tasman Plateau)
L. Contreras1,2, J. Pross2,3, P. K. Bijl4, R. B. O’Hara2, J. I. Raine5, A. Sluijs4, and H. Brinkhuis4,6
1
Paleoenvironmental Dynamics Group, Institute of Geosciences, Goethe University Frankfurt, Altenhöferallee 1, 60438 Frankfurt, Germany
2
Biodiversity and Climate Research Centre, Senckenberganlage 25, 60325 Frankfurt, Germany
3
Paleoenvironmental Dynamics Group, Institute of Geosciences, Heidelberg University, Im Neuenheimer Feld 234, 69120 Heidelberg, Germany
4
Department of Earth Sciences, Faculty of Geosciences, Utrecht University, Laboratory of Palaeobotany and Palynology, Budapestlaan 4, 3584 CD Utrecht, the Netherlands
5
Department of Palaeontology, GNS Science, P.O. Box 30368, Lower Hutt 5040, New Zealand
6
CPD
10, 291–340, 2014Southern high-latitude terrestrial climate
change
L. Contreras et al.
Title Page
Abstract Introduction
Conclusions References
Tables Figures
◭ ◮
◭ ◮
Back Close
Full Screen / Esc
Printer-friendly Version Interactive Discussion
Discussion
P
a
per
|
D
iscussion
P
a
per
|
Discussion
P
a
per
|
Discuss
ion
P
a
per
|
Received: 24 November 2013 – Accepted: 17 December 2013 – Published: 20 January 2014
Correspondence to: L. Contreras ([email protected])
CPD
10, 291–340, 2014Southern high-latitude terrestrial climate
change
L. Contreras et al.
Title Page
Abstract Introduction
Conclusions References
Tables Figures
◭ ◮
◭ ◮
Back Close
Full Screen / Esc
Printer-friendly Version Interactive Discussion
Discussion
P
a
per
|
D
iscussion
P
a
per
|
Discussion
P
a
per
|
Discuss
ion
P
a
per
|
Abstract
Reconstructing the early Paleogene climate dynamics of terrestrial settings in the high southern latitudes is important to assess the role of high-latitude physical and bio-geochemical processes in the global climate system. However, whereas a number of high-quality Paleogene climate records has become available for the marine realm of
5
the high southern latitudes over the recent past, the long-term evolution of coeval ter-restrial climates and ecosystems is yet poorly known. We here explore the climate and vegetation dynamics on Tasmania from the middle Paleocene to the early Eocene (60.7–54.2 Ma) based on a sporomorph record from Ocean Drilling Program (ODP)
Site 1172 on the East Tasman Plateau. Our results show that three distinctly diff
er-10
ent vegetation types thrived on Tasmania under a high-precipitation regime during the
middle Paleocene to early Eocene, with each type representing different temperature
conditions: (i) warm-temperate forests dominated by gymnosperms that were dominant during the middle and late Paleocene; (ii) cool-temperate forests dominated by
south-ern beech (Nothofagus) and araucarians across the middle/late Paleocene transition
15
interval (∼59.5 to∼59.0 Ma); and (iii) paratropical forests rich in ferns that were
estab-lished during and in the wake of the Paleocene–Eocene Thermal Maximum (PETM). The transient establishment of cool-temperate forests lacking any frost-sensitive el-ements (i.e., palms and cycads) across the middle/late Paleocene transition interval indicates markedly cooler conditions, with the occurrence of frosts in winter, on
Tasma-20
nia during that time. The integration of our sporomorph data with previously published
TEX86-based sea-surface temperatures from ODP Site 1172 documents that the
veg-etation dynamics on Tasmania were closely linked with the temperature evolution in the Tasman sector of the Southwest Pacific region. Moreover, the comparison of our season-specific climate estimates for the sporomorph assemblages from ODP Site
25
1172 with the TEXL86- and TEXH86-based temperature data suggests a warm-season
CPD
10, 291–340, 2014Southern high-latitude terrestrial climate
change
L. Contreras et al.
Title Page
Abstract Introduction
Conclusions References
Tables Figures
◭ ◮
◭ ◮
Back Close
Full Screen / Esc
Printer-friendly Version Interactive Discussion
Discussion
P
a
per
|
D
iscussion
P
a
per
|
Discussion
P
a
per
|
Discuss
ion
P
a
per
|
1 Introduction
The Southern Ocean is an important region for early Cenozoic (65–34 Ma) climates, being the dominant region for deep-water formation during that time (Thomas et al., 2003; Bijl et al., 2009; Sijp et al., 2011; Hollis et al., 2012). South Pacific sea-surface and global intermediate water temperatures increased from the late Paleocene to
5
the early Eocene, with maximum warmth during the Early Eocene Climatic Optimum (EECO; 53–51 Ma), followed by a cooling trend during the middle and late Eocene (Za-chos et al., 2001, 2008; Bijl et al., 2009; Hollis et al., 2012). This cooling trend ultimately culminated in the establishment of a continental-scale ice shield on Antarctica during the earliest Oligocene (e.g., Zachos et al., 1994, 2008; Barrett, 1996), which
repre-10
sented a decisive step in the Earth’s transition from a “greenhouse” into an “icehouse” world.
Organic geochemical surface-water temperature proxy records from the high-latitude
Southwest Pacific Ocean (notably TEX86; Bijl et al., 2009) closely mirror trends in
the benthic foraminiferal oxygen isotope data from the late Paleocene to the early
15
Oligocene (Zachos et al., 2001, 2008) which lends further support to the suggestions that the southern ocean was the main region for deep-water formation during that time.
Irrespective of the calibration used, Southwest Pacific TEX86-derived sea-surface
tem-peratures (SSTs) were relatively cool during the early and middle Paleocene. During
the late Paleocene and early Eocene, SSTs gradually rose to tropical values (>26◦C),
20
with maxima being reached during the Paleocene-Eocene Thermal Maximum (PETM; Sluijs et al., 2011) and the EECO (Bijl et al., 2009; Hollis et al., 2009, 2012). Towards
the end of the early Eocene (49–50 Ma), a pronounced SST cooling of∼4◦C occurred
on the Australo-Antarctic margin; this cooling has been attributed to the onset of west-bound surface-water throughflow across the Tasmanian Gateway (Bijl et al., 2013a).
25
A similar cooling trend is registered for surface waters offNew Zealand (Hollis et al.,
CPD
10, 291–340, 2014Southern high-latitude terrestrial climate
change
L. Contreras et al.
Title Page
Abstract Introduction
Conclusions References
Tables Figures
◭ ◮
◭ ◮
Back Close
Full Screen / Esc
Printer-friendly Version Interactive Discussion
Discussion
P
a
per
|
D
iscussion
P
a
per
|
Discussion
P
a
per
|
Discuss
ion
P
a
per
|
Pacific Ocean during the interval spanning the middle/late Paleocene transition (59.5–
59.0 Ma); TEX86-derived SST decreased by ∼3
◦
C during that time (Bijl et al., 2009; Hollis et al., 2012; 2014). Along with this SST drop, lowered sea level and marked bathyal erosion suggest that a transient growth of an Antarctic ice sheet may have occurred (Hollis et al., 2014).
5
While an increasing amount of data has become available on the marine climate evolution in the southern high latitudes during the early Paleogene, the coeval ter-restrial climate dynamics of that region are yet poorly documented (e.g., Passchier et al., 2013). For the Paleocene, paleobotanical records reflect the thriving of temper-ate, gymnosperm-rich forests dominated by podocarps in Southeast Australia (e.g.,
10
Macphail et al., 1994; Greenwood et al., 2003; Greenwood and Christophel, 2005), on Seymour Island (Antarctica; Askin, 1990), and in New Zealand (Mildenhall, 1980; Raine et al., 2009).
In contrast, highly diverse angiosperm forests containing taxa that today are re-stricted to tropical environments characterize the early Eocene vegetation in the
higher-15
latitude Southwest Pacific region. This vegetation is widely known from Southeast Aus-tralia (Macphail et al., 1994; Greenwood et al., 2003; Greenwood and Christophel, 2005), Tasmania (Truswell, 1997; Carpenter et al., 2012) and New Zealand (Raine et al., 2009; Handley et al., 2011); notably, it also thrived on the Wilkes Land margin of
the Antarctic continent, i.e., at paleo-latitudes of∼70◦S (Pross et al., 2012; Contreras
20
et al., 2013).
The pronounced vegetation turnover from temperate forests during the Paleocene to near-tropical forests during the early Eocene suggests a marked, climatically driven change in terrestrial environments in the high southern latitudes. However, the tran-sitional process between these two vegetation types and the underlying change in
25
CPD
10, 291–340, 2014Southern high-latitude terrestrial climate
change
L. Contreras et al.
Title Page
Abstract Introduction
Conclusions References
Tables Figures
◭ ◮
◭ ◮
Back Close
Full Screen / Esc
Printer-friendly Version Interactive Discussion
Discussion
P
a
per
|
D
iscussion
P
a
per
|
Discussion
P
a
per
|
Discuss
ion
P
a
per
|
2012, 2014). This is due to the fact that prior paleobotanical studies are mainly based on stratigraphically discontinuous outcrops that provided only limited insights into the Paleocene and early Eocene vegetation of the region (Greenwood et al., 2003). In ad-dition, available studies on sporomorphs from the early Paleogene of the Southwest Pacific region have predominantly focussed on the taxonomical characterization of the
5
assemblages and the generation of biostratigraphic schemes (e.g., Stover and Evans, 1973; Stover and Partridge, 1973; Truswell, 1997; Macphail, 1999). In any case, esti-mates of terrestrial temperatures in the high southern latitudes and a comparison with the currently available SST estimates from the marine realm can strongly enhance the understanding of the climate evolution in the high southern latitudes during the early
10
Paleogene.
In light of the above, we here explore the vegetation response to high-southern-latitude climate forcing from the Paleocene to the “hothouse” conditions of the early Eocene based on a new, chronostratigraphically well-calibrated (Bijl et al., 2013b)
sporomorph record from Ocean Drilling Program (ODP) Site 1172 offeastern
Tasma-15
nia. We quantitatively evaluate the compositional variations of the sporomorph assem-blages and carry out quantitative sporomorph-based paleoclimatic reconstructions. For a further assessment of the terrestrial climatic conditions in the Southwest Pacific re-gion, we apply the same paleoclimate reconstruction approach to previously published sporomorph records from Southeast Australia (Bass Basin, Gippsland Basin,
South-20
east Highlands) and New Zealand. Finally, we compare our terrestrial paleoclimate
es-timates with previously published TEXL86- and TEXH86-based SST reconstructions from
the same site (Bijl et al., 2009, 2013b; Hollis et al., 2014) in order to contribute to a better understanding of the early Paleogene climate dynamics in the high southern latitudes.
CPD
10, 291–340, 2014Southern high-latitude terrestrial climate
change
L. Contreras et al.
Title Page
Abstract Introduction
Conclusions References
Tables Figures
◭ ◮
◭ ◮
Back Close
Full Screen / Esc
Printer-friendly Version Interactive Discussion
Discussion
P
a
per
|
D
iscussion
P
a
per
|
Discussion
P
a
per
|
Discuss
ion
P
a
per
|
2 Material and methods
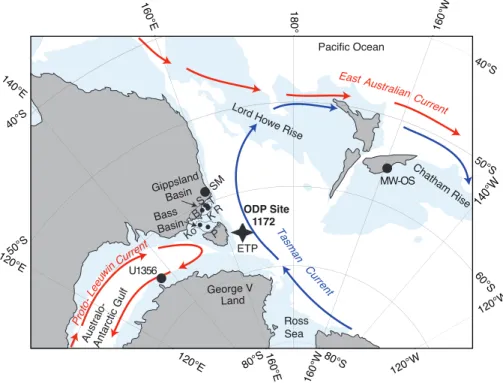
The middle Paleocene to early Eocene strata studied here were recovered at ODP
Site 1172, which is located ∼100 km east of Tasmania on the western side of the
East Tasman Plateau (ETP; 43◦57.6′S, 149◦55.7′E; Fig. 1) (Shipboard Scientific Party,
2001a).
5
2.1 Regional setting and paleoceanography
During the early Paleogene, Tasmania and the ETP were located at ∼65◦S, much
closer to Antarctica than today (Exon et al., 2004b). Paleoceanographic patterns as determined by winds and gateway configuration were likely vital for regional climates on land (Sijp et al., 2011). The study site was located close to the Tasmanian
promon-10
tory, which hampered deep ocean exchange between the Southwest Pacific and the Australo-Antarctic Gulf for most of the early Paleogene (Exon et al., 2001; Stickley et al., 2004; Fig. 1). During the Paleocene and early Eocene, the Tasman region was under the persistent influence of the Antarctic-derived Tasman Current; in contrast, the Australo-Antarctic Gulf (west of Tasmania) was bathed by the low-latitude-derived
15
Proto-Leeuwin Current (Huber et al., 2004; Sijp et al., 2011; see Fig. 1). This paleo-ceanographic configuration determined marine biogeographical patterns in the region (Huber et al., 2004; Bijl et al., 2011, 2013a). The onset of the deepening of the
Tasma-nian Gateway at∼49–50 Ma initiated a westbound Antarctic Counter Current flowing
along the Antarctic margin from the Pacific into the Australo-Antarctic Gulf (Bijl et al.,
20
2013a). Continued rifting through the Eocene and accelerated deepening of the
Tas-manian Gateway (∼35.5 Ma) led to the inflow of Australo-Antarctic Gulf waters through
the Tasmanian Gateway into the southern Pacific during the early Oligocene (Stick-ley et al., 2004; Sijp et al., 2011). It could be expected that these paleoceanographic
reorganizations affected regional climates throughout the early Paleogene.
CPD
10, 291–340, 2014Southern high-latitude terrestrial climate
change
L. Contreras et al.
Title Page
Abstract Introduction
Conclusions References
Tables Figures
◭ ◮
◭ ◮
Back Close
Full Screen / Esc
Printer-friendly Version Interactive Discussion
Discussion
P
a
per
|
D
iscussion
P
a
per
|
Discussion
P
a
per
|
Discuss
ion
P
a
per
|
2.2 Age model, lithology and depositional environment
We here follow the corrected sample depths of 1172D published in Sluijs et al. (2011)
through detailed correlation of the X-ray fractionation core scanning to theγ-ray
down-hole log. The age model of the studied sequence is based on the magnetostratigraphy, chemostratigraphy and dinoflagellate cyst (dinocyst) biostratigraphy as presented in
5
Bijl et al. (2013b). For the interval studied (60.7–54.2 Ma), the age model is based on 3 magnetic reversals, confidently correlated to the Geomagnetic Polarity Time Scale
(GPTS) of Vandenberghe et al. (2012), the PETM (∼56 Ma), which exhibits a negative
carbon isotope excursion of∼3 ‰ between 611.89 and 611.86 rmbsf (revised meters
below sea floor) (Sluijs et al., 2011), and several dinocyst first and last occurrence
10
data that have been calibrated regionally following Crouch et al. (2014). The magne-tostratigraphic age model for the Paleocene section (Röhl et al., 2004) was adjusted by Bijl et al. (2010) on the basis of the recognition of the PETM in Core 1172D-15R (611.8 rmbsf; Sluijs et al., 2011). The missing interval between Cores 16R and 17R
(∼620 rmbsf) represents a∼1.3 Ma-long hiatus that spans the time interval correlative
15
to between infra-Subchrons C26n and C25n (57.7 to 59 Ma; Bijl et al., 2010, 2013b). The upper 60 cm of section in Core 17R (i.e, below the hiatus) are heavily disturbed and have many sediment characteristics more consistent with Core 16R than with the underlying sediment (Röhl et al., 2004). We therefore follow Röhl et al. (2004) in their suggestion that this interval represents caved material of late Paleocene age.
20
The Middle Paleocene to Lower Eocene succession of ODP Site 1172 consists mainly of gray to grayish brown clay- and siltstones with low abundances of calcareous and siliceous microfossils (Shipboard Scientific Party, 2001b; Röhl et al., 2004). Envi-ronmentally, the succession is interpreted to reflect very shallow to restricted marine
conditions, with marked runofffrom the nearby shores (Röhl et al., 2004).
25
CPD
10, 291–340, 2014Southern high-latitude terrestrial climate
change
L. Contreras et al.
Title Page
Abstract Introduction
Conclusions References
Tables Figures
◭ ◮
◭ ◮
Back Close
Full Screen / Esc
Printer-friendly Version Interactive Discussion
Discussion
P
a
per
|
D
iscussion
P
a
per
|
Discussion
P
a
per
|
Discuss
ion
P
a
per
|
in-depth discussion of this issue is provided in Sect. 3.2 (“Constraints on sporomorph source region”).
2.3 Sample processing and data analysis
Eighty-nine samples from the Paleocene and Eocene of ODP Site 1172 were pro-cessed at the Laboratory of Palaeobotany and Palynology (Bijl et al., 2011) and were
5
reanalysed for terrestrial palynomorphs. Sample processing followed standard paly-nological techniques, including treatment with HCl (10 %) and HF (38 %) and sieving through a 15 µm nylon mesh (e.g., Pross, 2001). The microscope slides are stored in the collection of the Laboratory of Palaeobotany and Palynology at Utrecht Uni-versity. Whenever possible, 300 sporomorphs (excluding reworked specimens) were
10
analysed per sample and determined to the species level; this required the analysis of up to six slides per sample. The analyses were performed using a light microscope at
200×magnification; morphological details were studied with a magnification of 1000×.
Sporomorph identifications are mainly based on Couper (1960), Harris (1965), Stover and Partridge (1973), Truswell (1983), Raine et al. (2008), and Truswell and Macphail
15
(2009). The botanical affinities are given following Macphail et al. (1994), Raine (1998),
and Truswell and Macphail (2009). All sporomorph data (including photomicrographs of key taxa) are provided in the Supplement.
Rarefaction was applied to evaluate sporomorph diversity; this allows to estimate the number of sporomorph species at a constant sample size (Raup, 1975). Detrended
20
Correspondence Analysis (DCA) is an ordination technique that was used to assess the overall variation in floral composition through time.
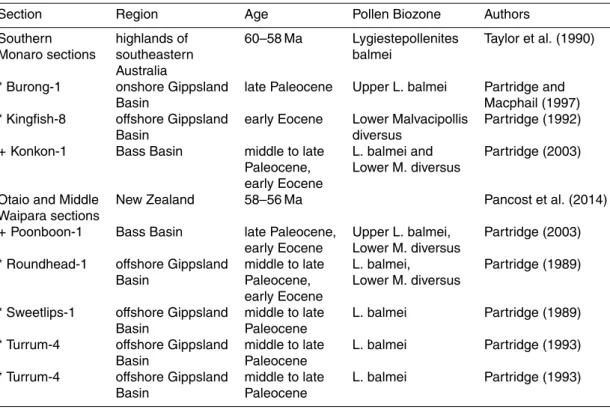
To constrain the source region of the sporomorphs from ODP Site 1172, we com-pared the floristic composition of our record with coeval sporomorph records from Southeast Australia (Bass Basin – data from Blevin, 2003; Gippsland Basin –
Depart-25
CPD
10, 291–340, 2014Southern high-latitude terrestrial climate
change
L. Contreras et al.
Title Page
Abstract Introduction
Conclusions References
Tables Figures
◭ ◮
◭ ◮
Back Close
Full Screen / Esc
Printer-friendly Version Interactive Discussion
Discussion
P
a
per
|
D
iscussion
P
a
per
|
Discussion
P
a
per
|
Discuss
ion
P
a
per
|
From all records derived from drillings, only data from core or sidewall core samples were evaluated to avoid potential contamination by caving. To exclude a bias as it
could have been introduced into our comparison through different taxonomic criteria,
we have standardized all datasets using broader groups of taxa (e.g.,Gleicheniidites
spp./Claviferaspp.,Phyllocladiditesspp.,Nothofagiditesspp. (fuscagroup)) when
nec-5
essary. Due to the differences in sample sizes, sporomorph percentages were used as
input for the DCA, and only samples with counts≥100 individuals were evaluated.
2.4 Sporomorph-based climate reconstructions
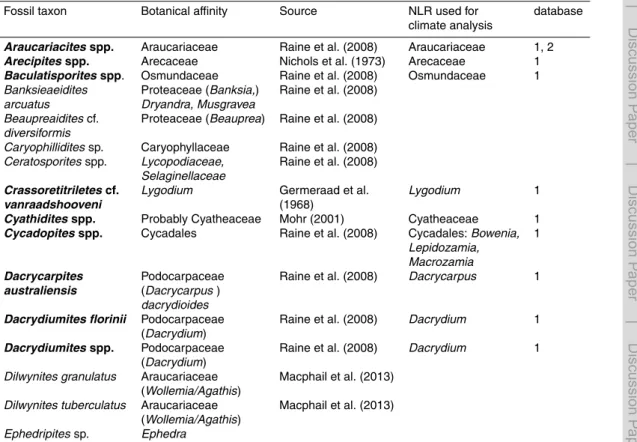
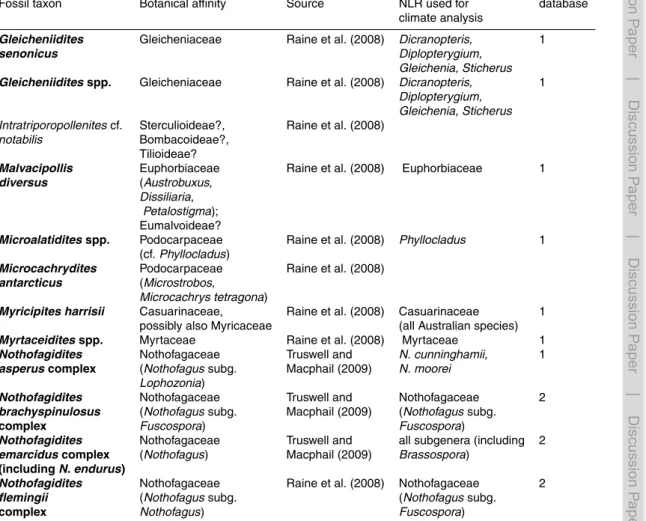
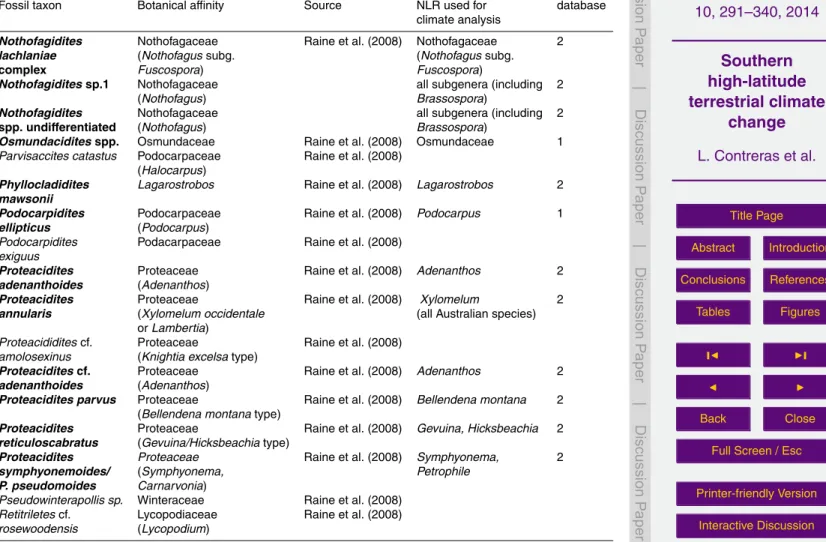
Quantitative sporomorph-based climate estimates were carried out following the bio-climatic analysis approach of Greenwood et al. (2005). For each taxon with a known
10
nearest living relative (NRL; Table 2), climatic profiles were generated with regard to mean annual temperature (MAT), coldest month mean temperature (CMMT), warmest month mean temperature (WMMT), and mean annual precipitation (MAP). The climate profiles are derived from (i) the dataset of Pross et al. (2012), which is mainly based on distribution data from the Australian National Herbarium online database (Australian
15
National Herbarium, 2011) and the mathematical climate surface software ANUCLIM 5.156 (Houlder et al., 1999), and (ii) the PALAEOFLORA database, which contains climatic information for a plant taxon based on its global distribution (Utescher and Mosbrugger, 2013). Following Greenwood et al. (2005), the climatic values for each assemblage were calculated based on the zone of overlap of the majority of taxa from
20
that assemblage with respect to a given climate parameter. This overlap interval was calculated using the 10th percentile (as lower limit) and 90th percentile (as upper limit) of the total range of the NLRs recorded in that assemblage. The climate estimate is given as the midpoint between the lower and upper limits, with the error spanning from
the lower to the upper limit. Only samples with counts≥100 individuals were used in
25
CPD
10, 291–340, 2014Southern high-latitude terrestrial climate
change
L. Contreras et al.
Title Page
Abstract Introduction
Conclusions References
Tables Figures
◭ ◮
◭ ◮
Back Close
Full Screen / Esc
Printer-friendly Version Interactive Discussion
Discussion
P
a
per
|
D
iscussion
P
a
per
|
Discussion
P
a
per
|
Discuss
ion
P
a
per
|
2.5 Statistical examination of the connection between floristic composition and
temperature
To examine the correlation between the floristic composition of our sporomorph record from ODP Site 1172 (as represented by DCA Axis 1 sample scores; Figs. 2 and 4)
and TEXL86- and TEXH86-derived SST values from the same site (Bijl et al., 2009, 2013b;
5
Hollis et al., 2014), we applied a state space model. State space models or dynamic linear models allow data distributed along time to be interpreted as the combination of several components, such as trend, seasonal or regressive components (Petris et al., 2009; see West and Harrison, 1997, for further details on the advantages and devel-opment of the method).
10
We compared 60 SST data points with our 40 values of the DCA Axis 1 scores. Because only six of the SST data points and DCA Axis 1 sample scores are from the exact same depths, we multiplied imputed values of DCA Axis 1 sample scores and SST; the imputed values are based on Eqs. (1) and (2) below. The cross-covariance between two points was calculated following Eq. (3) and the final correlation using
15
Eq. (4). WhenXd(i) (1) is the “true” SST andXd(i)(2) is the “true” Axis 1 sample score,
σ is the standard deviation, ρ is the correlation between the two variables and τ is
the Kendall rank correlation coefficient. For Eqs. (1) and (2) we assumed that both
variables are normally distributed (N).
SSTi ∼N
xSST(t(i)),τSST2
(1)
20
DCAi ∼N
xDCA(d(i)),τDCA2
(2)
∆d
σ112 ρσ11σ22
ρσ11σ22
+ σ
2
SST 0
0 σDCA2
!
(3)
corr(SST, DCA)=r ∆tρσDCAσSST
∆d t+τDCA2 ∆tσSST2 +τSST2
CPD
10, 291–340, 2014Southern high-latitude terrestrial climate
change
L. Contreras et al.
Title Page
Abstract Introduction
Conclusions References
Tables Figures
◭ ◮
◭ ◮
Back Close
Full Screen / Esc
Printer-friendly Version Interactive Discussion
Discussion
P
a
per
|
D
iscussion
P
a
per
|
Discussion
P
a
per
|
Discuss
ion
P
a
per
|
The model was fitted using OpenBUGS run through the BRugs package (Thomas et al., 2006) of the R software for statistical computing (R Development Core Team, 2011) fitted in a Bayesian framework using the BRugs package. The R script and further explanation of the analysis is given in the Supplement.
3 Results
5
3.1 Sporomorph results from ODP Site 1172
Of the 89 palynological samples processed from the Middle Paleocene to Lower
Eocene of ODP Site 1172, 40 samples yielded sporomorph counts ≥100
individu-als and were further used in our analyses. The preservation of sporomorphs is gen-erally good. A total of 197 sporomorph types were identified. A range chart with the
10
relative abundances of key taxa is presented in Fig. 2; a full account of the identified taxa and their abundance data along with photomicrographs of key taxa is provided in the Supplement. Based on rarefied values, the entire study interval is characterized
by rich sporomorph assemblages (mean±s.d.=29.2±3.4 taxa/sample at 100
indi-viduals, n=40). Remarkably low sporomorph species numbers are recorded for the
15
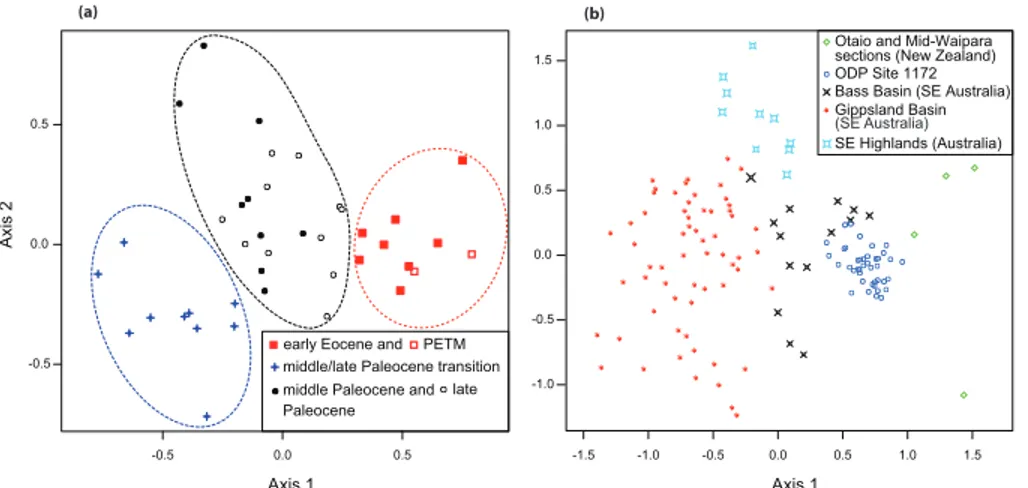
samples corresponding to the PETM (22.8 and 24.5 species/sample at 100
individu-als; Fig. 2). The DCA results of our sporomorph record yield distinctly different values
for the Axis 1 and Axis 2 sample scores (Fig. 3a). They allow to define three sample groups, with each sample group being characteristic for specific time intervals of our record (Fig. 3a). These intervals are: (i) the middle and late Paleocene; (ii) the
mid-20
CPD
10, 291–340, 2014Southern high-latitude terrestrial climate
change
L. Contreras et al.
Title Page
Abstract Introduction
Conclusions References
Tables Figures
◭ ◮
◭ ◮
Back Close
Full Screen / Esc
Printer-friendly Version Interactive Discussion
Discussion
P
a
per
|
D
iscussion
P
a
per
|
Discussion
P
a
per
|
Discuss
ion
P
a
per
|
3.1.1 Middle Paleocene (60.7–59.5 Ma) and late Paleocene (59.0–55.6 Ma)
intervals
The sporomorph assemblages from the middle and late Paleocene intervals (excluding the middle/late Paleocene transition, see below) are represented by 20 samples. They are dominated by gymnosperm pollen, which on average accounts for 45 % of all
sporo-5
morphs. The gymnosperm pollen is represented mainly, in the order of decreasing
abundances, by Podocarpidites spp. (botanical affinity: podocarpaceae; podocarps),
Dilwynites granulatus(Wollemia(Wollemi pine)/Agathis(Kauri); Macphail et al., 2013), Phyllocladidites mawsonii (Lagarostrobos franklinii; Huon pine), and Araucariacites
spp. (Araucariaceae; Agathis (Kauri) andAraucaria) (Fig. 2). Other abundant
sporo-10
morphs are, in the order of decreasing abundances, Cyathidites spp. (probably
Cy-atheaceae), Nothofagidites spp. (Nothofagus; southern beech), Gambierina spp.,
Gleicheniidites spp. (Gleicheniaceae), and Ceratosporites spp. (Lycopodiaceae, Se-laginellaceae).
Although the sporomorph assemblages from the middle to late Paleocene have
15
very similar floristic compositions, differences exist with regard to the percentages of
some taxa (Fig. 2). For instance, the early part of the middle Paleocene exhibits
rela-tively high (∼30 %) percentage of podocarpaceous pollen (mainlyPodocarpiditesspp.
(Podocarpaceae; podocarps) andPhyllocladidites mawsonii (Lagarostrobos franklinii;
Huon pine)). In contrast, the latest Paleocene is characterized by lower abundances
20
of these taxa (∼14 %), but exhibits higher percentages of Cyathidites spp. (∼18 %)
and the constant presence of Myricipites harrisii (probably Casuarinaceae; sheoak).
Remarkably, both the middle and late Paleocene are characterized by the presence of
Arecipitesspp. (Arecaceae; palms) andCycadopitesspp. (Cycadales).
3.1.2 Middle/late Paleocene transition interval (59.5–59.0 Ma)
25
The sporomorph assemblages of the middle/late Paleocene transition interval are
CPD
10, 291–340, 2014Southern high-latitude terrestrial climate
change
L. Contreras et al.
Title Page
Abstract Introduction
Conclusions References
Tables Figures
◭ ◮
◭ ◮
Back Close
Full Screen / Esc
Printer-friendly Version Interactive Discussion
Discussion
P
a
per
|
D
iscussion
P
a
per
|
Discussion
P
a
per
|
Discuss
ion
P
a
per
|
spp. (Araucariaceae; ∼19 %), Nothofagidites spp. (Nothofagus; ∼13 %), and
Cer-atosporitesspp. (Lycopodiaceae, Selaginellaceae;∼6 %) than the assemblages from the under- and overlying strata of middle respectively late Paleocene age (Fig. 2).
Other abundant taxa are, in the order of decreasing abundances, Cyathidites spp.
(Cyatheaceae), Dilwynites granulatus (Wollemia/Agathis) and Gleicheniidites spp.
5
(Gleicheniaceae). The percentages of podocarpaceous types (Podocarpidites spp.
(Podocarpaceae) andPhyllocladidites mawsonii (Lagarostrobos franklinii)) are lower
(∼10 %) than in assemblages from the under- and overlying middle and late
Pale-ocene. Notably, the assemblages from the middle/late Paleocene transition interval are
devoid ofArecipitesspp. (Arecaceae; palms) andCycadopitesspp. (Cycadales) pollen.
10
3.1.3 PETM and early Eocene interval (55.6–54.2 Ma)
Assemblages from the PETM are documented in 2 samples with counts≥100
individ-uals. They are characterized by high percentages (up to 39 %) ofDilwynites granulatus
(Wollemia/Agathis). Other abundant taxa are, in the order of decreasing abundances,
Cyathidites spp. (Cyatheaceae),Araucariacites spp. (Araucariaceae), and
Gleicheni-15
iditesspp. (Gleicheniaceae). The assemblages of the PETM interval are further
charac-terized by the presence ofMalvacipollisspp. (Euphorbiaceae, probably Eumalvoideae)
andMyricipites harrisii(probably Casuarinaceae). Findings ofSpinizonocolpites promi-natus(Nypapalm) are restricted to the PETM and the earliest Eocene (Fig. 2).
Sporomorph assemblages of the early Eocene interval are documented in 8
sam-20
ples. They show in general very high percentages (mean: 20 %) ofCyathidites spp.
(probably Cyatheaceae; Fig. 2). Other abundant taxa are, in the order of
decreas-ing abundances,Dilwynites granulatus (Wollemia/Agathis), Araucariacites spp.
(Arau-cariaceae),Podocarpidites spp. (Podocarpaceae), andPhyllocladidites mawsonii (
La-garostrobos franklinii). The early Eocene interval is also characterized by relatively high
25
percentages ofProteacidites spp. (∼7 %) and the constant presence ofMalvacipollis
spp. (Euphorbiaceae, probably Eumalvoideae),Myricipites harrisii (probably
CPD
10, 291–340, 2014Southern high-latitude terrestrial climate
change
L. Contreras et al.
Title Page
Abstract Introduction
Conclusions References
Tables Figures
◭ ◮
◭ ◮
Back Close
Full Screen / Esc
Printer-friendly Version Interactive Discussion
Discussion
P
a
per
|
D
iscussion
P
a
per
|
Discussion
P
a
per
|
Discuss
ion
P
a
per
|
3.2 Constraints on sporomorph source region
Several lines of evidence suggest that eastern Tasmania was the main source of the sporomorphs encountered in the Middle Paleocene to Lower Eocene of ODP Site 1172. The distance of this site to the paleo-shoreline of eastern Tasmania during the
Pale-ocene – early EPale-ocene was on the order of∼100 km, whereas the minimum distance
5
to George V Land (Antarctica) amounted to∼500 km (Fig. 1). A Tasmanian source is
further suggested based on the distribution pattern of reworked Permian and Triassic sporomorphs. The assemblages from ODP Site 1172 are characterized by the constant
presence of elements reworked from Permian and Triassic strata (e.g.,Cannanoropollis
spp.,Protohaploxypinusspp.,Alisporitesspp.; see Supplement, Plate II); the
percent-10
ages of reworked sporomorphs reach up to 16 % of the total assemblages. A similar input of reworked Permian and Triassic material is known for sporomorph assemblages from Paleocene–Eocene strata along the Australo-Antarctic Gulf (Otway Basin; Harris, 1965) and from the Eocene of the Wilkes Land margin (Contreras et al., 2013). In the Tasmania region, reworked Permian and Triassic sporomorphs are recorded in the
15
Paleocene–Eocene of the Bass Basin (Partridge et al., 2003) as well as in Eocene
strata offwestern Tasmania and on the South Tasman Rise (Truswell, 1997). This
pat-tern is consistent with the fact that sporomorph-bearing sediments of Permian and Triassic age occur in several regions of Tasmania (e.g., Playford, 1965; Truswell, 1978;
Calver et al., 1984). In contrast, reworked sporomorphs on the continental shelf off
20
George V Land (Antarctica; Fig. 1) comprise only taxa with Cretaceous and Cenozoic ages (Truswell, 1983). A similar picture emerges for the Cenozoic of the Gippsland Basin where Permian and Triassic sporomorphs occur only sporadically and in low numbers (see reports in Department of Primary Industries, 1999).
A further constraint on the source of the sporomorphs at ODP Site 1172 comes
25
CPD
10, 291–340, 2014Southern high-latitude terrestrial climate
change
L. Contreras et al.
Title Page
Abstract Introduction
Conclusions References
Tables Figures
◭ ◮
◭ ◮
Back Close
Full Screen / Esc
Printer-friendly Version Interactive Discussion
Discussion
P
a
per
|
D
iscussion
P
a
per
|
Discussion
P
a
per
|
Discuss
ion
P
a
per
|
and Otaio River sections) (Fig. 3b; see Fig. 1 and Table 1 for site locations and
de-tails on records). It suggests marked differences in floristic compositions between most
records, a result that can be further corroborated for the Bass and Gippsland Basins based on carbon-isotope data from both basins. The Paleocene–Eocene successions
of these basins exhibit distinctly different bulk carbon isotope values, which is
inter-5
preted to reflect the signal from different plant communities contributing to the organic
carbon input into the basins during that time (Boreham et al., 2003). However, despite
the floristic differences between the records analysed, there is a remarkable similarity
in DCA scores between the records from ODP Site 1172 and the Bass Basin (Fig. 3b),
which is located mainly on the shelf offnorthern Tasmania, but also extends into
North-10
east Tasmania (Moore et al., 1984). This similarity further corroborates the scenario of a Tasmanian source for the ODP Site 1172 sporomorph assemblages.
3.3 Sporomorph-based paleoclimate estimates
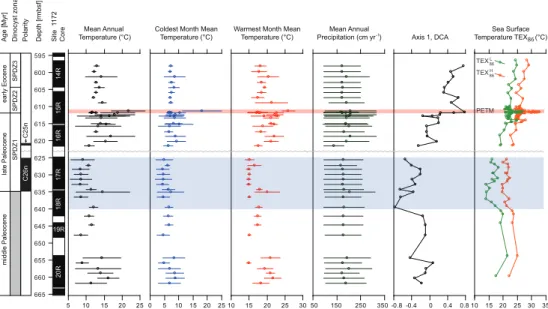
The paleoclimate estimates derived from the sporomorph assemblages from ODP Site 1172 are presented in Fig. 4 and summarized in Table 3. For the middle
Pale-15
ocene (60.7–59.5 Ma), all reconstructed temperature parameters yield relatively cool
values (MAT≃12◦C; CMMT≃7◦C; WMMT≃18◦C). A pronounced further cooling is
documented in all temperature parameters for the middle/late Paleocene transition in-terval (59.5–59.0 Ma). The reconstructed values represent the lowest temperatures of
the entire record; typical values are ∼10◦C for MAT, ∼5◦C for CMMT and ∼16◦C
20
for WMMT (Fig. 4). Markedly higher temperatures prevailed during the late Paleocene (59.0–55.6 Ma) and early Eocene (55.6–54.2 Ma), with estimates for that interval being
on the order of∼15◦C for MAT, ∼8◦C for CMMT and∼20◦C for WMMT. The highest
temperatures of the entire study interval are recorded for the Paleocene/Eocene
transi-tion interval (including the PETM); MAT, CMMT, and WMMT reached values of∼22◦C,
25
∼18◦C and∼26◦C, respectively, during that time (Fig. 4).
The sporomorph-based MAP estimates yield high, near-constant values throughout
CPD
10, 291–340, 2014Southern high-latitude terrestrial climate
change
L. Contreras et al.
Title Page
Abstract Introduction
Conclusions References
Tables Figures
◭ ◮
◭ ◮
Back Close
Full Screen / Esc
Printer-friendly Version Interactive Discussion
Discussion
P
a
per
|
D
iscussion
P
a
per
|
Discussion
P
a
per
|
Discuss
ion
P
a
per
|
4 Interpretation
4.1 Floristic and climatic evolution
Based on our qualitative and quantitative results from the sporomorph record from ODP Site 1172, three main vegetation types prevailed on Tasmania from the middle
Pale-ocene to early EPale-ocene. These vegetation types (i) exhibit different floristic compositions
5
based on the DCA results (Figs. 2 and 3a), (ii) show similar diversities based on the rarefaction results (Fig. 2), and (iii) represent specific climatic conditions based on our sporomorph-derived paleoclimatic reconstructions (Fig. 4). The floristic characteristics and climatic requirements of all three vegetation groups are discussed in the following sections.
10
4.1.1 Middle Paleocene (60.7–59.5 Ma) and late Paleocene (59.0–55.6 Ma)
intervals
During both time intervals, the flora of Tasmania was characterized by
gymnosperm-rich forests dominated by podocarps; Araucariaceae, ferns, protealeans and
Nothofa-guswere further important components of the vegetation. Arecaceae (palms) and
Cy-15
cadales were present during both time intervals. Although the middle Paleocene and
late Paleocene forests exhibited a strongly similar composition, important differences
existed. Podocarps reached a markedly stronger dominance during the middle Pale-ocene than during the late PalePale-ocene, whereas the late PalePale-ocene was characterized by higher abundances of ferns (mainly Cyatheaceae) and the presence of
Casuari-20
naceae (Fig. 2).
With regard to modern analogues, these forests bear resemblance to the extant warm-temperate, Podocarpaceae-dominated forests of Southeast Australia and New Zealand (see, e.g., Kershaw, 1988). Based on the structure of extant temperate forests from southern latitudes (Kershaw, 1988; Enright and Hill, 1995; Veblen et al., 1996;
25
CPD
10, 291–340, 2014Southern high-latitude terrestrial climate
change
L. Contreras et al.
Title Page
Abstract Introduction
Conclusions References
Tables Figures
◭ ◮
◭ ◮
Back Close
Full Screen / Esc
Printer-friendly Version Interactive Discussion
Discussion
P
a
per
|
D
iscussion
P
a
per
|
Discussion
P
a
per
|
Discuss
ion
P
a
per
|
Paleocene was dominated by Podocarpaceae and, to a somewhat lesser extent,
Arau-cariaceae andNothofagus. The understorey, in turn, was likely dominated by ferns, with
Cyatheaceae being particularly abundant during the late Paleocene. Considering the habitats of their extant representatives, Arecaceae (palms), Cycadales, Proteaceae, and Casuarinaceae formed parts of both the over- and understorey (compare Johnson
5
and Wilson, 1993; Hill, 1994; Morley, 2000; Jones, 2002).
Climatically, the presence of tree ferns (i.e., Cyatheaceae), Arecaceae and Cy-cadales implies mild climates with no or merely rare frost events. Owing to physio-logical constraints (including manoxylic wood, large, unprotected buds, soft, water-rich tissues, and a near-absence of frost-“hardening” mechanisms), all these plants are
un-10
able to cope with sustained freezing (Sakai and Larcher, 1987; Wing and Greenwood,
1993); today, they only occur in settings with CMMT≥5.5◦C (Greenwood and Wing,
1995; Utescher and Mosbrugger, 2013).
4.1.2 Middle/late Paleocene transition interval (59.5–∼59.0 Ma)
Across the middle/late Paleocene boundary, the warm-temperate forests characterizing
15
the vegetation on Tasmania during most of the middle and late Paleocene as described
above were transiently replaced by cool-temperate forests dominated byNothofagus
(mainlyN. fuscatype) and Araucariaceae. Ferns, podocarps and protealeans were
fur-ther prominent components of this vegetation. Palms (Arecaceae) and Cycadales, as they occurred both during the preceding part of the middle (60.7–59.5 Ma) and the
sub-20
sequent part of the late Paleocene (59.0–55.6 Ma; see above), were absent (Fig. 2). In light of the age control and the temporal resolution of our record, these cool-temperate
forests prevailed on Tasmania for∼0.5 Ma (based on the duration of elevated
Nothofa-guspercentages) respectively∼0.3 Ma (based on the absence of tropical to
subtrop-ical indicators such as palms and Cycadales). The 1.3 Myr-long hiatus precludes us
25
CPD
10, 291–340, 2014Southern high-latitude terrestrial climate
change
L. Contreras et al.
Title Page
Abstract Introduction
Conclusions References
Tables Figures
◭ ◮
◭ ◮
Back Close
Full Screen / Esc
Printer-friendly Version Interactive Discussion
Discussion
P
a
per
|
D
iscussion
P
a
per
|
Discussion
P
a
per
|
Discuss
ion
P
a
per
|
Today, vegetation dominated by Nothofagus (N. fusca type) is typical of
cool-temperate forests from southern Australia and New Zealand (Kershaw, 1988). Con-sidering the structure of such forests (e.g., McGlone et al., 1996; Reid et al., 1999), the vegetation thriving during the middle/late Paleocene transition interval was
character-ized by a canopy dominated byNothofagusand open understories dominated by ferns
5
(mainly Cyatheaceae and the parent plants ofCeratosporites spp. (Selaginellaceae,
Lycopodiaceae)). Araucariaceae were also present. Because extant members of Arau-cariaceae are tall trees generally confined to the lower mid-latitudes (Kershaw and
Wagstaff, 2001), their presence appears at first sight incompatible with an occurrence
of cool-temperate forests. However, members of the genusAraucariaalso thrive in cold
10
temperate forests in mountainous areas of Chile (Veblen, 1982) and can withstand frost
events as cold as−15◦C (Prentice et al., 1992), which supports our observation that
Araucariaceae were a component of the cool-temperate forests of Tasmania across the middle/late Paleocene transition.
Based on the overall floristic evidence, Tasmania witnessed a transient period of
15
cooler conditions lasting from∼59.5 to ∼59.0. In light of the frost sensitivity of
Are-caceae, Cycadales and Cyatheaceae (compare Sect. 4.1.1), the decline or total ab-sence of these taxa across the middle/late Paleocene transition (Fig. 2) suggests harsher winters (with particularly frequent and/or cold frost events) during that time.
Such lower temperatures are corroborated by the comparison with coeval TEXL86- and
20
TEXH86-based SST data from ODP Site 1172 (Bijl et al., 2009, 2013b; Hollis et al.,
2014). For the interval from∼59.4 to ∼59.0 Ma, they show the lowest values of the
entire Paleocene–Eocene SST record (Fig. 4, Table 3).
4.1.3 PETM and early Eocene interval (55.6–54.2 Ma)
During the early Eocene, the composition of the forests on Tasmania was distinctly
25
different from that of the temperate forests thriving during the Paleocene (Figs. 2 and
CPD
10, 291–340, 2014Southern high-latitude terrestrial climate
change
L. Contreras et al.
Title Page
Abstract Introduction
Conclusions References
Tables Figures
◭ ◮
◭ ◮
Back Close
Full Screen / Esc
Printer-friendly Version Interactive Discussion
Discussion
P
a
per
|
D
iscussion
P
a
per
|
Discussion
P
a
per
|
Discuss
ion
P
a
per
|
Axis 1 sample scores in Fig. 2). Based on our sporomorph data, the early Eocene
vegetation was dominated by ferns and different angiosperms (mainly Proteaceae,
Ca-suarinaceae and Euphorbiaceae/Eumalvoideae). Remarkably, taxa that were common
during the Paleocene (e.g.,Ceratosporitesspp. (Lycopodiaceae, Selaginellaceae) and
Gambierina spp. (extinct clade)) declined dramatically in abundance or disappeared
5
completely during that time (Fig. 2). Because extant Selaginellaceae and
Lycopodi-aceae are cosmopolitan families (Jermy, 1990; Øllgaard, 1990), it is difficult to connect
the disappearance of these taxa on Tasmania during the earliest Eocene with specific ecological and climatic conditions.
The coexistence of frost-tolerant (e.g., Araucariaceae, Podocarpaceae) and
ther-10
mophilous taxa (e.g., Casuarinaceae, Arecaceae (palms)) suggests the presence of
paratropical forests sensu Morley (2000). In particular, the occurrence of Nypa from
the PETM onward into the early Eocene suggests the presence of tropical mangrove vegetation along the coast of Tasmania. A similar vegetation, also containing
ther-mophilous taxa such as Nypa and Gymnostoma (Casuarinaceae), is documented in
15
early Eocene macrofloras from western Tasmania (Pole, 2007; Carpenter et al., 2012). Hence, forests on Tasmania during the early Eocene consisted temporarily of at least
two vegetation associations: (i) a mangrove association characterized byNypa, which
is only recognized during the PETM and the earliest Eocene, and (ii) a paratropical association characterized by the coexistence of frost-tolerant taxa (i.e., Araucariaceae,
20
Podocarpaceae andNothofagus) and thermophilous elements such as palms and
Ca-suarinaceae.
Considering the ecology of the nearest living relatives of the plants represented by the encountered sporomorphs, the overstorey vegetation during the early Eocene
comprised taxa such as Araucariaceae, Podocarpaceae and Nothofagus, whereas
25
CPD
10, 291–340, 2014Southern high-latitude terrestrial climate
change
L. Contreras et al.
Title Page
Abstract Introduction
Conclusions References
Tables Figures
◭ ◮
◭ ◮
Back Close
Full Screen / Esc
Printer-friendly Version Interactive Discussion
Discussion
P
a
per
|
D
iscussion
P
a
per
|
Discussion
P
a
per
|
Discuss
ion
P
a
per
|
The number of sporomorph species registered at ODP Site 1172 remained relatively constant from the middle Paleocene to the early Eocene (Fig. 2). This observation is in contrast to Southeast Australia, where sporomorph assemblages from non-marine and marginal marine settings (Partridge, 1976) exhibit a considerably higher diversity during the early Eocene than during the Paleocene (Macphail et al., 1994; see Sect. 4.2.2.
5
below). The reasons behind this discrepancy may be sought in the particularly high sea level during the early Eocene as it is recorded regionally based on sedimentological and paleontological data from ODP Site 1172 (Exon et al., 2004a) and globally (Miller et al., 2005; Cramer et al., 2011). Owing to the selective nature of marine sporomorph transport as a function of transport distance (e.g., Moss et al., 2005), the higher sea
10
level during the early Eocene than during the Paleocene potentially caused a diversity decrease of the sporomorph assemblages at ODP Site 1172 (see also below).
Our data suggest that the floristic change connected to the PETM is similar to that registered for the early Eocene. However, unravelling the exact anatomy of
vegeta-tion change across the PETM at ODP Site 1172 is difficult due to the low sporomorph
15
yields in the respective sediments at that site. In addition, the interpretation of the available data is hampered by the sea-level rise during the PETM (Sluijs et al., 2011); the transgression-induced change in depositional setting towards more distal condi-tions may have caused a bias in the composition and diversity patterns of sporomorph assemblages, with the resulting assemblages being skewed towards a dominance of
20
easily transported sporomorphs (compare Traverse, 1994, 2008). In light of this bias,
the high abundances (up to 39 %; Fig. 2) ofDilwynites granulatus (Wollemia/Agathis)
and the remarkably low diversities (Fig. 2) in the PETM samples from ODP Site 1172 likely represent a change in depositional setting rather than a true paleoecological
signal. This interpretation is supported by the higher abundances ofDilwynites
granu-25
latus (∼35 %) in early Paleogene sediments deposited in distal environments of the
Bass Basin when compared to the markedly lower abundances (∼10 %) in coeval
CPD
10, 291–340, 2014Southern high-latitude terrestrial climate
change
L. Contreras et al.
Title Page
Abstract Introduction
Conclusions References
Tables Figures
◭ ◮
◭ ◮
Back Close
Full Screen / Esc
Printer-friendly Version Interactive Discussion
Discussion
P
a
per
|
D
iscussion
P
a
per
|
Discussion
P
a
per
|
Discuss
ion
P
a
per
|
to the PETM had a profound impact on the vegetation on Tasmania. They lead to the
extirpation of various ferns (e.g.,Perinomonoletes spp.,Ceratosporites spp.
(Lycopo-diaceae, Selaginellaceae)) and angiosperms (e.g.,Gambierina rudata, Nothofagidites
sp. 1 (Nothofagus)), and the appearance of new angiosperms mainly within the
Pro-teaceae family (e.g.,Proteacidites grandis).
5
4.2 Integration with other terrestrial vegetation records and temperature
estimates from the southern high latitudes
Our results from ODP Site 1172 yield a ∼6.5 Ma-long vegetation record for the
Tas-man sector of the SW Pacific region spanning from the middle Paleocene to the early
Eocene. To obtain insights into the potential regional differentiation of terrestrial
ecosys-10
tems and climates in the high southern latitudes during that time, we have integrated our data from ODP Site 1172 with the available information on terrestrial ecosystems and temperatures from other parts of the SW Pacific domain. Our integration is aug-mented by newly generated temperature estimates for previously published sporo-morph records from Southeast Australia and New Zealand (see Tables 1 and 3 for
15
further information on records evaluated and results). Because other continuous, strati-graphically well-calibrated vegetation records across the middle/late Paleocene transi-tion interval are not yet available for the SW Pacific region, we focus our comparison on the middle Paleocene, late Paleocene and early Eocene.
4.2.1 Middle and late Paleocene
20
Paleobotanical records for the middle and late Paleocene are well known from South-east Australia (e.g., Bass Basin – Macphail et al., 1994; Blevin, 2003, Gippsland Basin – Stover and Partridge, 1973; Macphail et al., 1994; Department of Primary Indus-tries, 1999). In summary, the middle and late Paleocene vegetation in this region con-sisted predominantly of warm temperate forests that were characterized by podocarps,
25
CPD
10, 291–340, 2014Southern high-latitude terrestrial climate
change
L. Contreras et al.
Title Page
Abstract Introduction
Conclusions References
Tables Figures
◭ ◮
◭ ◮
Back Close
Full Screen / Esc
Printer-friendly Version Interactive Discussion
Discussion
P
a
per
|
D
iscussion
P
a
per
|
Discussion
P
a
per
|
Discuss
ion
P
a
per
|
Taylor et al., 1990; Macphail et al., 1994; Greenwood et al., 2003; Greenwood and Christophel, 2005). Similar warm temperate forests dominated by podocarps and Arau-cariaceae, and with a strong contribution of Proteaceae, thrived on New Zealand (Mildenhall, 1980; Raine et al., 2009).
Based on our results, Podocarpaceae together with Araucariaceae, Cyatheaceae
5
and Proteaceae were also the prevailing group of plants during the middle and late Paleocene on Tasmania (Fig. 2; compare also Sect. 4.1.1). However, important floristic
differences existed between Southeast Australia, New Zealand and Tasmania (Fig. 3b);
they are mainly based on the restriction of certain sporomorph taxa to specific regions
(e.g.,Liliacidites spp.,Cibotiidites tuberculiformis – New Zealand;Ilexpollenitesspp. –
10
Southeast Australia [Bass and Gippsland Basins, Southeast Highlands];Tripunctisporis
maastrichtiensis– New Zealand, Bass Basin and Tasmania). Despite the differences in floristic composition, the remarkable dominance of Podocarpaceae and Araucariaceae in Southeast Australia, Tasmania and New Zealand suggests that warm-temperate forests dominated by gymnosperms were the prevalent vegetation type in the
South-15
west Pacific region during the middle and late Paleocene. Moreover, thermophilous
taxa such as palms, Olacaceae (Anacolosa) and Cupanieae first appeared and/or
in-creased significantly in abundance and diversity during the latest Paleocene in South-east Australia (Kemp, 1978; Macphail et al., 1994). On New Zealand, typical tropical
taxa (e.g., Cupanieae,Austrobuxus(Euphorbiaceae),Nypa) also begin to appear
dur-20
ing the latest Paleocene prior to the PETM (Crouch and Brinkhuis, 2005; Raine et al., 2009). Hence, the arrival of thermophilous elements indicates the onset of warmer con-ditions in the Southwest Pacific region during the latest Paleocene. A scenario of warm
conditions is further corroborated by MAT estimates reaching∼18◦C as derived from
latest Paleocene macrofloras in Southeast Australia (Greenwood et al., 2003).
25
CPD
10, 291–340, 2014Southern high-latitude terrestrial climate
change
L. Contreras et al.
Title Page
Abstract Introduction
Conclusions References
Tables Figures
◭ ◮
◭ ◮
Back Close
Full Screen / Esc
Printer-friendly Version Interactive Discussion
Discussion
P
a
per
|
D
iscussion
P
a
per
|
Discussion
P
a
per
|
Discuss
ion
P
a
per
|
terrestrial settings across the Southwest Pacific region consistently experienced a pro-nounced warming during the late Paleocene.
4.2.2 PETM and early Eocene
The effects of the PETM on terrestrial ecosystems in the high southern latitudes are
yet poorly constrained. Available records from Southeast Australia (Bass and
Gipp-5
sland Basins) covering the PETM and the earliest Eocene suggest the widespread
presence ofNypaduring that time (Partridge, 1976). Climatically, this indicates a MAT
>21.7◦C (Utescher and Mosbrugger, 2013). For the South Island of New Zealand,
sporomorph data from nearshore marine sediments document the development of
Nypa mangrove swamps and the appearance of pollen from the thermophilous
sub-10
family Cupanieae connected to the PETM interval (Handley et al., 2011); moreover, the PETM is characterized by a percentage increase of fern spores as well as of Euphorbiaceae/Eumalvoideae and Myrtaceae pollen at the expense of gymnosperm pollen percentages (Handley et al., 2011). Similarly, sporomorph data for the North Island of New Zealand as available from the Tawanui section show the presence of
15
Nypapollen connected to the PETM (Crouch and Visscher, 2003). However, besides
a marked increase ofDilwynites granulatus (Wollemia/Agathis) pollen, no other
signif-icant changes in floristic composition occur (Crouch and Visscher, 2003). Considering that the PETM sediments of the Tawanui section are part of a transgressive systems
tract (Crouch and Brinkhuis, 2005; Sluijs et al., 2008), the high abundances of
Dil-20
wynites granulatus (Wollemia/Agathis) represent a taphonomic rather than a paleoe-cological signal as suggested for the sporomorph record of the PETM from ODP Site 1172 (see Sect. 4.1.3.).
With regard to the early Eocene, the majority of vegetation records in the South-west Pacific region come from Southeast Australia; they suggest that by early Eocene
25
CPD
10, 291–340, 2014Southern high-latitude terrestrial climate
change
L. Contreras et al.
Title Page
Abstract Introduction
Conclusions References
Tables Figures
◭ ◮
◭ ◮
Back Close
Full Screen / Esc
Printer-friendly Version Interactive Discussion
Discussion
P
a
per
|
D
iscussion
P
a
per
|
Discussion
P
a
per
|
Discuss
ion
P
a
per
|
sporomorph percentages are extremely variable within the available records from Southeast Australia, Araucariaceae, Casuarinaceae, Euphorbiaceae/Eumalvoideae, Proteaceae, and ferns are generally the dominant taxa; typical tropical elements such asNypa,Anacolosa and Cupanieae are also recorded (Kemp, 1978; Macphail et al., 1994). This trend in vegetation development during the early Eocene is also
docu-5
mented for Tasmania and it is strongly connected to the PETM event based on the sporomorph record from ODP Site 1172 (see Sect. 4.1.3).
On New Zealand, early Eocene sporomorph assemblages exhibit a mixed Paleocene-Eocene character, with a continued high abundance of conifer pollen (Crouch and Visscher, 2003; Raine et al., 2009). However, thermophilous taxa such as
10
Cupanieae, Casuarinaceae and Euphorbiaceae (Austrobuxus) are constantly present
in these records (Pocknall, 1990; Raine et al., 2009), and Casuarinaceae pollen
abruptly started to dominate the sporomorph assemblages from ∼54.5 Ma onwards
(Raine et al., 2009). On the Wilkes Land margin (Antarctica), paratropical vegetation has been recorded during the early Eocene (53.9–51.9) with the notable presence of
15
thermophilous taxa such as Arecaceae (palms) and Bombacoideae (Pross et al., 2012; Contreras et al., 2013).
Related to temperature conditions, early Eocene macrofloras from Southeast
Aus-tralia suggest a MAT of∼19◦C from∼56 to∼53 Ma (Greenwood et al., 2003), which
is very similar to our MAT estimates for coeval sporomorph records (∼55.8–54.3 Ma;
20
lower Malvacipollis diversus zone of Partridge, 2006; Table 1) from the Bass and
Gipp-sland Basins (∼18◦C; Table 3). On the Wilkes Land margin, climatic estimates for the
early Eocene (53.9–51.9) suggest MAT of∼16◦C for the lowland regions (Pross et al.,
2012). Although occasionally MAT values as high as∼23◦C are recorded during the
earliest Eocene at ODP Site 1172, the mean MAT for this time interval is∼14◦C (Fig. 4,
25
CPD
10, 291–340, 2014Southern high-latitude terrestrial climate
change
L. Contreras et al.
Title Page
Abstract Introduction
Conclusions References
Tables Figures
◭ ◮
◭ ◮
Back Close
Full Screen / Esc
Printer-friendly Version Interactive Discussion
Discussion
P
a
per
|
D
iscussion
P
a
per
|
Discussion
P
a
per
|
Discuss
ion
P
a
per
|
relatively low values may suggest that the eastern part of Tasmania was influenced by the relatively cool Tasman Current (Fig. 1). However, this argument is not supported
by the TEX86-derived SSTs from ODP Site 1172 for the early Eocene, which are much
higher (mean: 23◦C – TEXL86, 28◦C – TEXH86; Bijl et al., 2013b). Terrestrial, macroflorally
derived temperatures on the order of 24◦C from western Tasmania (Carpenter et al.,
5
2012) suggest that this region was significantly warmer than the eastern part of Tasma-nia. Alternatively, another potential explanation for this discrepancy is that the sea-level rise during the early Eocene biased the composition of the sporomorph assemblages at ODP Site 1172 (compare Sect. 4.1.3) towards a dominance of easily transported and/or particularly abundant sporomorphs indicative of cool conditions at the expense
10
of rarer sporomorphs indicative of warmer conditions. This scenario is supported by the fact that many thermophilous plants from the Lower Eocene of the Southwest Pacific
region (e.g., Arecaceae (palms), Cupanieae,Ilex, Nypa) are mainly insect-pollinated
(Bush and Rivera, 1998; Barfod et al., 2011). Hence, these taxa reach only low abun-dances in pollen spectra when compared to wind-pollinated taxa, and they are not likely
15
to be transported over larger distances before they settle (Jackson, 1994).
Despite of the potential bias on the early Eocene sporomorph assemblages at Site 1172, the supraregional replacement of temperate forests by paratropical forests dur-ing the early Eocene on Southeast Australia, New Zealand and Tasmania and the
widespread occurrence ofNypapalms during the PETM on the same regions
consis-20
tently indicate a pronounced reorganization of the vegetation during the early Eocene in the high southern latitudes connected to the PETM.
4.3 Integration with other precipitation records from the southern high latitudes
Based on our paleoclimatic results from the sporomorph record of ODP Site 1172,
MAP on Tasmania was nearly constant (∼180 cm yr−1) from the middle Paleocene to
25
the early Eocene (Fig. 4). These values are comparable to the present-day
precipita-tion received by rainforests in western Tasmania at∼42◦S (185 cm yr−1, Corinna;
CPD
10, 291–340, 2014Southern high-latitude terrestrial climate
change
L. Contreras et al.
Title Page
Abstract Introduction
Conclusions References
Tables Figures
◭ ◮
◭ ◮
Back Close
Full Screen / Esc
Printer-friendly Version Interactive Discussion
Discussion
P
a
per
|
D
iscussion
P
a
per
|
Discussion
P
a
per
|
Discuss
ion
P
a
per
|
(212 cm yr−1; Westport; NIWA, 2013), northern Australia (180 cm yr−1, Darwin Botanic
Gardens; Bureau of Metereology, 2013) and on the east coast of New Caledonia
(197 cm yr−1, Puoébo; Pesin et al., 1995). The high-precipitation regime on
Tasma-nia during the early Paleogene as deduced from the sporomorphs is further
corrobo-rated by the dominance of the dinocyst genusSenegaliniumat ODP Site 1172 during
5
this time interval (Sluijs et al., 2011); this genus is characterized by many fresh-water
tolerant species (Sluijs et al., 2005; Brinkhuis et al., 2006). Hence, the observed
Sene-galinium dominance, which is best explained by substantial freshwater input, is well compatible with high precipitation on Tasmania and a resulting strong freshwater influx on the Tasmanian continental shelf during the early Paleogene.
10
Because of the general lack of precipitation data from other sites at high southern latitudes we can mainly compare our estimates from Tasmania with values deduced from other coeval paleobotanical records. Based on our results from sporomorph as-semblages from Southeast Australia (Table 3), this region experienced similarly high
precipitation (MAP mean: ∼200 cm yr−1) during the early Paleogene; this is
consis-15
tent with MAP mean estimates (186–240 cm yr−1) as derived from macrofloral records
from the Upper Paleocene to Lower Eocene of the same region (Greenwood et al., 2003). On the Wilkes Land margin (Antarctica), high precipitation values (MAP mean:
∼132 cm yr−1) are also suggested for the early Eocene (Pross et al., 2012). These high
precipitation values (>100 cm yr−1) have been corroborated recently by alkaline major
20
element geochemistry for the same Eocene sediments from Antarctica (Passchier et al., 2013).
Based on the overall precipitation data, Tasmania and the Australia-Antarctic re-gion experienced high rainfall conditions during the early Paleogene comparable with present-day rainforests from southern latitudes. This lends support to modeling
stud-25

![Fig. 2. Relative abundances of selected sporomorph taxa ([A] angiosperms, [G] gymnosperms, [P] pteridophytes) representative of the middle Paleocene to early Eocene assemblages from ODP Site 1172](https://thumb-eu.123doks.com/thumbv2/123dok_br/17136913.239317/48.918.68.635.99.405/abundances-sporomorph-angiosperms-gymnosperms-pteridophytes-representative-paleocene-assemblages.webp)