ACPD
13, 27423–27458, 2013Modelling ozone extremes: the importance of
resolution
Z. S. Stock et al.
Title Page
Abstract Introduction
Conclusions References
Tables Figures
◭ ◮
◭ ◮
Back Close
Full Screen / Esc
Printer-friendly Version Interactive Discussion
Discussion
P
a
per
|
D
iscussion
P
a
per
|
Discussion
P
a
per
|
Discuss
ion
P
a
per
|
Atmos. Chem. Phys. Discuss., 13, 27423–27458, 2013 www.atmos-chem-phys-discuss.net/13/27423/2013/ doi:10.5194/acpd-13-27423-2013
© Author(s) 2013. CC Attribution 3.0 License.
Atmospheric Chemistry and Physics
Open Access
Discussions
This discussion paper is/has been under review for the journal Atmospheric Chemistry and Physics (ACP). Please refer to the corresponding final paper in ACP if available.
Representing ozone extremes in
European megacities: the importance of
resolution in a global chemistry climate
model
Z. S. Stock1, M. R. Russo1,2, and J. A. Pyle1,2
1
Centre for Atmospheric Science, Department of Chemistry, University of Cambridge, CB2 1EW, UK
2
National Centre for Atmospheric Science, Department of Chemistry, University of Cambridge, CB2 1EW, UK
Received: 23 August 2013 – Accepted: 29 September 2013 – Published: 23 October 2013 Correspondence to: Z. S. Stock (zss21@cam.ac.uk)
ACPD
13, 27423–27458, 2013Modelling ozone extremes: the importance of
resolution
Z. S. Stock et al.
Title Page
Abstract Introduction
Conclusions References
Tables Figures
◭ ◮
◭ ◮
Back Close
Full Screen / Esc
Printer-friendly Version Interactive Discussion
Discussion
P
a
per
|
D
iscussion
P
a
per
|
Discussion
P
a
per
|
Discuss
ion
P
a
per
|
Abstract
The continuing growth of the world’s urban population has led to an increasing number of cities with more than 10 million inhabitants. The higher emissions of pollutants, cou-pled to higher population density, makes predictions of air quality in these megacities of particular importance from both a science and a policy perspective. Global climate
5
models are typically run at coarse resolution to enable both the efficient running of long time integrations, and the ability to run multiple future climate scenarios. However, when considering surface ozone concentrations at the local scale, coarse resolution can lead to inaccuracies arising from the highly non-linear ozone chemistry and the sensitivity of ozone to the distribution of its precursors on smaller scales. In this study,
10
we use UM-UKCA, a global atmospheric chemistry model, coupled to the UK Met Of-fice Unified Model, to investigate the impact of model resolution on tropospheric ozone, ranging from global to local scales. We focus on the model’s ability to represent the probability of high ozone concentrations in the summer and low ozone concentrations, associated with polluted megacity environments, in the winter, and how this varies with
15
horizontal resolution.
We perform time-slice integrations with two model configurations at typical climate resolution (CR,∼150 km) and at a higher resolution (HR,∼40 km). The CR
configura-tion leads to overestimaconfigura-tion of ozone concentraconfigura-tions on both regional and local scales, while it gives broadly similar results to the HR configuration on the global scale. The HR
20
configuration is found to produce a more realistic diurnal cycle of ozone concentrations and to give a better representation of the probability density function of ozone values in urban areas such as the megacities of London and Paris. We discuss the possible causes for the observed difference in model behaviour between CR and HR configu-rations and estimate the relative contribution of chemical and meteorological factors at
25
ACPD
13, 27423–27458, 2013Modelling ozone extremes: the importance of
resolution
Z. S. Stock et al.
Title Page
Abstract Introduction
Conclusions References
Tables Figures
◭ ◮
◭ ◮
Back Close
Full Screen / Esc
Printer-friendly Version Interactive Discussion
Discussion
P
a
per
|
D
iscussion
P
a
per
|
Discussion
P
a
per
|
Discuss
ion
P
a
per
|
1 Introduction
Tropospheric ozone is both an important air pollutant and a greenhouse gas, and there-fore has the ability to affect both air quality and climate (Jacob and Winner, 2009). Globally, background ozone levels have generally been increasing over the past few decades, although recent trends suggest that the ozone increase is slowing in some
5
European and American cities (Vingarzan, 2004; Parrish et al., 2012). High surface concentrations of ozone are a particular concern for human population exposure be-cause of the adverse effect of ozone on human health (Monks et al., 2009). Damage to ecosystems including crop damage can also occur at high ozone concentrations.
As the world’s urban population grows, poor air quality continues to be a
particu-10
lar concern for the world’s megacities (Molina and Molina, 2004; Gurjar et al., 2008). Megacities, as major emitters of ozone precursor gases, can also have impacts on ozone air quality across much larger hemispherical scales (Lawrence et al., 2007; Butler and Lawrence, 2009), although it is thought that the impact of megacities on the global ozone budget remains relatively small (Butler et al., 2012; Stock et al.,
15
2013). Ozone within megacities can be produced locally by precursor emissions, or transported over long distances from other sources (Wild and Akimoto, 2001; West et al., 2009; Fiore et al., 2009; Parrish et al., 2011). Ozone produced locally in polluted environments involves a complex set of reactions, whereby emitted CO and VOCs are oxidised to form ozone in the presence of NOx (Chameides and Walker, 1973).
20
At high concentrations of NOx, ozone is depleted through reaction with NO, leading
to low ozone concentrations in very NOx rich environments, for example in the cen-ter of megacities. The ozone chemistry is highly non-linear (Sillman et al., 1990; Liu et al., 1987; Lin et al., 1988), with the amount of ozone produced being dependent on the chemical regime, as determined by the ratio of NOx: VOCs (Sillman, 1995,
25
ACPD
13, 27423–27458, 2013Modelling ozone extremes: the importance of
resolution
Z. S. Stock et al.
Title Page
Abstract Introduction
Conclusions References
Tables Figures
◭ ◮
◭ ◮
Back Close
Full Screen / Esc
Printer-friendly Version Interactive Discussion
Discussion
P
a
per
|
D
iscussion
P
a
per
|
Discussion
P
a
per
|
Discuss
ion
P
a
per
|
MEGAPOLI project (MEGAPOLI=Megacities: Emissions, urban, regional and Global Atmospheric POLution and climate effects, and Integrated tools for assessment and mitigation; http://megapoli.info) (Baklanov et al., 2010).
Capturing the non-linearity of this ozone chemistry accurately using the global chem-istry climate models currently used for climate studies is difficult due to the coarse grid
5
resolution at which the models are typically run. Previous studies have shown that model resolution is key to accurately modelling ozone production (Esler et al., 2004; Tie et al., 2010) and to the ability to reproduce observed ozone concentrations (Tang, 2002; Wild and Prather, 2006; Yoshitomi et al., 2011). At coarse grid resolutions, larger grid boxes mean greater averaging of emissions, of chemistry and of meteorological
10
processes (Jang et al., 1995). This can lead to inaccurate representation of the ozone chemistry in areas of sharp emission gradients, such as the transition from urban to rural regions (Sillman et al., 1990; Wild and Prather, 2006).
The averaging of emissions in large grid cells is particularly a problem in representing megacity emissions, as the coarse resolution of a climate model means the grid cells
15
are often larger than the cities themselves. The effect of emission resolution on ozone has been the focus of a number of studies (for example, Tang, 2002; Hodnebrog et al., 2011). Hodnebrog et al. (2011) show that increasing emission resolution is important for local scale spatial changes in ozone concentrations, but less important on larger scales. However, they did not include the impact of model resolution changes on
me-20
teorology, which could have additional effects. The homogeneity of emissions across a large grid cell can also affect the chemistry and rate of reactions between species. Previous studies have considered this through parameterizations of the sub-grid chem-istry to take into account varying species concentrations across the grid cell (Thuburn and Tan, 1997; Pyle and Zavody, 1990). Parameterizations of sub-grid processes have
25
param-ACPD
13, 27423–27458, 2013Modelling ozone extremes: the importance of
resolution
Z. S. Stock et al.
Title Page
Abstract Introduction
Conclusions References
Tables Figures
◭ ◮
◭ ◮
Back Close
Full Screen / Esc
Printer-friendly Version Interactive Discussion
Discussion
P
a
per
|
D
iscussion
P
a
per
|
Discussion
P
a
per
|
Discuss
ion
P
a
per
|
eterizing megacities difficult, especially as the emissions interact with chemistry de-pending on the local composition and background influences (Hodnebrog et al., 2011). In this paper we use the global chemistry-climate model UM-UKCA (http://www.ukca. ac.uk) to show that high resolution is beneficial for capturing the magnitude and diurnal cycle of ozone in highly urbanized areas, such as megacities, and to investigate how
5
model resolution alters the temporal and spatial distribution of ozone across larger scales. A full description of the model and experiment setup can be found in Sect. 2. A focus is placed on representing ozone over the regional European domain and in particular on the megacities of London and Paris, chosen as special interest cities in the European MEGAPOLI project (Baklanov et al., 2010). The impact of resolution on
10
surface ozone is considered on a global scale (Sect. 3.1), regional scale (Sect. 3.2), and on the local scale (Sect. 4). The purpose of this is to highlight the ability of the model to reproduce ozone concentrations at each scale, and to highlight areas where the resolution makes large differences to modelled ozone values. We then analyse differences in the emission resolution, chemistry and meteorology to explain the main
15
causes of the modelled differences (Sect. 5). We offer insight into the benefits and limitations of running a global chemistry climate model at high resolution, and discuss the implications for future ozone air quality modelling across a range of scales.
2 Methodology
Model integrations are performed using the UK Chemistry and Aerosols (UKCA) model
20
(Telford et al., 2010; Archibald et al., 2011; O’Connor et al., 2013), coupled to an atmosphere-only version of the UK Met Office Unified Model (UM version 7.3) (He-witt et al., 2011). The model was run in two different configurations: the Climate Res-olution (CR) integrations were performed at a horizontal resRes-olution of 1.875◦ in
lon-gitude×1.25◦ in latitude (∼150 km); the High Resolution (HR) integrations were per-25
formed at a horizontal resolution of 0.375◦
×0.5◦ (∼40 km). Note that changing the
ACPD
13, 27423–27458, 2013Modelling ozone extremes: the importance of
resolution
Z. S. Stock et al.
Title Page
Abstract Introduction
Conclusions References
Tables Figures
◭ ◮
◭ ◮
Back Close
Full Screen / Esc
Printer-friendly Version Interactive Discussion
Discussion
P
a
per
|
D
iscussion
P
a
per
|
Discussion
P
a
per
|
Discuss
ion
P
a
per
|
in the model parameterization schemes which are resolution dependent. For example, both model resolutions use the convection and boundary layer schemes based respec-tively on Gregory and Rowntree (1990) and Lock et al. (2000), but different options and parameters are used to allow for differences in gridbox size and length of the timestep (more details of the two model configurations and parameterization schemes can be
5
found in Walters et al., 2011). The impact of these further differences is difficult to dis-entangle from the simple effect of the horizontal grid resolution as they are an integral part of the model configuration. We therefore consider the effect of both grid resolution and all other differences as broadly due to model resolution. In this study, both model configurations have 63 hybrid sigma-height levels in the vertical, with a model top at
10
∼41 km. To produce suitable initial conditions for present-day integrations, a nudging
technique (Telford et al., 2008) was used to perform a 3 yr spin-up run (constrained to a perpetual 2005) using the less computationally expensive CR model. Free-running CR and HR monthly integrations were performed for July and November 2005 using dy-namical and chemical initial conditions from the nudged run. July and November were
15
chosen as being representative of summer and winter conditions and although a longer run period would be desirable, when limited by computational restrictions a month is a long enough period to address the distribution of chemical species with relatively short lifetimes (particularly at the surface where emissions and fast chemical reactions dominate ozone production and loss). A summary of the runs performed can be found
20
in Table 1.
A tropospheric chemistry scheme, described in Telford et al. (2010); O’Connor et al. (2013), is used to represent chemical cycles of Ox, HOxand NOxas well as the
oxida-tion of CO and other non-methane hydrocarbons as previously described in Zeng and Pyle (2003). The oxidation of isoprene is included by implementation of the condensed
25
im-ACPD
13, 27423–27458, 2013Modelling ozone extremes: the importance of
resolution
Z. S. Stock et al.
Title Page
Abstract Introduction
Conclusions References
Tables Figures
◭ ◮
◭ ◮
Back Close
Full Screen / Esc
Printer-friendly Version Interactive Discussion
Discussion
P
a
per
|
D
iscussion
P
a
per
|
Discussion
P
a
per
|
Discuss
ion
P
a
per
|
pact of the photolysis scheme on surface ozone is small. Upper boundary conditions for ozone and NOy are fixed to climatological values above 70 hPa: ozone is constrained
using the Rosenlof climatology (Dall’Amico et al., 2010) and NOy is overwritten from
zonal mean values from the Cambridge 2-D model (Law and Pyle, 1993a, b). Concen-trations of long-lived species such as CO2, CH4, N2O and CFCs are fixed to constant
5
values representative of the year 2005. Surface emissions for the chemical species are generated from the emission dataset by Lamarque et al. (2010), as developed for the IPCC fifth assessment report, and updated to 2005 using the RCP-8.5 scenario (Riahi et al., 2011). Isoprene emissions are taken from the POET database (Granier et al., 2005; Olivier et al., 2003) and biomass burning emissions are for the year 2005
10
taken from the Global Fire Emissions Database (GFED) version 3 (van der Werf et al., 2010). A full description of other biogenic emissions can be found in O’Connor et al. (2013). The gridded global emissions data is initially available at a spatial resolution of 0.5◦
×0.5◦and is subsequently interpolated to the CR and HR model grid for use in
model integrations. In all runs, sea surface temperatures and sea ice cover for the year
15
2005 are prescribed from the AMIP dataset (http://www-pcmdi.llnl.gov/projects/amip).
3 Results
3.1 Global ozone evaluation
We first analyse the impact of resolution on the global scale by comparing monthly mean tropospheric ozone column densities for the CR and HR runs. Figure 1 shows
20
that the tropospheric global ozone distribution is broadly similar for CR and HR. Peak ozone columns are observed for both model configurations in tropical regions, decreas-ing at mid-latitudes and over the Antarctic continent. The calculated change in total global ozone burden between CR and HR runs is small and shows that HR tends to produce slightly higher values compared to CR (∼4 % higher in November and ∼6 % 25
re-ACPD
13, 27423–27458, 2013Modelling ozone extremes: the importance of
resolution
Z. S. Stock et al.
Title Page
Abstract Introduction
Conclusions References
Tables Figures
◭ ◮
◭ ◮
Back Close
Full Screen / Esc
Printer-friendly Version Interactive Discussion
Discussion
P
a
per
|
D
iscussion
P
a
per
|
Discussion
P
a
per
|
Discuss
ion
P
a
per
|
gions revealed that most of the difference between the HR and CR ozone burdens is found in the tropics between∼750 hPa and∼250 hPa. This suggests that differences
are likely to arise from interactive lightning NOx emissions which are linked to diff
er-ences in convective cloud characteristics. Even small differences in the distribution and amount of NOx in the tropical upper troposphere can have a large impact on ozone
5
production due to the high sensitivity of ozone to NOx in these clean environments
(Stevenson et al., 2006).
Overall we can infer that, in this study, the impact of increasing model resolution on global ozone burden is small (∼5 %), with differences being largest in the tropical
mid-troposphere likely due to differences in the model representation of convection. We
10
can therefore conclude that an increase in model resolution might not be necessary to investigate long-term changes in global ozone distributions and tropospheric ozone burden.
3.2 European ozone evaluation
To consider regional differences, we focus on ozone over the European continent.
Mod-15
elled surface ozone concentrations are evaluated using ozone data from the European Monitoring Evaluation Programme (EMEP) network (EMEP, 2007). Monthly mean data for 2005 is gathered from over 100 different rural and background stations during the time periods chosen. As well as comparing model results at all EMEP sites, we also in-vestigate further differences between the two model configurations by selecting subsets
20
of the EMEP sites with similar characteristics, grouping sites according to location or by the magnitude of ozone observed. Fourteen stations were chosen as “background” ozone sites, sites that lie away from the influence of direct emission sources, in par-ticular on the western edge of the European domain (experiencing clean air from the Atlantic) or south of Europe in the high ozone concentrations of the Mediterranean.
25
ACPD
13, 27423–27458, 2013Modelling ozone extremes: the importance of
resolution
Z. S. Stock et al.
Title Page
Abstract Introduction
Conclusions References
Tables Figures
◭ ◮
◭ ◮
Back Close
Full Screen / Esc
Printer-friendly Version Interactive Discussion
Discussion
P
a
per
|
D
iscussion
P
a
per
|
Discussion
P
a
per
|
Discuss
ion
P
a
per
|
areas such as megacities often have lower ozone than their surroundings due to titra-tion of ozone by high concentratitra-tions of NO. It is therefore useful to consider how well the model runs capture ozone at these polluted sites. As titration effects are more pronounced in the winter, the sampling was based on monthly mean ozone values in November being lower than a 15 ppb threshold; the same stations were used in July
5
for consistency. Sites that fall into both categories are considered only in the low ozone subset to avoid duplication. The location of background and low ozone sites within the EMEP network is shown in panel a of Fig. 2.
A first measure of the model’s ability to reproduce observed ozone values over Eu-rope is the percentage of sites for which monthly mean modelled ozone is within a factor
10
of two of the observations. A comparison of measured-modelled ozone concentrations for July shows that both HR and CR configurations have over 95 % of ozone values within a factor of 2 of the observations (panel b in Fig. 2). However, both model config-urations share a tendency to overestimate the observed ozone concentrations. Sites that have low observed ozone, in particular the sites at Aliartos, Greece and
Mon-15
telibretti, Italy, are greatly overestimated in the CR model run. Overall, the CR model seems to perform similarly to the HR model in July, when photochemical production plays a large role and ozone values are generally highest.
In contrast, for November only 84–85 % of the modelled ozone concentrations fall within a factor of 2 of EMEP observations (panel c in Fig. 2). Both model integrations
20
seem to perform reasonably well at background sites, but tend to overestimate the low ozone values at more polluted sites, a problem which is again more pronounced for the CR run. In a comparison of summertime surface ozone trends (1991–2005) across Europe using the GEOS-Chem model, Koumoutsaris and Bey (2012) also find that ozone is overestimated at the low end of the distribution, which they attribute to
25
ACPD
13, 27423–27458, 2013Modelling ozone extremes: the importance of
resolution
Z. S. Stock et al.
Title Page
Abstract Introduction
Conclusions References
Tables Figures
◭ ◮
◭ ◮
Back Close
Full Screen / Esc
Printer-friendly Version Interactive Discussion
Discussion
P
a
per
|
D
iscussion
P
a
per
|
Discussion
P
a
per
|
Discuss
ion
P
a
per
|
better captures the lower ozone values associated with more polluted regions, while CR largely overestimates ozone at these sites.
A simple quantitative error analysis similar to that of Martins (2012) and widely used in model validation techniques is used to further discriminate between HR and CR results. Monthly mean modelled and observed ozone concentrations from the EMEP
5
network are used to calculate the model correlation coefficient (r), standard deviation (S), Root Mean Square Error (RMSE) and Mean Bias Error (MBE), shown in Table 2 for both July and November. The MBE is an indication of the model tendency to over or under predict observed values. The RMSE is calculated as in Borrego et al. (2008). A low value for RMSE and MBE shows a good match between model and observations,
10
with 0 the perfect score. The standard deviation of the model (S) is calculated as the square root of the model variance. The standard deviation of the observations (Sobs) is calculated in the same manner using the observational data and ideally the standard deviation of the model and the standard deviation of the observations are approximately equal.Sobs is found to be 9.31 ppb and 8.64 ppb for July and November respectively
15
(see Table 2 for model comparison). The statistics are in agreement with the results in Fig. 2 with generally similar values for HR and CR in July, except for polluted sites, for which HR performs slightly better. Both resolutions show a large positive bias in the July results, this is linked to higher ozone concentrations in summer months, caused by enhanced photochemistry compared to winter months. However, in November the
20
statistical analysis shows that HR performs better than CR for background as well as polluted sites, with the HR model bias being particularly low.
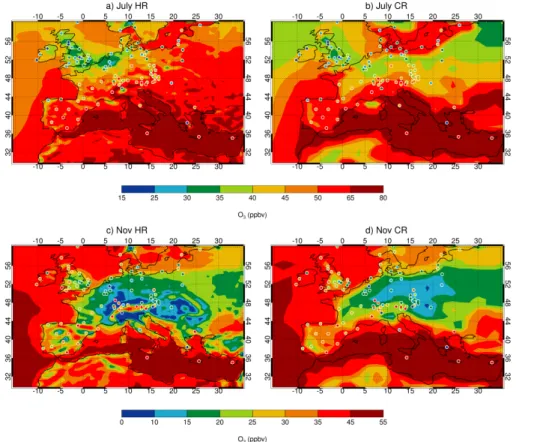
Finally, to address the impact of resolution on the modelled ozone distribution over Europe, we compare monthly mean surface ozone maps from HR and CR runs for July and November, as shown in Fig. 3. Ozone concentrations from EMEP stations
25
config-ACPD
13, 27423–27458, 2013Modelling ozone extremes: the importance of
resolution
Z. S. Stock et al.
Title Page
Abstract Introduction
Conclusions References
Tables Figures
◭ ◮
◭ ◮
Back Close
Full Screen / Esc
Printer-friendly Version Interactive Discussion
Discussion
P
a
per
|
D
iscussion
P
a
per
|
Discussion
P
a
per
|
Discuss
ion
P
a
per
|
urations share a tendency to overestimate ozone, particularly in northern and central Europe.
In November, the HR configuration is better able to reproduce the very low ozone values associated with pollution hotspots, such as the Po Valley in Italy, the Rhine-Ruhr Valley in Germany and the London-Birmingham corridor in the UK. In winter, precursor
5
emissions dominate ozone concentrations through ozone titration effects: the higher grid resolution retains the large precursor emissions and their horizontal gradients, whereas with a coarse resolution grid, ozone-precursor emissions are spread over a larger area. In both months, the lower ozone values associated with large cities are better resolved in the HR run, largely due to the higher emission resolution, an effect
10
which is discussed further in Sect. 5. Coastal boundaries, and the associated land-sea ozone gradients, are better resolved in the HR run. Some large islands in the Mediterranean and large areas of Italy and Greece are not correctly represented as land in the CR run, resulting in overestimation of ozone concentrations across these locations, as ozone deposition over the sea is typically small compared to that over land
15
(Coleman et al., 2010). The low ozone in the Po Valley and high ozone in mountain ranges, such as the Pyrenees and Alps, are also better resolved in the model HR configuration due to the higher resolution orography.
Overall, we find that increasing model resolution leads to improvements in the rep-resentation of regional ozone, shown by small increases inr, decreases in RMSE and
20
bias and closer agreement to the spatial distribution and magnitude of observations. In particular, the HR run is able to better capture ozone gradients related to the represen-tation of surface characteristics and the very low ozone concentrations associated with emission hotspots in the winter month of November.
4 Local ozone and its temporal variation 25
ACPD
13, 27423–27458, 2013Modelling ozone extremes: the importance of
resolution
Z. S. Stock et al.
Title Page
Abstract Introduction
Conclusions References
Tables Figures
◭ ◮
◭ ◮
Back Close
Full Screen / Esc
Printer-friendly Version Interactive Discussion
Discussion
P
a
per
|
D
iscussion
P
a
per
|
Discussion
P
a
per
|
Discuss
ion
P
a
per
|
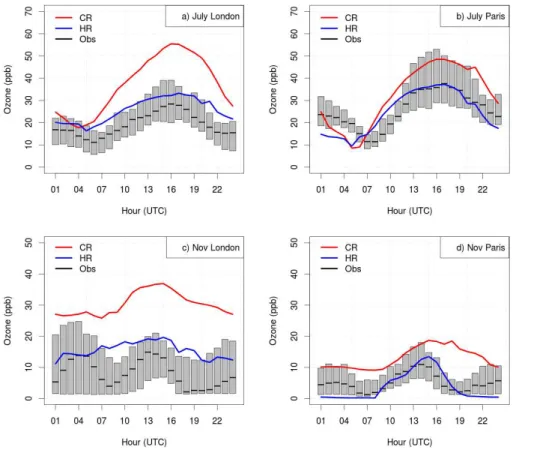
London and Paris. The health impacts of high ozone concentrations are potentially greatest in megacities where population densities are large. It is therefore important to investigate how well the model can capture the complex ozone photochemistry by addressing how well the ozone temporal evolution and ozone extremes are represented in such polluted environments.
5
The ability of the model to represent ozone in megacities is evaluated against data from two air quality observation networks, the London Air Quality Network (LAQN) (www.londonair.org.uk) and the airparif network (http://www.airparif.asso.fr). In London, we use hourly data averaged across twelve sites from the LAQN network. Stations were selected based on the availability of data, with the intention of gaining a wide
distribu-10
tion across central London which includes roadside as well as urban background sites. In Paris, four central sites are used from the airparif network. Fewer sites are used for Paris, a city which is smaller and more compact compared to London.
In order to assess the model’s ability to capture ozone chemistry in polluted megac-ity environments, we use hourly data from HR and CR runs to construct monthly
aver-15
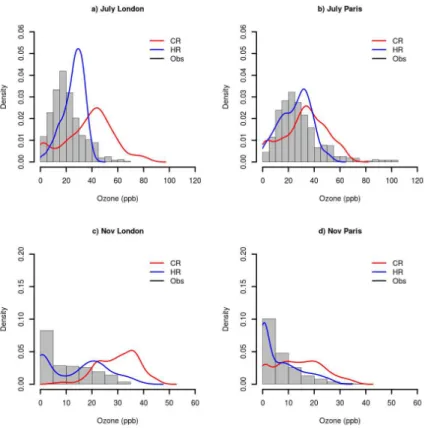
aged diurnal cycles of surface ozone (Fig. 4) and probability density functions (PDFs) of ozone concentrations (Fig. 5) for London and Paris in July and November. The mod-elled surface ozone in both megacities shows a marked diurnal cycle similar to ob-servations (see Fig. 4). Both model configurations can reproduce the shift in the daily ozone peak going from mid-afternoon in July to early afternoon in November. Note that
20
the model configurations use a relatively simple representation of precursor emissions, which includes a seasonal cycle but has no weekly or diurnal cycle to match the higher emissions from rush hour traffic. However, the temporal evolution of ozone is captured reasonably well by both model configurations, since the photochemistry of the emitted NOxleads to a strong diurnal variation in the NO to NO2ratio.
25
ACPD
13, 27423–27458, 2013Modelling ozone extremes: the importance of
resolution
Z. S. Stock et al.
Title Page
Abstract Introduction
Conclusions References
Tables Figures
◭ ◮
◭ ◮
Back Close
Full Screen / Esc
Printer-friendly Version Interactive Discussion
Discussion
P
a
per
|
D
iscussion
P
a
per
|
Discussion
P
a
per
|
Discuss
ion
P
a
per
|
emissions, which results in NO concentrations being too high at night and the model overestimating the amount of ozone lost through titration.
Similarly, Fig. 5 shows that the HR configuration can better reproduce the shape of the ozone distribution compared to CR, which has a flatter PDF and tends to as-sociate the largest probabilities at ozone concentrations much higher than observed.
5
Additionally, the high probability of very low ozone values observed in both megacities for the winter month of November is better captured in the HR runs (panel c and d in Fig. 5). This is linked to high NO concentrations leading to ozone titration, a process more effective at HR due to the higher emission resolution. For the summer month of July, when ozone concentrations are highest, the CR configuration shows a greater
10
tendency to overestimate the observed probability of high ozone values in London, al-though both model configurations underestimate the same probability in Paris (panel a and b of Fig. 5).
The PDF analysis supports the conclusion that the HR configuration is better able to capture the surface ozone at the local scale. Increasing the model horizontal resolution
15
leads to an improvement in the model’s ability to represent both the average magnitude of the ozone diurnal cycle and the high probability of low ozone extremes observed in both megacities in November. However, the probability of high ozone events in July is not particularly well captured by either model configuration. The simple representation of ozone precursor emissions, or the inability of the model to realistically capture
ex-20
treme meteorological conditions, such as persistent high pressure systems leading to high ozone events, might be possible reasons for this discrepancy.
5 Discussion
Ozone chemical production and loss is crucial in determining ozone concentrations. Near the surface, these processes are largely influenced by local ozone precursor
25
ACPD
13, 27423–27458, 2013Modelling ozone extremes: the importance of
resolution
Z. S. Stock et al.
Title Page
Abstract Introduction
Conclusions References
Tables Figures
◭ ◮
◭ ◮
Back Close
Full Screen / Esc
Printer-friendly Version Interactive Discussion
Discussion
P
a
per
|
D
iscussion
P
a
per
|
Discussion
P
a
per
|
Discuss
ion
P
a
per
|
also play an important role in determining the distribution of surface ozone. In a com-plex model, where chemistry and meteorology are both influenced by model resolution, all these processes are strongly interlinked. In this section we discuss possible factors contributing to the differences highlighted in the previous section and assess the sen-sitivity of the modelled ozone to different chemical and meteorological factors across
5
different spatial scales. Model resolution was shown to have a small impact on ozone at the global scale and the differences observed have been discussed in Sect. 3.1. We therefore concentrate on the factors which are more likely to affect ozone differences between HR and CR on the regional and local scale.
We first consider a series of chemical diagnostics to address the differences in ozone
10
concentrations between the two model configurations. Due to the non-linearity of ozone chemistry, the ratio of NOxto VOCs in the environment is a crucial factor for
determin-ing ozone chemical production and loss (Jenkin and Clemitshaw, 2000; Sillman, 1995, 1999). As the ratio of NOx to VOCs at the surface is sensitive to emissions and initial conditions, we expect resolution to influence the chemical regime. Rural sites and
re-15
gions downwind of ozone precursor emissions are generally NOx-limited (with ozone
production increasing with NOxconcentrations) whereas more polluted areas are typi-cally VOC-limited (with ozone production increasing with VOC concentrations). In very polluted areas, such as urban areas and megacities, the very high NOxconcentrations
can lead to efficient ozone removal through direct reaction of ozone with NO (ozone
20
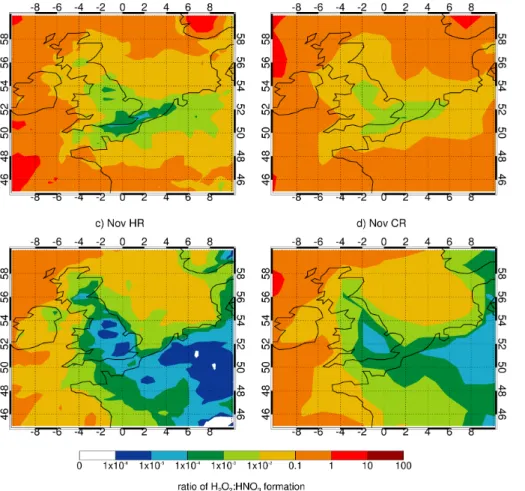
titration). To diagnose chemical regime, and how it varies with season and model res-olution, we use the ratio of hydrogen peroxide to nitric acid formation (Sillman, 1995). Going from high to low ratios in Fig. 6 denotes a transition from NOx-limited to VOC-limited regimes. Figure 6 shows that the modelled chemical environment is generally NOx-limited over the oceans, away from direct NOx emissions, and VOC-limited over
25
ACPD
13, 27423–27458, 2013Modelling ozone extremes: the importance of
resolution
Z. S. Stock et al.
Title Page
Abstract Introduction
Conclusions References
Tables Figures
◭ ◮
◭ ◮
Back Close
Full Screen / Esc
Printer-friendly Version Interactive Discussion
Discussion
P
a
per
|
D
iscussion
P
a
per
|
Discussion
P
a
per
|
Discuss
ion
P
a
per
|
model configurations, with chemical regimes generally being more NOx-limited due to the increase in photochemically generated HOx. Where the environment is clearly
VOC or NOx-limited, resolution makes only a small difference to the diagnosed
chem-ical regime. However, sharp gradients and changes in chemchem-ical regime, particularly in winter months at the boundary of a highly polluted urban region to rural surroundings,
5
are better captured in the HR model.
Another useful chemical diagnostic is the ozone production efficiency (OPE), defined as the net number of molecules of ozone produced per molecules of NOx lost (Liu
et al., 1987; Lin et al., 1988). We calculate OPE as the ratio of ozone production to NOx lost for a limiting case, in which the only loss of NOx is the oxidation of NO2
10
by OH. On a regional scale over Europe, our analysis shows that areas where the CR run overestimates surface ozone concentrations compared to the HR run, also have a greater OPE in the model. Once again, differences between the two model configurations seem to be relatively small in July and significantly more pronounced in November. We calculate average OPE over a smaller European domain, defined as
15
−10◦–10◦E and 45◦–65◦N, which includes the megacities of London and Paris. Values
of monthly average OPE range between 2–5 mol mol−1over this region. The average
OPE in the model for this domain is∼1 % higher in the CR run in July and∼21 % higher
in November, compared to the HR run. These differences demonstrate the impact that model resolution has on the chemistry at this scale. The influence is more pronounced
20
in very polluted environments in the winter months, when the concentration of ozone-precursor gases dominates ozone production.
The differences in chemical regime and OPE between the two model configura-tions are ultimately linked to the concentraconfigura-tions of NOx and other ozone precursor
gases. Coarser resolution is known to spread out NOx and VOC emissions by
aver-25
ACPD
13, 27423–27458, 2013Modelling ozone extremes: the importance of
resolution
Z. S. Stock et al.
Title Page
Abstract Introduction
Conclusions References
Tables Figures
◭ ◮
◭ ◮
Back Close
Full Screen / Esc
Printer-friendly Version Interactive Discussion
Discussion
P
a
per
|
D
iscussion
P
a
per
|
Discussion
P
a
per
|
Discuss
ion
P
a
per
|
higher emission resolution in the HR configuration, we performed an extra sensitivity run for the month of November. In this sensitivity experiment the HR model is run with the same resolution emissions as the CR model, while everything else in the model configuration is unchanged. Differences between these two HR runs highlight the con-tribution to ozone differences due to the emission resolution. We focus on November
5
since the chemical regime and OPE analyses suggest that, in July, resolution plays a small role on the model chemistry. When comparing monthly mean ozone concentra-tions averaged across all EMEP sites, we find that the difference in emission resolution accounts for∼30 % of the difference between the HR and CR runs. However, some
regional surface ozone features shown in Fig. 3, such as the very low ozone over the
10
Po Valley region, are still well represented despite using coarser resolution emissions, confirming that surface characteristics and meteorology also play a large role at the regional scale. When going down to the local scale, for the megacities of London and Paris, emission resolution becomes the dominant factor. The average ozone concentra-tion for London in November is∼50 % higher when using coarse resolution emissions 15
and this accounts for∼55 % of the difference between the HR and CR runs. For Paris,
the impact of emission resolution is even greater: the average ozone concentration in November when using coarse resolution emissions is∼4 times larger compared to the
standard HR run and is furthermore∼15 % larger than the CR run.
We therefore conclude that, in winter months, emission resolution accounts for about
20
one third of the observed difference between CR and HR at the European scale, but it has an even greater impact on the local scale for highly polluted urban environments, for which dilution of NOx emissions significantly reduces ozone titration by NO. This supports the conclusions of Hodnebrog et al. (2011) that the resolution of emissions is important for local scale, air quality studies, but less relevant on regional and global
25
scales.
trans-ACPD
13, 27423–27458, 2013Modelling ozone extremes: the importance of
resolution
Z. S. Stock et al.
Title Page
Abstract Introduction
Conclusions References
Tables Figures
◭ ◮
◭ ◮
Back Close
Full Screen / Esc
Printer-friendly Version Interactive Discussion
Discussion
P
a
per
|
D
iscussion
P
a
per
|
Discussion
P
a
per
|
Discuss
ion
P
a
per
|
port on the regional scale. The impact of BLH on ozone concentrations depends on the chemical environment experienced by a particular region. Generally, when ozone pro-duction downwind of precursor emissions dominates, and particularly in summer, when increased photochemistry leads to efficient ozone production, a higher boundary layer spreads the ozone vertically and therefore results in lower ozone concentrations at the
5
surface. However, in polluted areas at times when ozone titration dominates, a lower boundary layer leads to build up of NO emitted at the surface and therefore results in lower surface ozone concentrations.
Figure 7 shows a comparison of BLH for the CR and HR runs. The impact of resolu-tion on BLH is generally higher in July, with the CR configuraresolu-tion underestimating BLH
10
over much of the European domain, compared to the HR run. In both November and July the HR run has a higher boundary layer over central Europe, which corresponds to the lower ozone concentrations found over these regions. Features such as the Po Val-ley, and it’s associated lower boundary layer, are better resolved at HR due to a better representation of the orography. Additionally, the BLH field is more homogeneous in CR
15
compared to HR, particularly in November, and this lack of sharp horizontal gradients in BLH would promote horizontal transport across a large area of central Europe. Fo-cusing on the megacities of London and Paris, the HR and CR configurations both have similar BLHs in November, and therefore differences in surface ozone concentrations cannot be attributed to differences in vertical mixing. However, in the summer month
20
of July, the BLH has a much stronger diurnal profile for both model resolutions and the CR configuration has a consistently lower BLH for both London and Paris compared to HR. This suggests that the CR tendency to overestimate surface ozone concentrations in July (see Fig. 4) can be partly explained by a less efficient vertical mixing due to lower BLHs.
25
ACPD
13, 27423–27458, 2013Modelling ozone extremes: the importance of
resolution
Z. S. Stock et al.
Title Page
Abstract Introduction
Conclusions References
Tables Figures
◭ ◮
◭ ◮
Back Close
Full Screen / Esc
Printer-friendly Version Interactive Discussion
Discussion
P
a
per
|
D
iscussion
P
a
per
|
Discussion
P
a
per
|
Discuss
ion
P
a
per
|
and local scale. In the winter months, emission resolution can drive changes in chem-ical regimes and OPE, and can account for a large part of the observed differences between HR and CR at the regional and local scale.
6 Conclusions
We have run the global chemistry-climate model UM-UKCA at typical climate
resolu-5
tion (CR, ∼150 km) and higher resolution (HR, ∼40 km) to investigate the impact of
horizontal resolution on tropospheric ozone at a variety of scales. Model integrations were performed for present day conditions for the months of July and November, rep-resenting typical summer and winter conditions.
At the global scale, there is only a small difference (∼5 %) between the CR and 10
HR results. Ozone concentrations are higher in the HR results in the tropical mid-troposphere suggesting that the influence of model resolution on the representation of convective cloud properties and the associated emission of NOx from lightning is the
main contributing factor to the observed differences.
At the local scale, we compared modelled surface ozone for the megacities of
Lon-15
don and Paris to measurements from local air quality networks (LAQN and airparif respectively). The surface ozone diurnal cycles and PDFs are better captured at HR. In particular, the very low ozone values associated with polluted areas at night are better captured by the HR configuration. Our analysis shows that, in the winter month of November, there are large differences in the OPE between HR and CR, and the
20
improvements shown in the HR results are mainly driven by the higher emission reso-lution, which accounts for over 50 % of the difference in London ozone concentrations. Conversely, we suggest that the observed differences in the modelled surface ozone in July are less affected by chemical differences and can be partly attributed to differences in the representation of the BLH in the two model configurations.
25
ACPD
13, 27423–27458, 2013Modelling ozone extremes: the importance of
resolution
Z. S. Stock et al.
Title Page
Abstract Introduction
Conclusions References
Tables Figures
◭ ◮
◭ ◮
Back Close
Full Screen / Esc
Printer-friendly Version Interactive Discussion
Discussion
P
a
per
|
D
iscussion
P
a
per
|
Discussion
P
a
per
|
Discuss
ion
P
a
per
|
MBE, particularly for November, when the CR configuration has a tendency to largely overestimate the very low ozone concentrations associated with more polluted sites. The chemical regime analysis shows that, for the month of November, the CR config-uration misses the very VOC-limited regimes which are generally associated to ozone titration by NO and therefore low ozone concentrations. The OPE analysis also shows
5
that model differences at the regional scale are largest in November, with CR overes-timating the average OPE over a small European domain by∼21 %, while being only ∼1 % higher in July. For November, emission resolution accounts for ∼30 % of the
observed differences between CR and HR average European surface ozone concen-trations. In July, increased ozone photochemical production leads to generally higher
10
ozone concentrations across Europe. Differences between the two model configura-tions are smaller and both have a tendency to overestimate ozone values compared to observations, as indicated by the larger MBE values. The chemical regime and OPE analyses show that in the summer the influence of resolution on modelled chem-istry is small. Analysis of BLH for the two model configurations suggests that in the
15
summer month of July, when photochemical production and ozone concentrations are higher, vertical mixing plays a key role in determining surface ozone concentrations and changes in BLH due to model resolution are largely responsible for the observed differences between HR and CR.
The model’s ability to represent high and low ozone extremes in megacities was
20
shown to be very sensitive to horizontal resolution. The high resolution model gener-ally gives better results compared to observations and is better able to capture the high probability of very low surface ozone in very polluted urban areas. The HR configura-tion also gives a better representaconfigura-tion of surface characteristics and regional transiconfigura-tions in chemical regimes from VOC to NOx-limited environments. This could have
implica-25
tions for modelling in support of regional policies as lowering NOx in a VOC-limited environment can lead to increased ozone production.
ACPD
13, 27423–27458, 2013Modelling ozone extremes: the importance of
resolution
Z. S. Stock et al.
Title Page
Abstract Introduction
Conclusions References
Tables Figures
◭ ◮
◭ ◮
Back Close
Full Screen / Esc
Printer-friendly Version Interactive Discussion
Discussion
P
a
per
|
D
iscussion
P
a
per
|
Discussion
P
a
per
|
Discuss
ion
P
a
per
|
under grant agreement no. 212520. Zadie Stock wishes to thank the Natural Environment Re-search Council for studentship funding.
References
Archibald, A., Levine, J., Abraham, N., Cooke, M., Edwards, P., Heard, D., Jenkin, M., Karuna-haran, A., Pike, R., Monks, P., Shallcross, D., Telford, P., Whalley, L., and Pyle, J.: Im-5
pacts of HOx regeneration and recycling in the oxidation of isoprene: consequences for
the composition of past, present and future atmospheres, Geophys. Res. Lett., 38, L05804, doi:10.1029/2010GL046520, 2011. 27427
Baklanov, A., Lawrence, M., Pandis, S., Mahura, A., Finardi, S., Moussiopoulos, N.,
Beek-mann, M., Laj, P., Gomes, L., Jaffrezo, J.-L., Borbon, A., Coll, I., Gros, V., Sciare, J.,
Kukko-10
nen, J., Galmarini, S., Giorgi, F., Grimmond, S., Esau, I., Stohl, A., Denby, B., Wagner, T., Butler, T., Baltensperger, U., Builtjes, P., van den Hout, D., van der Gon, H. D., Collins, B., Schluenzen, H., Kulmala, M., Zilitinkevich, S., Sokhi, R., Friedrich, R., Theloke, J., Kum-mer, U., Jalkinen, L., Halenka, T., Wiedensholer, A., Pyle, J., and Rossow, W. B.: MEGAPOLI: concept of multi-scale modelling of megacity impact on air quality and climate, Adv. Sci. Res., 15
4, 115–120, 2010. 27426, 27427
Borrego, C., Monteiro, A., Ferreira, J., Miranda, A., Costa, A., Carvalho, A., and Lopes, M.: Procedures for estimation of modelling uncertainty in air quality assessment, Environ. Int., 34, 613–620, 2008. 27432
Butler, T. M. and Lawrence, M. G.: The influence of megacities on global atmospheric chemistry: 20
a modelling study, Environ. Chem., 6, 219–225, 2009. 27425
Butler, T. M., Stock, Z. S., Russo, M. R., Denier van der Gon, H. A. C., and Lawrence, M. G.: Megacity ozone air quality under four alternative future scenarios, Atmos. Chem. Phys., 12, 4413–4428, doi:10.5194/acp-12-4413-2012, 2012. 27425
Cariolle, D., Caro, D., Paoli, R., Hauglustaine, D. A., Cuénot, B., Cozic, A., and Paugam, R.: 25
Parameterization of plume chemistry into large-scale atmospheric models: application to
aircraft NOxemissions, J. Geophys. Res. Atmos., 114, D19302, doi:10.1029/2009JD011873,
2009. 27426
Chameides, W. and Walker, J.: A photochemical theory for tropospheric ozone, J. Geophys. Res., 78, 8751–8760, doi:10.1029/JC078i036p08751, 1973. 27425
ACPD
13, 27423–27458, 2013Modelling ozone extremes: the importance of
resolution
Z. S. Stock et al.
Title Page
Abstract Introduction
Conclusions References
Tables Figures
◭ ◮
◭ ◮
Back Close
Full Screen / Esc
Printer-friendly Version Interactive Discussion
Discussion
P
a
per
|
D
iscussion
P
a
per
|
Discussion
P
a
per
|
Discuss
ion
P
a
per
|
Charlton-Perez, C. L., Evans, M. J., Marsham, J. H., and Esler, J. G.: The impact of
reso-lution on ship plume simulations with NOx chemistry, Atmos. Chem. Phys., 9, 7505–7518,
doi:10.5194/acp-9-7505-2009, 2009. 27426
Coleman, L., Varghese, S., Tripathi, O., Jennings, S., and, O’Down, C. D.: Regional-scale ozone deposition to North-East Atlantic waters, Advances in Meteorology, 2010, 243701, 5
doi:10.1155/2010/243701, 2010. 27433
Dall’Amico, M., Gray, L. J., Rosenlof, K. H., Scaife, A. A., Shine, K. P., and Stott, P. A.: Strato-spheric temperature trends: impact of ozone variability and the QBO, Clim. Dynam., 34, 381– 398, 2010. 27429
EMEP, 2007: Ozone measurements 2005, Tech. rep., EMEP/CCC-Report 2/2007, Fjraa, A. M. 10
and Hjellbrekke, A. G., available at: http://www.nilu.no/projects/ccc/reports/cccr2-2007.pdf (last access: July 2013), 2007. 27430, 27451
Esler, J. G., Roelofs, G. J., Köhler, M. O., and O’Connor, F. M.: A quantitative analysis of grid-related systematic errors in oxidising capacity and ozone production rates in chemistry transport models, Atmos. Chem. Phys., 4, 1781–1795, doi:10.5194/acp-4-1781-2004, 2004. 15
27426, 27437
Fiore, A., Dentener, F., Wild, O., Cuvelier, C., Schultz, M., Hess, P., Textor, C., Schulz, M., Doherty, R., Horowitz, L., MacKenzie, I., Sanderson, M., Shindell, D., Stevenson, D., Szopa, S., Van Dingenen, R., Zeng, G., Atherton, C., Bergmann, D., Bey, I., Carmichael, G., Collins, W., Duncan, B., Faluvegi, G., Folberth, G., Gauss, M., Gong, S., Hauglustaine, D., 20
Holloway, T., Isaksen, I., Jacob, D., Jonson, J., Kaminski, J., Keating, T., Lupu, A., Marmer, E., Montanaro, V., Park, R., Pitari, G., Pringle, K., Pyle, J., Schroeder, S., Vivanco, M., Wind, P., Wojcik, G., Wu, S., and Zuber, A.: Multimodel estimates of intercontinental source–receptor relationships for ozone pollution, J. Geophys. Res. Atmos., 114, D04301, doi:10.1029/2008JD010816, 2009. 27425
25
Franke, K., Eyring, V., Sander, R., Hendricks, J., Lauer, A., and Sausen, R.: Toward eff
ec-tive emissions of ships in global models, Meteorol. Z., 17, 117–129, doi:10.1127/0941-2948/2008/0277, 2008. 27426
Granier, C., Guenther, A., Lamarque, J., Mieville, A., Muller, J., Olivier, J., Orlando, J., Pe-ters, J., Petron, G., Tyndall, G., and Wallens, S.: POET, a database of surface emissions of 30
ACPD
13, 27423–27458, 2013Modelling ozone extremes: the importance of
resolution
Z. S. Stock et al.
Title Page
Abstract Introduction
Conclusions References
Tables Figures
◭ ◮
◭ ◮
Back Close
Full Screen / Esc
Printer-friendly Version Interactive Discussion
Discussion
P
a
per
|
D
iscussion
P
a
per
|
Discussion
P
a
per
|
Discuss
ion
P
a
per
|
Gregory, D. and Rowntree, P.: A mass flux convection scheme with representation of cloud ensemble characteristics and stability-dependent closure, Mon. Weather Rev., 118, 1483– 1506, 1990. 27428
Gurjar, B. R., Butler, T. M., Lawrence, M. G., and Lelieveld, J.: Evaluation of emissions and air quality in megacities, Atmos. Environ., 42, 1593–1606, 2008. 27425
5
Hewitt, H. T., Copsey, D., Culverwell, I. D., Harris, C. M., Hill, R. S. R., Keen, A. B., McLaren, A. J., and Hunke, E. C.: Design and implementation of the infrastructure of
HadGEM3: the next-generation Met Office climate modelling system, Geosci. Model Dev.,
4, 223–253, doi:10.5194/gmd-4-223-2011, 2011. 27427
Hodnebrog, Ø., Stordal, F., and Berntsen, T.: Does the resolution of megacity emissions impact 10
large scale ozone?, Atmos. Environ., 45, 6852–6862, doi:10.1016/j.atmosenv.2011.01.012, 2011. 27426, 27427, 27438
HTAP: Hemispheric Transport of Air Pollution 2010, Part A: Ozone and particulate matter, air pollution studies No. 17, Tech. rep., edited by: Dentener, F., Keating, T., and Akimoto, H., United Nations, New York and Geneva, 2010. 27425
15
Jacob, D. J. and Winner, D. A.: Effect of climate change on air quality, Atmos. Environ., 43,
51–63, doi:10.1016/j.atmosenv.2008.09.051, 2009. 27425
Jacob, D. J., Logan, J. A., Gardner, G. M., Yevich, R. M., Spivakovsky, C. M., Wofsy, S. C., Sillman, S., and Prather, M. J.: Factors regulating ozone over the United States and its export to the global atmosphere, J. Geophys. Res. Atmos., 98, 14817–14826, 20
doi:10.1029/98JD01224, 1993. 27437
Jang, J. C. C., Jeffries, H. E., Byun, D., and Pleim, J. E.: Sensitivity of ozone to model grid
resolution, 1. Application of high-resolution regional acid deposition model, Atmos. Environ., 29, 3085–3100, doi:10.1016/1352-2310(95)00118-I, 1995. 27426
Jenkin, M. and Clemitshaw, K.: Ozone and other secondary photochemical pollutants: chemical 25
processes governing their formation in the planetary boundary layer, Atmos. Environ., 34, 2499–2527, 2000. 27436
Koumoutsaris, S. and Bey, I.: Can a global model reproduce observed trends in summertime surface ozone levels?, Atmos. Chem. Phys., 12, 6983–6998, doi:10.5194/acp-12-6983-2012, 2012. 27431
30
ACPD
13, 27423–27458, 2013Modelling ozone extremes: the importance of
resolution
Z. S. Stock et al.
Title Page
Abstract Introduction
Conclusions References
Tables Figures
◭ ◮
◭ ◮
Back Close
Full Screen / Esc
Printer-friendly Version Interactive Discussion
Discussion
P
a
per
|
D
iscussion
P
a
per
|
Discussion
P
a
per
|
Discuss
ion
P
a
per
|
and van Vuuren, D. P.: Historical (1850–2000) gridded anthropogenic and biomass burn-ing emissions of reactive gases and aerosols: methodology and application, Atmos. Chem. Phys., 10, 7017–7039, doi:10.5194/acp-10-7017-2010, 2010. 27429
Law, K. and Pyle, J.: Modeling trace gas budgets in the troposphere, 1. Ozone and odd nitro-gen, J. Geophys. Res.-Atmos., 98, 18377–18400, 1993a. 27429
5
Law, K. and Pyle, J.: Modeling trace gas budgets in the troposphere, 2. CH4and CO, J.
Geo-phys. Res. Atmos., 98, 18401–18412, 1993b. 27429
Law, K. S., Plantevin, P. H., Shallcross, D. E., Rogers, H. L., Pyle, J. A., Grouhel, C.,
Thouret, V., and Marenco, A.: Evaluation of modeled O3 using measurement of ozone by
Airbus in-service aircraft (MOZAIC) data, J. Geophys. Res.-Atmos., 103, 25721–25737, 10
doi:10.1029/98JD01482, 1998. 27428
Lawrence, M. G., Butler, T. M., Steinkamp, J., Gurjar, B. R., and Lelieveld, J.: Regional pollution potentials of megacities and other major population centers, Atmos. Chem. Phys., 7, 3969– 3987, doi:10.5194/acp-7-3969-2007, 2007. 27425
Liang, J. and Jacobson, M. Z.: Effects of subgrid segregation on ozone production efficiency in
15
a chemical model, Atmos. Environ., 34, 2975–2982, 2000. 27437
Lin, X., Trainer, M., and Liu, S. C.: On the nonlinearity of the tropospheric ozone production, J. Geophys. Res. Atmos., 93, 15879–15888, doi:10.1029/JD093iD12p15879, 1988. 27425, 27437
Liu, S. C., Trainer, M., Fehsenfeld, F. C., Parrish, D. D., Williams, E. J., Fahey, D. W., 20
Hübler, G., and Murphy, P. C.: Ozone production in the rural troposphere and the implica-tions for regional and global ozone distribuimplica-tions, J. Geophys. Res.-Atmos., 92, 4191–4207, doi:10.1029/JD092iD04p04191, 1987. 27425, 27437
Lock, A. P., Brown, A. R., Bush, M. R., Martin, G. M., and Smith, R. N. B.: Boundary layer mixing scheme. Part I: Scheme description and single-column model tests, Mon. Weather 25
Rev., 128, 3187–3199, 2000. 27428
Martins, H.: Urban compaction or dispersion? An air quality modelling study, Atmos. Environ., 54, 60–72, doi:10.1016/j.atmosenv.2012.02.075, 2012. 27432
Meijer, E. W., van Velthoven, P. F. K., Wauben, W. M. F., Beck, J. P., and Velders, G. J. M.:
The effects of the conversion of nitrogen oxides in aircraft exhaust plumes in global models,
30
Geophys. Res. Lett., 24, 3013–3016, doi:10.1029/97GL53156, 1997. 27426
ACPD
13, 27423–27458, 2013Modelling ozone extremes: the importance of
resolution
Z. S. Stock et al.
Title Page
Abstract Introduction
Conclusions References
Tables Figures
◭ ◮
◭ ◮
Back Close
Full Screen / Esc
Printer-friendly Version Interactive Discussion
Discussion
P
a
per
|
D
iscussion
P
a
per
|
Discussion
P
a
per
|
Discuss
ion
P
a
per
|
Monks, P. S., Granier, C., Fuzzi, S., Stohl, A., Williams, M. L., Akimoto, H., Amann, M., Bak-lanov, A., Baltensperger, U., Bey, I., Blake, N., Blake, R. S., Carslaw, K., Cooper, O. R., Dentener, F., Fowler, D., Fragkou, E., Frost, G. J., Generoso, S., Ginoux, P., Grewe, V., Guenther, A., Hansson, H. C., Henne, S., Hjorth, J., Hofzumahaus, A., Huntrieser, H., Isaksen, I. S. A., Jenkin, M. E., Kaiser, J., Kanakidou, M., Klimont, Z., Kulmala, M., 5
Laj, P., Lawrence, M. G., Lee, J. D., Liousse, C., Maione, M., McFiggans, G., Met-zger, A., Mieville, A., Moussiopoulos, N., Orlando, J. J., O’Dowd, C. D., Palmer, P. I., Par-rish, D. D., Petzold, A., Platt, U., Poschl, U., Prevot, A. S. H., Reeves, C. E., Reimann, S., Rudich, Y., Sellegri, K., Steinbrecher, R., Simpson, D., ten Brink, H., Theloke, J., van der Werf, G. R., Vautard, R., Vestreng, V., Vlachokostas, C., and von Glasow, R.: Atmospheric 10
composition change – global and regional air quality, Atmos. Environ., 43, 5268–5350, doi:10.1016/j.atmosenv.2009.08.021, 2009. 27425
Neu, J. L., Prather, M. J., and Penner, J. E.: Global atmospheric chemistry: integrating over fractional cloud cover, J. Geophys. Res.-Atmos., 112, D11306, doi:10.1029/2006JD008007, 2007. 27428
15
O’Connor, F. M., Johnson, C. E., Morgenstern, O., Abraham, N. L., Braesicke, P., Dalvi, M., Folberth, G. A., Sanderson, M. G., Telford, P. J., Young, P. J., Zeng, G., Collins, W. J., and Pyle, J. A.: Evaluation of the new UKCA climate-composition model – Part 2: The Tropo-sphere, Geosci. Model Dev. Discuss., 6, 1743–1857, doi:10.5194/gmdd-6-1743-2013, 2013. 27427, 27428, 27429
20
Olivier, J., Peters, J., Granier, C., Petron, G., Muller, J., and Wallens, S.: Present and future sur-face emissions of atmospheric compounds, POET Report 2, EU project EVK2-1999-00011, 2003. 27429
Parrish, D., Singh, H., Molina, L., and Madronich, S.: Air quality progress in North American megacities: a review, Atmos. Environ., 45, 7015–7025, 2011. 27425
25
Parrish, D. D., Law, K. S., Staehelin, J., Derwent, R., Cooper, O. R., Tanimoto, H., Volz-Thomas, A., Gilge, S., Scheel, H.-E., Steinbacher, M., and Chan, E.: Long-term changes in lower tropospheric baseline ozone concentrations at northern mid-latitudes, Atmos. Chem. Phys., 12, 11485–11504, doi:10.5194/acp-12-11485-2012, 2012. 27425
Pöschl, U., von Kuhlmann, R., Poisson, N., and Crutzen, P.: Development and intercomparison 30
ACPD
13, 27423–27458, 2013Modelling ozone extremes: the importance of
resolution
Z. S. Stock et al.
Title Page
Abstract Introduction
Conclusions References
Tables Figures
◭ ◮
◭ ◮
Back Close
Full Screen / Esc
Printer-friendly Version Interactive Discussion
Discussion
P
a
per
|
D
iscussion
P
a
per
|
Discussion
P
a
per
|
Discuss
ion
P
a
per
|
Pyle, J. and Zavody, A.: The modeling problems associated with spatial averaging, Q. J. Roy. Meteor. Soc., 116, 753–766, 1990. 27426
Riahi, K., Rao, S., Krey, V., Cho, C., Chirkov, V., Fischer, G., Kindermann, G., Nakicenovic, N., and Rafaj, P.: RCP 8.5 – a scenario of comparatively high greenhouse gas emissions, Cli-matic Change, 109, 33–57, doi:10.1007/s10584-011-0149-y, 2011. 27429
5
Sillman, S.: The use of NOy, H2O2, and HNO3 as indicators for ozone-NOx
-hydrocarbon sensitivity in urban locations, J. Geophys. Res.-Atmos., 100, 14175–14188, doi:10.1029/94JD02953, 1995. 27425, 27436
Sillman, S.: The relation between ozone, NOx and hydrocarbons in urban and polluted rural
environments, Atmos. Environ., 33, 1821–1845, 1999. 27425, 27436 10
Sillman, S., Logan, J., and Wofsy, S.: A regional scale-model for ozone in the United-States with subgrid representation of urban and power-plant plumes, J. Geophys. Res.-Atmos., 95, 5731–5748, doi:10.1029/JD095iD05p05731, 1990. 27425, 27426, 27437
Stevenson, D. S., Dentener, F. J., Schultz, M. G., Ellingsen, K., van Noije, T. P. C., Wild, O., Zeng, G., Amann, M., Atherton, C. S., Bell, N., Bergmann, D. J., Bey, I., Butler, T., Co-15
fala, J., Collins, W. J., Derwent, R. G., Doherty, R. M., Drevet, J., Eskes, H. J., Fiore, A. M., Gauss, M., Hauglustaine, D. A., Horowitz, L. W., Isaksen, I. S. A., Krol, M. C., Lamarque, J. F., Lawrence, M. G., Montanaro, V., Muller, J. F., Pitari, G., Prather, M. J., Pyle, J. A., Rast, S., Rodriguez, J. M., Sanderson, M. G., Savage, N. H., Shindell, D. T., Strahan, S. E., Sudo, K., and Szopa, S.: Multimodel ensemble simulations of present-day and near-future tropospheric 20
ozone, J. Geophys. Res.-Atmos., 111, D08301, doi:10.1029/2005JD006338, 2006. 27430 Stock, Z. S., Russo, M. R., Butler, T. M., Archibald, A. T., Lawrence, M. G., Telford, P. J.,
Abra-ham, N. L., and Pyle, J. A.: Modelling the impact of megacities on local, regional and global tropospheric ozone and the deposition of nitrogen species, Atmos. Chem. Phys. Discuss., 13, 17675–17715, doi:10.5194/acpd-13-17675-2013, 2013. 27425
25
Tang, Y.: A case study of nesting simulation for the Southern Oxidants Study 1999 at Nashville, Atmos. Environ., 36, 1691–1705, 2002. 27426
Telford, P. J., Braesicke, P., Morgenstern, O., and Pyle, J. A.: Technical Note: Description and assessment of a nudged version of the new dynamics Unified Model, Atmos. Chem. Phys., 8, 1701–1712, doi:10.5194/acp-8-1701-2008, 2008. 27428
30
Telford, P. J., Lathière, J., Abraham, N. L., Archibald, A. T., Braesicke, P., Johnson, C. E., Mor-genstern, O., O’Connor, F. M., Pike, R. C., Wild, O., Young, P. J., Beerling, D. J., Hewitt, C. N.,
ACPD
13, 27423–27458, 2013Modelling ozone extremes: the importance of
resolution
Z. S. Stock et al.
Title Page
Abstract Introduction
Conclusions References
Tables Figures
◭ ◮
◭ ◮
Back Close
Full Screen / Esc
Printer-friendly Version Interactive Discussion
Discussion
P
a
per
|
D
iscussion
P
a
per
|
Discussion
P
a
per
|
Discuss
ion
P
a
per
|
of Mount Pinatubo, Atmos. Chem. Phys., 10, 7117–7125, doi:10.5194/acp-10-7117-2010, 2010. 27427, 27428
Telford, P. J., Abraham, N. L., Archibald, A. T., Braesicke, P., Dalvi, M., Morgenstern, O., O’Connor, F. M., Richards, N. A. D., and Pyle, J. A.: Implementation of the Fast-JX Photoly-sis scheme (v6.4) into the UKCA component of the MetUM chemistry-climate model (v7.3), 5
Geosci. Model Dev., 6, 161–177, doi:10.5194/gmd-6-161-2013, 2013. 27428
Thuburn, J. and Tan, D.: A parameterization of mixdown time for atmospheric chemicals, J. Geophys. Res., 102, 13037–13049, doi:10.1029/97JD00408, 1997. 27426
Tie, X., Brasseur, G., and Ying, Z.: Impact of model resolution on chemical ozone formation in Mexico City: application of the WRF-Chem model, Atmos. Chem. Phys., 10, 8983–8995, 10
doi:10.5194/acp-10-8983-2010, 2010. 27426
van der Werf, G. R., Randerson, J. T., Giglio, L., Collatz, G. J., Mu, M., Kasibhatla, P. S., Mor-ton, D. C., DeFries, R. S., Jin, Y., and van Leeuwen, T. T.: Global fire emissions and the contribution of deforestation, savanna, forest, agricultural, and peat fires (1997–2009), At-mos. Chem. Phys., 10, 11707–11735, doi:10.5194/acp-10-11707-2010, 2010. 27429 15
Vingarzan, R.: A review of surface ozone background levels and trends, Atmos. Environ., 38, 3431–3442, doi:10.1016/j.atmosenv.2004.03.030, 2004. 27425
Walters, D. N., Best, M. J., Bushell, A. C., Copsey, D., Edwards, J. M., Falloon, P. D., Har-ris, C. M., Lock, A. P., Manners, J. C., Morcrette, C. J., Roberts, M. J., Stratton, R. A., Web-ster, S., Wilkinson, J. M., Willett, M. R., Boutle, I. A., Earnshaw, P. D., Hill, P. G., MacLach-20
lan, C., Martin, G. M., Moufouma-Okia, W., Palmer, M. D., Petch, J. C., Rooney, G. G.,
Scaife, A. A., and Williams, K. D.: The Met Office Unified Model Global Atmosphere
3.0/3.1 and JULES Global Land 3.0/3.1 configurations, Geosci. Model Dev., 4, 919–941, doi:10.5194/gmd-4-919-2011, 2011. 27428
West, J. J., Naik, V., Horowitz, L. W., and Fiore, A. M.: Effect of regional precursor emission
25
controls on long-range ozone transport – Part 1: Short-term changes in ozone air quality, Atmos. Chem. Phys., 9, 6077–6093, doi:10.5194/acp-9-6077-2009, 2009. 27425
Wild, O. and Akimoto, H.: Intercontinental transport of ozone and its precursors in a three-dimensional global CTM, J. Geophys. Res.-Atmos., 106, 27729–27744, 2001. 27425 Wild, O. and Prather, M.: Global tropospheric ozone modeling: Quantifying errors due to 30
ACPD
13, 27423–27458, 2013Modelling ozone extremes: the importance of
resolution
Z. S. Stock et al.
Title Page
Abstract Introduction
Conclusions References
Tables Figures
◭ ◮
◭ ◮
Back Close
Full Screen / Esc
Printer-friendly Version Interactive Discussion
Discussion
P
a
per
|
D
iscussion
P
a
per
|
Discussion
P
a
per
|
Discuss
ion
P
a
per
|
Yoshitomi, M., Wild, O., and Akimoto, H.: Contributions of regional and intercontinental transport to surface ozone in the Tokyo area, Atmos. Chem. Phys., 11, 7583–7599, doi:10.5194/acp-11-7583-2011, 2011. 27426
Zeng, G. and Pyle, J.: Changes in tropospheric ozone between 2000 and 2100 modeled in a chemistry-climate model, Geophys. Res. Lett., 30, 1392, doi:10.1029/2002GL016708, 2003. 5