Abstract—Optimization of engine mounts has been performed in several studies; some of them investigated single mount model, some studied mounted engine model, and others discussed on full-vehicle model. The goal of this study is to determine which model is more appropriate for the optimization of Hydraulic Engine Mounts (HEMs). A full-vehicle model is difficult to be modeled, and simulation of the model is time consuming. On the other hand, a simple model cannot express the exact behavior of vehicle system and the optimization may not result in the desired performance of the vehicle; thus, it is desired to optimize the engine mount in the simplest model capable of achieving approximately the best performance. In this study, hydraulic engine mounts are optimized to improve the vehicle ride comfort using a global optimization method called Directed Tabu Search (DTS) method. A full-vehicle model is used to evaluate the optimization results, and to determine whether it is enough to optimize the HEMs in the simplified models to achieve the desired performance, or it is required to precede the optimization for the vehicle model or even a more intricate model.
Index Terms—Optimization, Directed Tabu Search (DTS), Hydraulic Engine Mount (HEM), Full-Vehicle Model.
I. INTRODUCTION
The main role of engine mounting system as one of the principal vehicle vibration isolating systems, besides suspension system, is to reduce the Noise, Vibration and Harshness (NVH) perceived by driver and to improve the ride comfort. The main vehicle NVH sources are low frequency road roughness and high frequency engine force. Thus, engine mounts should be capable of adequate isolation in a wide range of frequency. Almost constant stiffness and damping of rubber engine mounts with respect to frequency, leaded vehicle industries to develop Hydraulic Engine Mounts (HEMs). A HEM equipped with inertia track and decoupler performs a desirable performance in a wide range of frequency [1]. The unfavorable high stiffness in fluid resonance frequency motivated the development of bell plate. Equipping the HEM with bell plate provides a good performance in all working frequencies [2]. A better performance will be achieved if an appropriate HEM is
* Manuscript received March 6, 2011
Abdolreza Ohadi is with Department of Mechanical Engineering, Amirkabir University of Technology, No.424, Hafez Ave., Tehran, Iran (corresponding author to provide phone: 6454-3484; fax: +98-21-6454-3484; e-mail: [email protected]).
Yadollah Rasekhipour is withDepartment of Mechanical Engineering, Amirkabir University of Technology, No.424, Hafez Ave., Tehran, Iran (e-mail: [email protected]).
provided by executing an optimization process.
Optimization based on modal analysis has been performed in several studies for rubber engine mounts [3]-[5]. But there is no guarantee that the system designed to decouple modes exhibits the best performance, e.g. the system will have a better ride comfort performance if the optimization objective is ride comfort than if it is to decouple system modes.
In some studies [6]-[8], optimization of HEM has been performed using a model of a single mount (a model of a 1DOF-body supported on a HEM). Some other optimization investigations on rubber mounts have been preceded for an engine model mounted on their mounts [9], whereas some studies have been performed for full-vehicle models [10], [11]. Although several kinds of models- a simple single engine mount model to an intricate vehicle model- have been used for optimization procedure, but it is not known whether it is required to optimize the engine mounts in an intricate full-vehicle model or some simpler models can be adequate for the optimization. The main goal of the current study is to find the answer of the above mentioned question.
The system of interest in this study is a vehicle system whose engine is mounted to the chassis via three HEMs. It is desired to improve the ride comfort, and the vertical acceleration of the driver position is used as the ride comfort index. A 13DOF model (Fig. 1(a)) called model No. 1 is used as the reference model of the system. Two simpler models are also investigated. An appropriate simplified model for optimization of the HEMs is a 6DOF engine mounted to the ground via three HEMs (Fig. 1(b)) called model No. 2. Besides, a simplification in model No. 2 results in a 1DOF body which is mounted to the ground via one HEM (Fig. 1(c)) called model No. 3. Optimization is performed for these three models, and for each model, the optimized parameters of the HEM(s) are obtained. The resulted optimized parameters are used in the reference full vehicle model. The ride comfort indexes of the three resultant reference models are compared to clarify whether optimization in model No. 2 or model No. 3 can result in a favorable performance, or the optimization have to be performed for the model No. 1.
In this study, a global optimization method called Directed Tabu Search (DTS) method is used, which is the result of combining Tabu Search (TS) method with direct search methods [12]. Memory structures are the main elements of a TS methodwhich improve the performance of the method by avoiding searching visited regions. It causes the method to search more regions with equal number of function evaluations that makes DTS advantageous over
Optimization of Hydraulic Engine Mounts
through Simplified and Full Vehicle models
other global optimization methods.
The structure of the paper is as follows. Initially the mathematical model for each model is obtained. Next, a study on HEM parameters is performed to determine the most effective parameters to be used as design parameters in optimization. Then, DTS method is explained and objective functions and constraints of the optimization are determined. Finally, optimization results are expressed, the corresponding results are substituted in the reference model, and comparison between three models is done.
(a)
(b) (c)
Figure 1: Optimization models, (a) Model No. 1 - 13 DOF full-vehicle (reference model), (b) Model No. 2 - 6DOF engine mounted to the ground via three HEMs, (c) Model No. 3 - 1DOF engine supported on
a HEM.
II. MATHEMATICAL MODELS
A. Mathematical Model of HEM
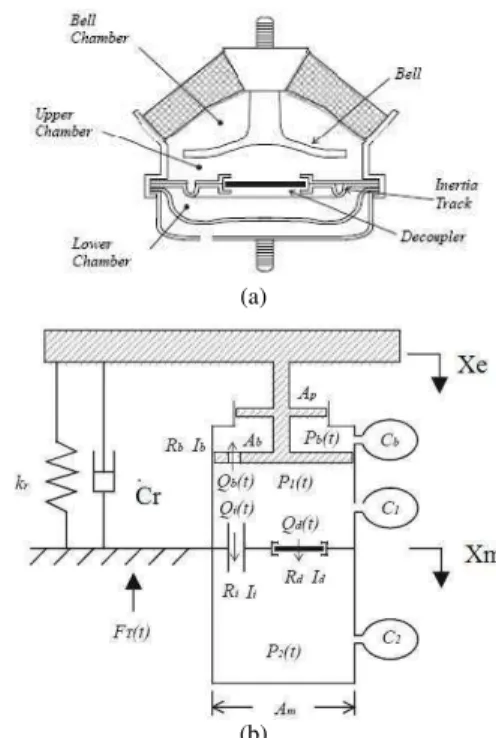
The HEM of interest is structurally similar to the conventional HEM except that a bell plate is added to it. The improvement in the behavior of conventional HEM by supplementing bell plate to it is studied by Ohadi and Fakhari [2]. Cross Section and lumped parameter system model of the HEM are illustrated in Fig. 2 [1]. As demonstrated in Fig. 2(b), the HEM contains three chambers: bell chamber, upper chamber, and lower chamber, and three passages: inertia track, decoupler, and bell plate.
Excitation causes relative motion of the two ends of the HEM; thus pressure varies in the chambers which motivates the fluid to flow through the three passages. The fluid passing the inertia track, which is a long narrow passage, causes a high damping. But in high frequency behavior, low damping is required which motivated the creation of the
decoupler [1]. In high frequencies, the decoupler disk, which lies on one of its limits and blocks the decoupler passage in low frequencies, stands in the middle, and the pressure difference between the upper and lower chambers causes the fluid to flow through the decoupler –which is a short wide passage- instead of the inertia track. Undesirable behavior due to resonance of the containing fluid, which causes high stiffness in fluid resonance frequency, motivated the development of bell plate.
(a)
(b)
Figure 2: (a) Cross section of HEM, (b) Lumped parameter system model of HEM [13].
Continuity equations for the three chambers are:
=− (−−) (1)
= (−)−−− (2)
=+ (3)
in which , ଵ and ଶ are the compliances of bell
chamber, upper chamber and lower chamber, respectively.
, ଵ and ଶ represent the pressure of bell chamber, upper
chamber and lower chamber and , and ௗ are the
flow passing through bell passage, inertia track and decoupler, respectively. is the area of bell plate,
represent effective pumping area, is the area of the
HEM, and is the displacement of the upper end of the
HEM. Momentum equations for inertia track, decoupler and bell plate, respectively, are:
−=+ (+||) (4)
−=+ (+||+
బ
బ)
(5)
−=+ (++)(+) (6)
in which represents the inertia of each passage, and ′
and turbulent flow, and , and indices represent the inertia track, decoupler, and bell passage. First, second and third terms on the right side of (4)-(6) demonstrate momentum resulting by fluid inertia, resistance due to laminar flow, and resistance due to turbulent flow, respectively. The last terms on the right side of (5) represents the additional resistance created by decoupler disk when it approaches any of its limits [1].
Transmitted force to the base of the HEM is:
=++−−++
+||−−
(7)
in which and are the stiffness and damping of rubber
part of the mount, respectively, and ௗି is the
equivalent decoupler area defined in order to express the transmitted force in a continuous equation for both occasions when the decoupler disk blocks the passage and when it does not [1]:
=
− arctan మ
ഏ(
ುభషುమ
ುబ )షೌೣ
భ
(8)
Moreover, the force acting on the upper end of the HEM differs from the transmitted force to the base:
=++−+−− (9)
Equations acting on model No. 3 (Fig. 1(c)) are the same as Eqs. (1)-(9) except that because of the mass placed on the upper end of the mount, Eq. (9) changes to:
=+++−+−
−
(10)
in which is the excitation force exerted to the mass. B. Mathematical Model of Vehicle
Reference model of vehicle investigated in this study consists of an engine body mounted to vehicle body, and four wheel bodies jointed to the vehicle body via suspension system, as demonstrated in Fig. 1(a). In this system, engine is modeled as a 6DOF rigid body, mounting to the vehicle body via three similar inclined HEMs. The engine roll axis can coincide with mount elastic axis, if HEMs lie in an appropriate inclined manner, which decouples roll engine mode from other engine modes, and reduces vibration amplitude [5]. Vehicle body and chassis are modeled as a unified body capable to move in bounce, roll and pitch modes. Four wheels are connected to it via suspension system; each is assumed as a rigid body travels in vertical direction and is connected to the ground through the tire. Suspension system and tires are modeled as linear springs and dampers.
A V-shape four-cylinder engine is studied whose engine force arises from the motion of engine inner bodies including piston, conrod, crankshaft, and balancing system. The engine force acting on the engine body is the only source of excitation. The forces and torques acting on the engine can be expressed in the format [2]:
⋮=sin+ωcos+ωcos 2 (11)
in which = 1,2,3 are determined for each torque or
force component. Newton’s second law results in the following equations for the wheels:
= +!"−#" −+$+
!"−#" −− !−! %= 1, … ,4
(12)
in which ௨ and ௨ represent i-th unsprung mass and its
vertical displacement, respectively, ௦ and ௦ are i-th
suspension stiffness and damping, , ௧ indicates the i-th tire
stiffness, ௦,௦௬ and ௦௭ are bounce, roll, and pitch motions
of vehicle body, respectively, ௧ is the vertical displacement
of the lower end of the tire that represents the road disturbance and is assumed to be zero in this study. Also,
௦ and ௦ represent the position of each suspension from
vehicle coordinate located on center of mass of vehicle body. Vehicle body motion originates from the forces transmitted from suspension system and mounting system:
=∑ # "+∑ $# " (13)
"=∑ # "!− +∑ $# "! (14)
" =∑ # −"#+ ∑$#(−"#) (15)
in which ௦,௦௬ and ௦௭ are the mass of the vehicle body
and momentum of inertia of it in y- and z-directions, respectively,
ᇱ ,
ᇱ , and
ᇱ
represent the position of each mount in vehicle body coordinate, and ௦௫ is the force
transmitted to vehicle body from suspension system:
"= − +!"−#" −−$+
!"−#" −
(16)
Inclined HEMs lie in x-y plane, and are oriented at angle related to y-axis. Therefore, ௦, which is the force
transmitted from engine mounts, can be formulated as follows:
"= "+$"+−−
+++||sin' (17)
=+!"−#" − +!′ "−#′ "
(18)
= (+$(+−−
+++||cos' (19)
(=#+" −!""−′ " (20)
= )+$ ) (21)
)=!+#""−"+′ " (22)
in which ௫,௬,௭,௫,௬, and ௭ represent the
stiffness and damping of each mount in x-, y-, and z-direction, respectively, ,, and are the relative
displacement of each mount in each direction,
of engine body in each direction, and represent the position of each mount coordinate, which is located on center o body. Engine body motion is caused by from engine mounts () and engine
(ா, ா):
* + ∑ # ", "
#* + ∑ # ,
!* + ∑ # ,
"""* + "" + ∑ # #+ ! , "
"* + "" ""+ ∑ # "!+
,
" * "+ """+ ∑ # "# ,
in which , ௫, ௬, and ௭ are the mass o
and momentum of inertia of it in ea mentioned in the previous section, the from the mount to the vehicle body (௦
the force exerted to the mount by engine (
"* + ", $" , .+
+ + / sin '
* + (, $( , .+
+ + / cos '
* + ), $ )
The equations acting on model No. 2 ( achieved from Eqs. (23)-(31) while the d rotations of the vehicle body in Eqs. (18) zero.
III. PARAMETER STUDY
In an optimization process, first of all, which are the most effective parameters, m In this study, it is desired to optimize H improve the vibration behavior of vehicle. study is performed to determine the parameters of the HEM on vibration behav Several researchers have investiga parameters through sensitivity analysis [3 goes through a direct way to do so. T performed by varying each parameter wh unchanged, and plotting vibration behavior three different amounts of the parameter value, half of it, and double of it). T illustrates how the vibration behavior parameter changes; so, by studying parameters of the HEM and a brief look most effective parameter can be specified.
d , , and
nt in engine body r of mass of engine by force transmitted ine excitation force
(23) (24) (25)
+ (26)
+ (27)
+ (28)
ss of the engine body each direction. As e force transmitted
௦) is different from
):
,
(29)
,
(30)
(31)
2 (Fig. 1(b)) can be e displacements and ), (20) and (22) are
Y
ll, design parameters s, must be specified. HEMs in order to le. Thus, a parameter the most effective
avior of vehicle. igated the design
[3], [4]. This paper . The procedure is while others remain ior of the system for ter [6] (the original . The plots clearly ior alters as each ng all changeable ok at the plots, the d.
HEM parameters including , , and are studie
parameters. As a sample, Fig. 3 effective parameters on driver range of 0-5000 rpm of engin value of parameters, the sim different amounts of engine ro value of the driver position condition is determined to con from the figures that these param on vibration behavior of t parameters are chosen to be ,
(a)
(b) Figure 3: Effect of two design paramet
(a) rubber stiffness, (b) upp
IV. OPTIMIZAT
A. Optimization method The optimization method e Directed Tabu Search (DTS) version of Tabu Search (TS) m method benefiting memory el visited regions, and DTS is the some direct search methods suc (APS) method. DTS is a global performs local search from plen one, in which the best point optimized points is the global op Three search procedures are Diversification, and Intensific search, local search is perfo strategy to lead the search, elements called Tabu List (TL Semi-TRs to prevent cycling. generates new trial points to be
, , ଵ, ଶ, , , ௗ, ௗ,
died to determine the design . 3 shows the influence of two er position acceleration in the gine rotating speed. For each simulation is performed for rotating speed, and the peak n acceleration at steady state construct the plots. It is clear rameters have a great influence the system. Thus, design
, ଵ, , and .
a)
b)
eters on driver position acceleration: pper chamber compliance.
ATION PROCESS
executing in this study is ) method being a developed method. TS is an optimization elements to avoid searching he result of combining TS with uch as Adaptive Pattern Search bal optimization method which lenty of initial points instead of int among the resultant local
optimized point.
exploration search. It benefits another memory element called Visited Regions List (VRL) to diversify the search from the visited points. Eventually, the intensification search performs local searches from the best points arisen from previous search procedures, to intensify the answer.
The main loop of DTS consists of exploration and diversification searches. It starts from an initial point x0, and exploration procedure starts from this initial point in a loop called inner loop. After the inner loop is accomplished, diversification search generates another point to be used as initial point of the inner loop in the next main loop iteration.
In the exploration search, memory elements including TL, TRs, and Semi-TRs are introduced to prevent searching in neighborhood of visited points in order to avoid cycling. The most recent points and the best points resulting from exploration search are stored in TL. TRs are defined to be regions around each point of TL with radius rTR, and Semi-TRs are defined to be surrounding regions around Semi-TRs with radius rSTR > rTR. Thus, if the trial points do not enter TRs, exploration search has avoided cycling. So, if the current point is in Semi-TRs, the direction of generating trial points will be outward from the center of Semi-TRs. Otherwise trial points are generated in a random direction along each axis. In the both abovementioned procedures, if one of the trial points is better than the current point, it is chosen as the resultant point and this iteration of the inner loop is accomplished, otherwise local points are generated employing APS to determine the resultant point of this inner loop iteration. Simply said, TL, TRs, and Semi-TRs exclude the visited regions from the search area, and the search is directed to the local optimized point by APS. The resultant point is added to TL and VRL, and is used as initial point for the next inner loop iteration.
The inner loop is terminated after linner iterations, and then the diversification search is executed. It introduces a memory element called VRL to diversify the search. VRL is defined to be a spherical region around each resultant point. The center of sphere as well as frequency of visiting the point is stored in VRL. In the diversification search a random trial point is generated; if it is not in the neighborhood of visited regions, it will be the resultant point of the diversification.
The main loop is terminated after lmain iterations have been performed. Assuming that the procedure has searched the entire optimization region, the best points of TL can make the best local optimized points if the intensification search is performed for them. Thus, in the intensification search, some local optimization processes are performed whose initial values are the best points of TL. The best point among the local optimized points is the global optimized point.
B. Objective function
One of the main indexes of an appropriate vehicle is its ride comfort. In this study the vertical acceleration of the driver position is chosen as the ride comfort index, and the objective of this study is to reduce it. HEM in the three models is optimized and the resultant HEMs of each model are replaced the original HEM in the reference model. Ride comfort index of the three resultant reference models are evaluated to determine whether simplified models are
capable to optimize the HEMs for vehicle or optimization is required to be executed for more intricate models. The objective of model No. 1 is minimizing the driver position acceleration. For the two other models, the objective has to be chosen such that the resultant HEMs can afford the objective of the reference model (which is identical with model No. 1). Since transmitted force to the chassis is the source of vibration of the chassis, the objective of the two models No. 2 and 3 is selected to be the transmitted force to the ground. In all three models, the objective function is the least mean squares of the mentioned objectives in the frequency range of 0-200Hz. Besides, the excitation of the system has to be modeled appropriately so that the optimization results in proper HEMs for the vehicle. For models No. 1and 2 it is the engine force acting on engine [2], and for model No. 3 it is chosen to be one third of vertical component of engine force acting on the mounted mass. The engine rotating speed (the frequency of the excitation force) sweeps in time from 1000 to 5000 rpm in the simulation of the models.
The designer cannot assign any desired amount to the design parameters. Thus, constraints which must be held on design parameters and their limits have to be specified. As the length and area of the inertia track can vary independently, and can alter independently; but the
length and the area cannot get any amount.ଵ and can
alter by changing the chambers walls materials. Similarly, they cannot take any value, because of the limitations in materials. changes by changing the shape and material of the rubber part of the mount, and should have limited values. In this study, it is assumed that all design parameters can vary in the range of half of their original value to double of it in the optimization. The design parameters used in DTS are the ratio of the design parameter to their original values to be non-dimensional.
V. RESULTS
In this study, it is desired to determine whether it is required to precede the optimization for an intricate model of vehicle to achieve desired ride comfort performance or it is enough to optimize the HEMs in a simple model. A 13DOF model is used as the reference model (model No. 1), and is simplified twice to constitute two other models (Fig. 1). A procedure is performed for each of the three models; the optimized HEMs of the model is obtained via DTS, and the original HEMs in the reference model are replaced by this HEMs to create three resultant reference models, then vertical acceleration of the driver position- as the ride comfort index- of each resultant reference model is evaluated to determine which model is more appropriate to be used for optimization.
The distance between every two points as follows:
%&'ଵ( ' ଶ) ଶ
* &+ଵଵ( +ଵଶ) ଶ
* &,భ( ,మ) ଶ
* &-భ( -మ) ଶ
* & 0.2
Since the design parameters are the non can be added to each other. DTS makes it best points from distinct regions, since i design area for local optimized points and points in every region while other glo methods do not obtain the best points of e the simplified models are structurally diffe vehicle system, and acceleration and force the reference model and simplified models different in nature, the global optimiz simplified models do not coincide the point of the reference model, and even undesirable response in reference model points of a simplified model exhibit a des resultant system (resulting from replac HEMs of the reference model by optim simplified model robustly performs well, used instead of the reference model in process. Thus the average of the five be simplified system tabulated in table 1 is us effectiveness of optimization of the simplif
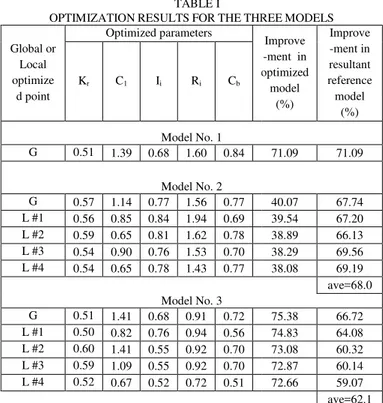
TABLE I OPTIMIZATIONRESULTSFORTHETHR
Global or Local optimize d point Optimized parameters o Kr C1 Ii Ri Cb
Model No. 1 G 0.51 1.39 0.68 1.60 0.84
Model No. 2 G 0.57 1.14 0.77 1.56 0.77 L #1 0.56 0.85 0.84 1.94 0.69 L #2 0.59 0.65 0.81 1.62 0.78 L #3 0.54 0.90 0.76 1.53 0.70 L #4 0.54 0.65 0.78 1.43 0.77
Model No. 3 G 0.51 1.41 0.68 0.91 0.72 L #1 0.50 0.82 0.76 0.94 0.56 L #2 0.60 1.41 0.55 0.92 0.70 L #3 0.59 1.09 0.55 0.92 0.70 L #4 0.52 0.67 0.52 0.72 0.51
For each point, the percentage of imp objective function of the model that the from optimization of it, and the percentag in the objective function of the resultant re shown in the last two columns of the t values are determined with respect to the objective functions. Moreover, the first whether the point is global optimized p optimized one (L).
ts can be calculated
&+భ( +మ) ଶ
1 (32)
nondimensional they s it possible to select e it searches all the nd provides the best global optimization f each region. Since ifferent form the full rce- the objectives of els, respectively- are ized point of the e global optimized en may exhibit an del. But if the best esirable response in lacing the original timized HEMs), the ll, and can be safely in the optimization best points of each used as the index of plified model.
HREEMODELS
Improve -ment in optimized model (%) Improve -ment in resultant reference model (%)
71.09 71.09
40.07 67.74 39.54 67.20 38.89 66.13 38.29 69.56 38.08 69.19 ave=68.0
75.38 66.72 74.83 64.08 73.08 60.32 72.87 60.14 72.66 59.07 ave=62.1
improvement in the the point is resulted tage of improvement t reference model, is e table. All percent he original values of st column indicates point (G) or local
Table I shows 71.09% im optimization of the reference m optimization is necessary for optimized point of model N improvement in the behavior model; and the average of the best points resulted from opt 68.0%. This demonstrates tha system parameters may result which will perform similar to th noticeable that the point L#3 m the resultant model in compar point, which is because of reference model and model No for model No. 3 shows that performs 66.72% improvemen resultant reference model, and th the system exhibit an average im Obtained results indicate tha reference model (model No. 1) No. 2 with an insignifican improvement. Moreover, if m optimization, an average loss improvement of the system, w loss is because of the different s the reference model; but since t of the engine mass and the exci one third of the vertical compo model No. 3, the model can som of the intricate reference model acceptable.
The vibration behavior of th from global optimized point of the original reference mode demonstrate the improved beh optimization of each model. Bu plots that though the objective reference model of global opt models are so close (as tab maximum values of the drive transmitted force to the chass indicates that different objective global optimized points e.g. if driver position acceleration in speed is used as the objective f will be different.
Figure 4: Driver point acceleration vers systems in comparison
improvement resulting from model demonstrating that the r the system. Besides, global No. 2 results in 67.74% or of the resultant reference e improvement due to the five optimization of the model is that a small variation in the ult in another optimal point the current optimal point. It is makes a more improvement in parison with global optimized f the different structures of No. 2. The similar observation at its global optimized point ent in the behavior of the the best five optimal points of improvement of 62.1%. that, for the optimization, the
1) can be replaced by model ant loss of about 3% of model No. 3 is used for the ss of 9% will be occurred in which is also acceptable. The t structures of model No. 3 and e the mass is chosen one third xcitation force is selected to be ponent of the engine force in omehow simulate the behavior el and the results are somehow the reference model resulting of each model is compared to del in Fig. 4. Both plots ehavior of the system due to But it can be noticed from the tive functions of the resultant optimized points of the three table 1 demonstrates), their iver position acceleration and assis are widely different. It ive functions result in different if the maximum value of the in a range of engine rotating-e function throtating-e optimizrotating-ed points
VI. CONCLUSION
Ride comfort of a vehicle is desired to be improved by optimization of its HEMs in this study. A full-vehicle model (model No. 1) is a highly nonlinear model with many degrees of freedom, and if its engine is mounted by HEMs, its nonlinearity makes the simulation more intricate; so if a simplified model like an engine mounted to the ground (model No. 2), which only contains the degrees of freedom of the engine and nonlinearity of its HEMs, or a 1DOF body mounted to ground by a HEM (model No. 3) can afford the optimization and result in an acceptable performance, the optimization is preferred to be done for these simplified models.
Different structures of the models make the optimal region of the reference model different from those of the simplified models. However, if the optimal regions of a simplified model coincide with not the best but appropriate enough regions of the reference model, i.e. best local optimized points of the simplified model result in good enough behavior of resultant reference model, the optimization can be done for the simplified model instead of the reference model. The obtained results indicate that both simplified models exhibit a good performance, and can be used for optimization process instead of full-vehicle model. Model No. 2 shows an insignificant loss of 3% in improvement of optimization if it is used instead of the reference model, which makes it completely reasonable to be preferred for the optimization. Besides, model No. 3 causes a loss of 9% in the improvement of the optimization if it is used for the optimization instead of the reference model. Thus, it is rational to use model No. 3 for the optimization except that the optimization improvement is more important than optimization cost, in which case model No. 2 is to be used. As a conclusion, instead of the complex full-vehicle model which is too hard to be thoroughly modeled, a model of a 1DOF body mounted on the ground via one HEM can be used.
REFERENCES
[1] A. Geisberger, A. Khajepour, F. Golnaraghi, “Non-linear modeling of hydraulic mounts: theory and experiment,” Journal of Sound and vibration, 2002, 249(2), 371-397
[2] A. R. Ohadi, V. Fakhari, “Effect of bell plate on vibration behavior of automotive engine supported by hydraulic engine mounts,” SAE Technical Paper Series 07NVC-223
[3] T. Arai, T. Kubozuka, S. D. Gray, “Development of an angine mount optimization method using modal parameters,” SAE Technical Paper Series 932898
[4] C. Q. Liu, “A computerized optimization method of engine mounting system,” SAE Technical Paper Series 2003-01-1461
[5] J. S. Sui, C. Hoppe, J. Hirshey, “Powertrain mounting design principles to achieve optimum vibration isolation with demonstration tools,” SAE Technical Paper Series 2003-01-1476
[6] Y. K. Ahn, J. D. Song, B. S. Yang, “Optimal design of engine mount using an artificial life algorithm,” Journal of Sound and Vibration
261, 2003, 309–328
[7] Q. Li, J. C. Zhao, B. Zhao, X. S. Zhu, “Parameter optimization of a hydraulic engine mount based on a genetic neural network,” Proc. IMechE Vol. 223 Part D: J. Automobile Engineering, 2009
[8] B. H. Lee, C. W. Lee, “Optimal design of electromagnetic type active control engine mount in consideration of actuator efficiency,” SAE Technical Paper Series 2007-01-2424
[9] W. Yuan, X. Wang, S. Han, “Optimal mount selection with scattered and bundled stiffness rates,” SAE Technical Paper Series 2006-01-0736
[10] T. Wang, F. Sturla, V. C. Salazar, “Mount rate robust optimization for idle shake performance,” SAE Technical Paper Series 2004-01-1536 [11] M. S. Foumani, A. Khajepour, “Optimization of engine mount
characteristics using experimental/numerical analysis,” Journal of Vibration and Control, 9: 1121–1139, 2003
[12] A. R. Hedar, M. Fukushima, “Tabu search directed by direct search methods for nonlinear global optimization,” European Journal of Operational Research 170 (2006) 329–349
[13] A. A. Geisberger, “Hydraulic Engine Mount Modeling, Parameter Identification and Experimental Validation” Thesis for Master of Applied Science in Mechanical Engineering,University of waterloo