COMPARISON OF ROCKY INTERTIDAL COMMUNITY SAMPLING METHODS AT
THE NORTHERN COAST OF RIO DE JANEIRO STATE, BRAZIL*
Isabela Maria Macedo; Bruno Pereira Masi & Ilana Rosental Zalmon1
Universidade Estadual do Norte Fluminense (Av. Alberto Lamego, 2000, 28013-602, Campos, RJ, Brasil)
1E-mail: [email protected]
A
B S T R A C TThe purpose of this study is to compare different rocky intertidal sampling methods at the northern coast of the Rio de Janeiro State. Quadrats with 50 and 100 intersection points were sampled in field and in computer using digital photos. A similarity over 90% was obtained between both methods for the intertidal zone. Cluster analysis showed that the lower sample size overestimated some indicator organisms. The zonation pattern through photo sampling was different from that in field especially in Supralitoral Fringe due to the color similarity of Chthamalus sp with bare substrate. The main advantages of the digital method are the fast abundance estimation, the possibility of comparison among researchers and the permanent community record. However, there is a potential for species misidentification with similar color morphotypes. In zonation intertidal studies, digital photograph sampling method is suggested since it is rather efficient, accurate and advantageous in relation to the field method. Such a choice might be made after the previous knowledge of local organisms and should be adequate to the final objectives.
R
E S U M OA proposta do presente estudo é comparar diferentes métodos de amostragem da comunidade bêntica no entremarés em substrato rochoso na costa norte do Estado do Rio de Janeiro. Quadrados com 50 e 100 pontos de interseção foram amostrados no local e em computador por fotografia digital. Uma similaridade superior a 90% foi obtida entre ambos os métodos em cada altura do substrato. A análise de agrupamento evidenciou que o menor tamanho amostral superestimou alguns organismos indicadores. O padrão de zonação através da amostragem por foto foi diferente daquele no campo principalmente na Franja do Supralitoral face à similaridade de coloração de Chthamalus sp com o substrato vazio. O método por foto tem como principais vantagens a rápida estimativa de abundância, a possibilidade de comparação entre observadores e o registro permanente da comunidade. Contudo, há a possibilidade de má identificação de morfotipos de cores semelhantes e não permite a amostragem de vários estratos. Para estudos de zonação a amostragem por fotografia digital é bastante eficiente, acurada e vantajosa em relação ao método em campo. Mas, tal opção procede após o conhecimento prévio dos organismos e deve ser adequada aos objetivos finais.
Key words: Rocky intertidal, Sampling techniques, Digital photography, Field method.
Palavras chave:Costão rochoso, Região entremarés, Técnicas de amostragem, Fotografia digital,
Método em campo.
I
NTRODUCTIONUntil recently, few comparisons of methodological patterns have been made to critically evaluate their relative efficiency under real field conditions. Those reviews are valuable for researchers because they are related to the most appropriate method (e.g. accurate, precise or efficient) under a series of environmental circumstances (Southwood, 1978; Krebs, 1989).
__________
(*) Paper presented at the 2nd
Brazilian Oceanography Congress in Vitória (ES) – Brazil, October 09th
– 12th .
Underwood, 1990). In order to understand the species distribution and abundance patterns, it is supposed that the applied methods give accurate estimates of the number of organisms. The precise patterns description is then essential to understand the ecological processes (Andrew & Mapstone, 1987; Sabino & Villaça, 1999).
Sampling comparative studies in rocky shores are scarce. Foster et al. (1991), Meese & Tomich (1992) and Dethier et al. (1993) examined different sampling methods of benthic organisms (e.g. visual; photography; intersection regular points, random and stratified distribution; field and computer sampling).
In Brazil, many studies on rocky shore communities in the intertidal zone have been carried out mainly on vertical distribution patterns of the organisms and their causes, which were initially associated to physical factors such as tide levels, wave exposure and salinity (Vermeij & Porter, 1971; Sauer Machado et al., 1996; Guimaraens & Coutinho, 2000). Little attention has been given to methodological problems involving such community (Villaça, 1991; Sabino & Villaça, 1999).
There is no natural consolidating substrate, except for scarce granitic blocks and ferruginous rocks in the northern coast of Rio de Janeiro. At the same time, we observe the absence of qualitative and quantitative studies of the benthic fauna and flora in this region. The objective of this study is to compare and evaluate different sampling methods of alga and sessile invertebrates on a rocky shore in the northern coast of the Rio de Janeiro State, due to the importance of finding a sampling method which is good enough to present a relation of time and data acquisition of the studied community.
M
ATERIAL ANDM
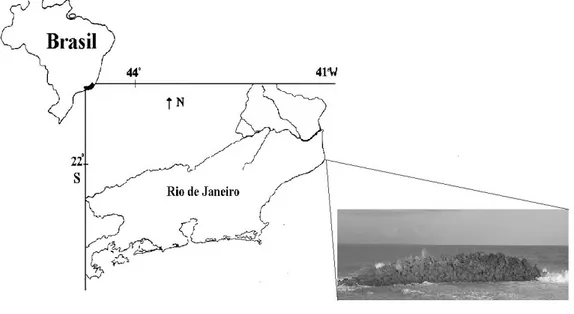
ETHODSThis study took place on the Farol de São Tomé beach (22º02'S, 41º03’W), in the northern coast of the Rio de Janeiro State (Fig. 1). The environment is an anthropogenic rocky substrate; a set of granitic boulders presenting a discontinued and irregular surface. It was carried out in the southern face, where wave action is less intense.
Fig. 1. Localization of the study area at the northern coast of Rio de Janeiro state on the Farol de São Tomé beach.
The studied site was sampled in April/2005. The chosen sampling blocks have their external faces relatively perpendicular to the sea. Four equally distant profiles (6 m), each representing a study unit, were sampled from the low tide limit (zero mark) to the
upper limit of Littorina (Supralitoral Fringe sensu
The relative dominance was estimated by the percentage of organisms’ coverage. For the qualitative and quantitative sampling a non-destructive method of intersection points was used (Sutherland, 1974; Thomas, 1985; Boaventura et al., 2002; Good, 2004) and the sessile and sedentary organisms found under each point were recorded.
The compared sampling methods were: 1) quadrats with 100 points sampled in field (100 field); 2) quadrats with 50 points sampled in field (50 field); 3) digital photographs of quadrats with 100 points sampled in computer (100 photo); 4) digital photographs with 50 points sampled in computer (50 photo).
In methods 3 and 4 a digital camera Cannon, model A510 - 3.2 Mega pixels with automatic focus was used. The software CPCe (Coral Point Count with Excel extensions) version 3.1 offers a tool to determine the percentage of organisms’ coverage using the pictures of the quadrats. It generates a number of points to be determined randomly or in grids and the organisms settled under those points are identified by codes.
The organisms sampled by the different sampling methods were evaluated through taxonomic composition, relative abundance, species richness and Brillouin’s diversity (Zar, 1984).
In order to determine the similarity rate among the sampling methods, the Renkonen’s similarity percentage coefficient was calculated in a paired form (Krebs, 1989).
The comparative analysis of the species vertical distribution by the different sampling methods included a cluster analysis (UPGMA) with Morisita modified similarity coefficient for percentage data. Cluster reliability to data was evaluated by the cophenetic coefficient. According to Valentin (2000), a cophenetic value above 0.8 is acceptable.
A one-way analysis of variance (with α = 0.05) was performed for repeated measures, to evaluate the significance of the differences among the sampling methods, since the same quadrat was sampled through the different methods. The variances homogeneity was tested and the percentage coverage data was transformed to arcsen√x%.
The average time spent on the different methods was recorded to evaluate the data obtained from each one and the sampling time.
R
ESULTSThe comparative analysis among the methods was based on species richness, cover percentage of the main species and diversity index results.
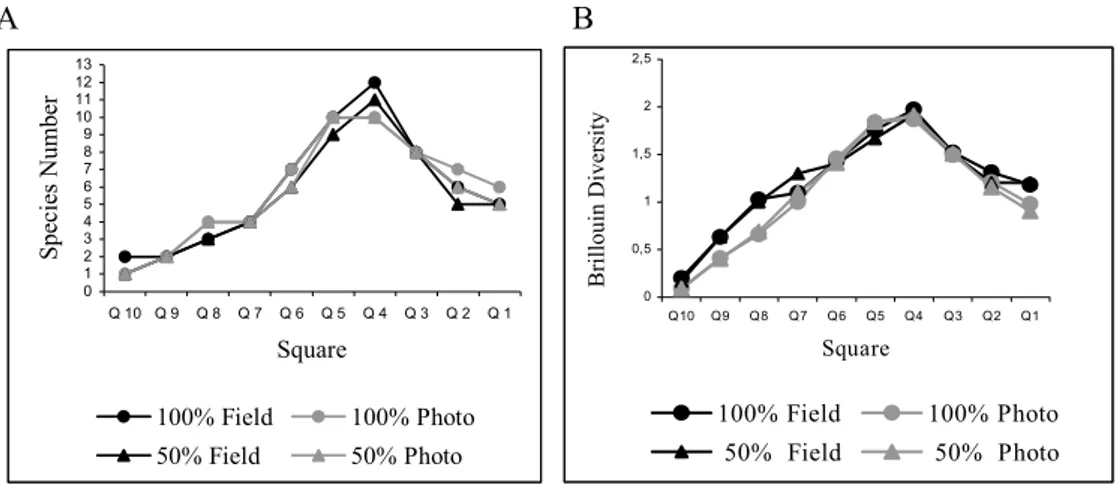
The species number at different tidal heights was similar in all sampling methods, with higher values for the intermediate zone quadrats, corresponding from 0.8 to 1.0 m heights, and lower in the extremes, mainly in the uppermost quadrats (Fig. 2A). No significant differences were recorded among the sampling methods (p = 0.105).
The diversity index varied statistically (p = 0.077) when comparing the quadrats 100 field with 50 and 100 photos (q = 3.960 and 3.996, respectively). The first one showed generally higher diversity values (Fig. 2B).
The benthic community’ similarity among the study methods was higher than 70% in all heights of the rocky substrate (Table 1). Values under 80% occurred in the comparisons between field and photo, regardless the number of sampled points, 50 or 100. Such fact occurred mostly in quadrat 08 (1.4 to 1.6m), in which the dominant species Chthamalus sp blended with the grey empty substrate by photo sampling, and in quadrat 01 (0 to 0.2m), where the macroalgae Ulva fasciata was constantly dislocated by waves and replaced in photo sampling by the polychaete
Phragmatopoma lapidosa, an abundant species in the inferior layer.
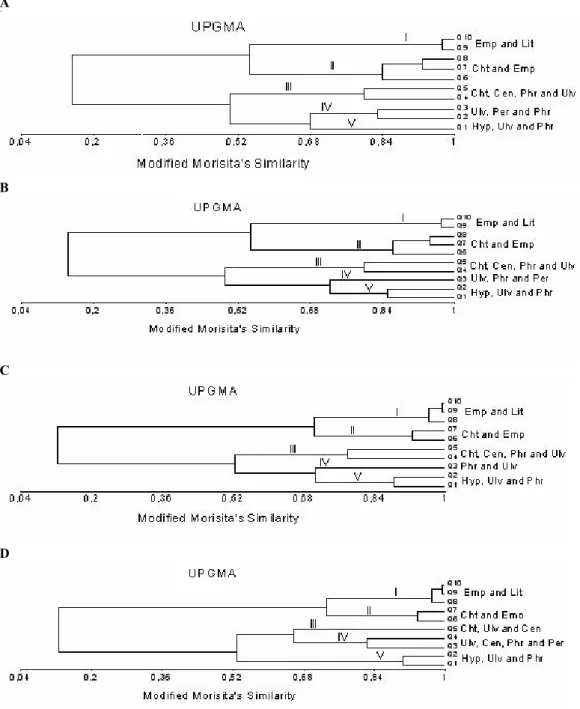
The cluster analysis of the organisms’ vertical distribution on the rocky shore reflected the similarity among the sampling methods resulting into five bands (sensu Stephenson & Stephenson, 1949; Lewis, 1964)of 60% level of similarity (Figs 3A, 3B, 3C, 3D): Supralitoral Fringe characterized by empty space and Littorina sp; Upper Midlitoral represented by Chthamalus sp and empty space; medium Midlitoral with the predominance of Chthamalus sp,
Centroceras clavulatum, Phragmatopoma lapidosa
and Ulva fasciata; lower Midlitoral characterized by
Ulva fasciata, Perna perna and Phragmatopoma lapidosa, and Infralitoral Fringe represented by
Hypnea musciformis, Ulva fasciata and
Phragmatopoma lapidosa.
The cophenetic coefficient values were: r = 0.82 (100 field), 0.84 (50 field), 0.89 (100 photo) and 0.90 (50 photo), all of them were higher than the acceptable cophenetic coefficient.
The revealed zonation pattern was different among methods mainly in Supralitoral Fringe (Fig. 3C and 3D). The first one included quadrat 08 in this zone, because of the color similarity of Chthamalus sp with empty substrate, which characterized quadrats 09 and 10. Moreover, the 50 photo method overestimated the bivalve Perna perna coverage, shortening the medium Midlitoral area (Q05) and enlarging the lower area (Q03 and Q04).
A B
0 1 2 3 4 5 6 7 8 9 10 11 12 13
Q 10 Q 9 Q 8 Q 7 Q 6 Q 5 Q 4 Q 3 Q 2 Q 1
Square
Sp
ecies Nu
mb
er
100% Field 100% Photo
50% Field 50% Photo
0 0,5 1 1,5 2 2,5
Q10 Q9 Q8 Q7 Q6 Q5 Q4 Q3 Q2 Q1
Square
Brillouin Diversit
y
100% Field 100% Photo
50% Field 50% Photo
Fig. 2. Mean species number (A) and Brillouin’s diversity index (B) by the different sampling methods on studied rocky shore (Q1: lowermost quadrat, Q10: uppermostquadrat), N = 4.
Table 1. Renkonen’s similarity coefficient of benthic community among the sampling methods at different heights of the rocky substrate (Q01: 0 to 0.2 meters).
Q10 Q09 Q08 Q07 Q06 Q05 Q04 Q03 Q02 Q01 100 points
field x 100 points
photo
98% 89% 73% 81% 83% 91% 93% 95% 93% 80%
100 points field
x 50 points field
99% 99% 97% 99% 98% 93% 94% 94% 92% 92%
50 points field x 50 points
photo
98% 89% 70% 80% 83% 86% 85% 90% 92% 79%
100 points photo
x 50 points
photo
100% 99% 98% 97% 97% 94% 90% 92% 95% 94%
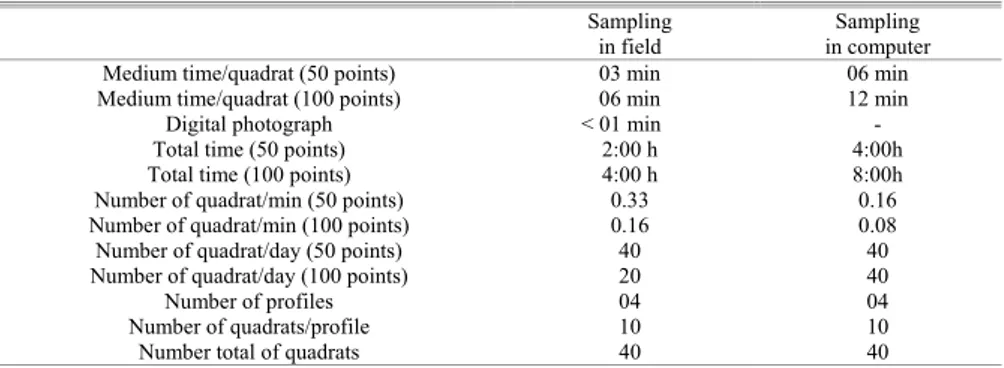
The comparative analysis of the sampling time showed that the 100 photo method took longer followed by the 50 photo, the 100 field and the 50 field, respectively (Table 2). The digital photograph hastens the field time, as sequential photos were taken with a less than 1-minute interval among them. The field time using the photo method for a whole profile (10 quadrats) was equivalent or lower for the necessary reading of only one quadrat by the field method (6 min for 100 points and 3 min for 50 points). However, a quadrat sampling in computer takes
around 12 min each for 100 points and 6 min for 50 points.
D
ISCUSSIONA
B
C
D
Fig. 3. Cluster analysis of benthic community at different heights by the different sampling methods (Morisita’s modified coefficient – UPGMA). A: 100 points in field method, B: 50 points in field method, C: 100 points photograph method, D: 50 points photograph method (Q1: lowermost quadrat, Q10: uppermost quadrat).
Species code: Emp – empty space; Lit – Littorina sp, Cht – Chtamalus sp; Cen – Centroceras clavulantum; Phr –
Table 2. Comparative analysis of the necessary time for in field and in computer sampling methods, for 50 and 100 points of the benthic intertidal community.
Sampling in field
Sampling in computer Medium time/quadrat (50 points)
Medium time/quadrat (100 points)
03 min 06 min
06 min 12 min Digital photograph < 01 min - Total time (50 points)
Total time (100 points)
2:00 h 4:00 h
4:00h 8:00h Number of quadrat/min (50 points)
Number of quadrat/min (100 points)
0.33 0.16
0.16 0.08 Number of quadrat/day (50 points)
Number of quadrat/day (100 points)
40 20
40 40
Number of profiles 04 04
Number of quadrats/profile 10 10
Number total of quadrats 40 40
analysis (Villaça, 1991). Since conclusions of field studies rest partly on how data was collected, sampling issues have been given considerable attention in ecology (Miller & Ambrose, 2000). There has been some extent work on collecting data methods (Foster
et al., 1991; Dethier et al., 1993; Sabino & Villaça, 1999) and sampling schedule for environmental impact assessments (e.g. Green, 1979; Underwood, 1994).
The main advantage in the digital photograph method is the fast estimation of abundance, in addition to quickening the capture of images, which can be visualized and retaken at the same time, still in situ. It is well known that time is a critical factor in conducting experiments and observations in intertidal zone specially due to the duration of the tidal cycle (Meese & Tomich, 1992; Dethier et al., 1993; Pech et al., 2004). The field time reduction is essential for the study of a larger area and for the increase of sample units. Two days sampling were necessary for the in situ method, while less than one hour was necessary for all 40 quadrats to be photographed.
The direct images digitalization reduced the film and its development costs in relation to old photographic methods, as used by Schoener & Greene (1981) and Foster et al. (1991). Moreover, with image edition programs the organisms may reach larger sizes than those from in field observation, helping their identification and a more careful analysis.
However, there is potential for misidentification of species by photograph, due to morphotypes with similar color that cannot be easily distinguished even with higher contrast techniques. The similarity of the rock color to Chthamalus sp through the photo method reflected in an extension of the Supralitoral Fringe in relation to the in field samples. Foster et al. (1991) have shown that photo quadrats consistently underestimate organisms’ cover
and the number of taxa. The quality of the digital camera is an important species identification factor.
Although percentage cover had been estimated in only two dimensions with a maximum of 100% coverage, the in field method gives a 3-D view of a plot, allowing the observation of several layers; thus a correct identification of all organisms which in certain angles may be blended in the photos (Foster et al., 1991). Near the water column, the dominant macroalgae was constantly dislocated by the wave, which exposed the other abundant species in the lower layer. Such scenery could only be seen in situ.
The comparative analysis of the in field method versus digital photograph showed notably higher results of the diversity index in the field method. However, richness and species percentage values at each height did not show significant differences among the methods.
Meese & Tomich (1992) and Sabino & Villaça (1999) compared different sampling techniques to estimate the coverage percentage on rocky intertidal shores and verified that no method was considerably better, reaching the same conclusion as this study.
Among several advantages for the photograph method, the one believed to be the most important is the community record containing different data (e.g. diversity, density, population size, growth rate, mortality). Besides, it is important to mention the extra expertise in biological identifications needed for in field method versus the benefit of standardized computer scoring when a single expert scores all images.
similar to that currently used for satellite images. Digital tools could substantially lower the cost of monitoring programs for which a fast acquisition data rate is needed at any spatial scale and improve the estimates of the ecological properties of the community (Pech et al., 2004).
It is suggested that for zonation, recruitment and succession studies of intertidal benthic communities, the digital photograph sampling method is rather efficient, accurate and advantageous in relation to the traditional in situ method. Still, such a choice might be made after the previous knowledge of the environment and the organisms in field. It is important to emphasize that both methods have advantages and disadvantages and the choice must be adequate to the final objectives.
Meese & Tomich (1992) and Dethier et al.
(1993) agree that the best recommendation is the combination of in field sampling (visual or point technique) by well-trained researchers and a photographic documentation.
Dethier et al. (1993) state that the main disadvantage of the intersection point method is the dependence on the sample size. A similarity over 90% was obtained between the 50 and the 100 points at each height of the rocky shore. However, it was possible to observe by the cluster analysis that the lower sample size, despite the method, overestimated some indicator organisms as the macroalga Hypnea musciformis and Ulva fasciata, increasing the Infralitoral Fringe by in situ method and the bivalve
Perna perna in the lower Midlitoral by photo technique.
Performing a study that evaluates different point numbers with intermediate scales between zero and 100 is important. Studies designed to assess the changes on community structure and composition might gather sample effort with the overall results for a whole series of species (Gonor & Kemp, 1978 apud
Miller & Ambrose, 2000).
The present study emphasizes that the sampling planning is the first step that a researcher must take in order to elaborate benthic ecology projects and confirms the importance of a previous sampling in situ.
A
CKNOWLEDGEMENTSWe would like to thank CNPq (Process Nº 301345/2004-0) and FAPERJ (Process No. E-26/171.260/2005) for the financial support and scholarship.
R
EFERENCESAndrew, N. L. & Mapstone, B. D. 1987. Sampling and description of spatial pattern in marine ecology. Oceanogr. mar. Biol. a. Rev., 25:39-90.
Benedetti-Cecchi, L. & Cinelli, F. 1993. Early patterns of algal succession in a midlittoral community of the Mediterranean Sea: a multifactorial experiment. J. expl mar. Biol. Ecol.,169:15-31.
Benedet-Cecchi, L. & Cinelli, F. 1996. Analysis of a spatial and temporal variability in intersections among algae, limpets and mussels in low shore habitats on the west coast of Italy. J. mar. biol. Ecol., 144:87-96.
Boaventura, D.; Fonseca, L. C. & Hawkins, S. J. 2002. Intertidal Rocky Shore Comunities of the Continental Portuguese Coast: Analysis of Distribution Patterns. Mar. Ecol., 23 (1):69-90.
Branch, G. M. 1976. Interspecific competition experience by South African. Patella species. J. anim. Ecol., 45:507 – 529.
Brum, I. N. S. & Absalão, R. S. 1990. Vertical distribuition of barnacles of the intertidal rocky shores of Guanabara Bay, RJ, Brazil. In: Neves, C. Magoon, O. eds. Coastlines of Brazil. New York: American Society of Civil Engineers. p. 139-153.
Connell, J. H. 1961. The influence of interspecific competition and other factors on the distribuition of the barnacle Chthamalus stellatus. Ecology,42:710-723. Coutinho, R. 2002. Bentos de costões rochosos. In: Pereira,
R. C. & Soares-Gomes, A. eds. Biologia marinha. Rio de Janeiro: Interciência, p. 147-157.
Dayton, P. K. 1971. Competition, disturbance and community organization: the provision and subsequent utilization of space in a rocky intertidal community. Ecol. Monogr., 41:351-389.
Dethier, M. N.; Graham, E. S.; Cohen, S. & Tear, L. M. 1993. Visual versus random-point percent cover estimations: “objective” is not always better. Mar. Ecol. Prog. Ser., 96:93-100.
Diamond, J. M. 1986. Overview: laboratory experiments, field experiments, and natural experiments. In: Diamond, J.M., Case, T. J. eds.Community ecology. New York, Harper & Row. p. 3-22.
Foster, M. S.; Harrold, C. & Hardin, D. D. 1991. Point
versus photo quadrat estimates of the cover of sessile
marine organisms. J. expl mar. Biol. Ecol., 146:193-203. Gevertz, R. 1995. Em busca do conhecimento ecológico: uma introdução à metodologia. São Paulo. Edgard Blucher. p. 65-66.
Good, T. P. 2004. Distribution and abundance patterns in caribbean rocky intertidal zones. Bull. mar. Sci., 74:459-468.
Green, R. H. 1979. Sampling design and statistical methods for environmental biologists. New York, John Wiley & Sons. 257p.
Guimaraens, M. A. & Coutinho, R. 2000. Temporal and spatial variation of Ulva sp and water properties in the Cabo Frio upwelling region of Brazil. Acquat. Bot., 66:101-114.
Jenkins, S. R.; Hawkins, S. J. & Norton, T. A. 1999b. Settlement and post-settlement interection between
Semibalanus balanoides and three species of fucoide
canopy algae. J. expl mar. Biol. Ecol., 236 (1):49-67. Krebs, C. J. 1989. Ecological methodology. New York,
Harper & Row. 654p.
Lewis, J. R. 1964. Ecology of rocky shores. London: English Universities Press. 323p.
Little, C. & Kitching, J. A. 1996. The biology of rocky shores. Oxford, Oxford University Press. 240p.
Loehle, C. 1987. Hypothesis testing in ecology: psycologycal aspects and importance of theory maturation. Q. Rev. Biol., 62:397-409.
McIntosh, R. P. 1987. Pluralism in ecology. Annu. Rev. Ecol. Syst, 18:321-341.
Meese, R. J. & Tomich, P. A. 1992. Dots on the rocks: a comparison of percent cover estimation methods.J. expl mar. Biol. Ecol., 165 (1):59-73.
Menge, B. A. 1991. Relative importance of recruitment and other causes of variation in rocky intertidal community structure. J. expl Biol. Ecol., 146:69-100.
Miller, A. W. & Ambrose, R. F. 2000. Sampling patchy distribuiion: comparison of sampling design in rocky intertidal habitats. Mar. Ecol.- Prog. Ser., 196:1-14. Paine, R. T. 1966. Food web complexity and species
diversity. Am. Nat., 100:65-75.
Paine, R. T. 1974. Intertidal community structure: experimental studies on the relationship between a dominant competitor and its - principal predator. Oecologia (Berl.), 15:93-120.
Paula, E. J. 1987. Zonação nos costões rochosos: região entremarés. In: SIMPÓSIO DE ECOSSISTEMAS DA COSTA SUL E SUDESTE BRASILEIRA. Anais. São Paulo, ACIESP, 1:266-268.
Pech, D.; Condal, A. R.; Bourget, E. & Ardisson, P. L. 2004. Abundance estimation of rocky shore Invertebrates at small spatial scale by high-resolution dital fotography and digital image analysis. J. expl. mar. Ecol., 299:185-189.
Peters, R. H. 1988. Some general problems for ecology illustrated by food web theory. Ecology, 69:1673-1676. Raffaelli, D. & Hawkins, S. J. 1996. Intertidal ecology.
London, Chapman & Hall. 356p.
Sabino, C. M. & Villaça, R. 1999. Estudo comparativo de métodos de amostragem de comunidades de costão. Re. Brasil. Biol., 59 (3):407-419.
Sauer Machado, K. R. S.; Chapman, A. R. O. & Coutinho, R. 1996. Consumer species have limited and variable roles in community organization on a tropical intertidal shore. Mar. Ecol. Prog. Ser., 134:73–83.
Schoener, A. & Greene, C. H. 1981. Comparison between destructive and nondestructive sampling of sessile epibentihic organisms. Limnol. Oceanogr. 26 (4):770-774.
Southwood, T. R. E. 1978. Ecological Methods. 2nd ed. New York, Chapman and Hall. 524p.
Stephenson ,T. A. & Stephenson, A. 1949. The Universal feature of zonation between tide-marks on rocky coasts. J. Ecol., 37: 289-305.
Sutherland, J. P. 1974. Multiple stable points in natural communities. Am. Nat., 108 (964):859-873.
Thomas, M. L. H. 1985. Littoral community and zonation on the rocky shores of Bermuda. Bull. mar. Sci., 37:857-870.
Underwood, A. J. 1978. An experimental evaluation of competition between three species of intertidal prosobranch gastropods. Oecologia, 33:185-202. Underwood, A. J. 1990. Experiments in ecology and
management: their logics, functions, and interpretations. Aust. J. Ecol, 15:365-389.
Underwood, A. J. 1991. Beyond BACI: Experimental designs for detecting human environmental impacts on temporal variations in natural populations. Aust. J. Mar. Freshwater Res., 42:569-587.
Underwood, A. J. 1994. On beyond BACI: sampling designs that might reliably detect environmental disturbances. Ecol. Appl., 4:3-15.
Valentin, J. L. 2000. Ecologia numérica – uma análise multivariada de dados ecológicos. Interciência. 117p. Vermeij, G. J. & Porter, J. W. 1971. Some characteristics of
the dominant intertidal molluscs from rocky shores in Pernambuco, Brazil. Bull. mar. Sci., 21:440–454. Villaça, R. C. 1991. Metodologia de amostragem em costões
rochosos. Abordagem fitosociológica. In: SIMPÓSIO DE ECOSSISTEMAS DA COSTA SUL E SUDESTE BRASILEIRA. 2. Anais. São Paulo, ACIESP, 2:1-13. Whorff , J. S. & Griffing, L. 1992. A video recording and
analysis system used to sample intertidal communities. J. expl mar. Biol. Ecol., 160:1-12.
Zar, J. H. 1984. Biostatistical Analysis. 2. ed. Englewood Cliffs, N. J., Prentice Hall. 718p.