HESSD
10, 6081–6106, 2013Riparian forest as a management tool
P. B. Kristensen et al.
Title Page
Abstract Introduction
Conclusions References
Tables Figures
◭ ◮
◭ ◮
Back Close
Full Screen / Esc
Printer-friendly Version Interactive Discussion
Discussion
P
a
per
|
Dis
cussion
P
a
per
|
Discussion
P
a
per
|
Discussio
n
P
a
per
|
Hydrol. Earth Syst. Sci. Discuss., 10, 6081–6106, 2013 www.hydrol-earth-syst-sci-discuss.net/10/6081/2013/ doi:10.5194/hessd-10-6081-2013
© Author(s) 2013. CC Attribution 3.0 License.
Geoscientific Geoscientific
Geoscientific Geoscientific
Hydrology and Earth System
Sciences
Open Access
Discussions
This discussion paper is/has been under review for the journal Hydrology and Earth System Sciences (HESS). Please refer to the corresponding final paper in HESS if available.
Riparian forest as a management tool for
moderating future thermal conditions of
lowland temperate streams
P. B. Kristensen1, E. A. Kristensen2, T. Riis1, A. J. Baisner1, S. E. Larsen2,
P. F. M. Verdonschot3, and A. Baattrup-Pedersen2
1
Department of Bioscience, Aarhus University, Ole Worms All ´e, Building 135, 8000 Aarhus, Denmark
2
Department of Bioscience, Aarhus University, Vejlsøvej 25, 8600 Silkeborg, Denmark
3
Department of Freshwater Ecology, Alterra, Wageningen University and Research Centre, P.O. Box 47, 6700 AA Wageningen, the Netherlands
Received: 19 April 2013 – Accepted: 5 May 2013 – Published: 15 May 2013 Correspondence to: P. B. Kristensen ([email protected])
HESSD
10, 6081–6106, 2013Riparian forest as a management tool
P. B. Kristensen et al.
Title Page
Abstract Introduction
Conclusions References
Tables Figures
◭ ◮
◭ ◮
Back Close
Full Screen / Esc
Printer-friendly Version Interactive Discussion
Discussion
P
a
per
|
Dis
cussion
P
a
per
|
Discussion
P
a
per
|
Discussio
n
P
a
per
Abstract
Predictions of the future climate infer that stream water temperatures may increase in temperate lowland areas and that streams without riparian forest will be particularly prone to elevated stream water temperature. Planting of riparian forest is a potential mitigation measure to reduce water temperatures for the benefit of stream organisms.
5
However, no studies have yet determined the length of a forested reach required to obtain a significant temperature decrease. To investigate this we measured the tem-perature in five small Danish lowland streams from June 2010 to July 2011, all show-ing a sharp transition between an upstream open reach and a downstream forested reach. In all stream reaches we also measured canopy cover and a range of physical
10
variables characterizing the streams reaches. This allowed us to analyse differences in mean daily temperature and amplitude per month among forested and open sec-tions as well as to study annual temperature regimes and the influence of physical conditions on temperature changes. Stream water temperature in the open reaches was affected by heating, and in July we observed an increase in temperature over the
15
entire length of the investigated reaches, reaching temperatures higher than the in-cipient lethal limit for brown trout. Along the forest reaches a significant decrease in July temperatures was recorded immediately (100 m) when the stream moved into the forested area. In three of our study streams the temperature continued to decrease the longer the stream entered into the forested reach, and the temperature decline did
20
not reach a plateau. The temperature increases along the open reaches were accom-panied by stronger daily temperature variation; however, when the streams entered into the forest, the range in daily variation decreased. Multiple regression analysis of the combined effects on stream water temperature of canopy cover, Width/Depth ra-tio, discharge, current velocity and water temperature revealed that canopy cover and
25
HESSD
10, 6081–6106, 2013Riparian forest as a management tool
P. B. Kristensen et al.
Title Page
Abstract Introduction
Conclusions References
Tables Figures
◭ ◮
◭ ◮
Back Close
Full Screen / Esc
Printer-friendly Version Interactive Discussion
Discussion
P
a
per
|
Dis
cussion
P
a
per
|
Discussion
P
a
per
|
Discussio
n
P
a
per
|
effects of heating of stream water and that forest planting can be a useful mitigation measure.
1 Introduction
Most scientists agree that climate change will have profound effects on the world’s ecosystems (e.g. Walker et al., 1999). Prognoses of global warming vary greatly in
ac-5
cordance with the applied models, but generally increases in air temperatures over the next century within the range of 1 to 6.4◦C for temperate areas are predicted (Solomon et al., 2007). The ecological effects of climate change are becoming increasingly ap-parent (Root et al., 2003), and evidence of how climate change affects stream ecosys-tems has recently emerged (e.g. Daufresne et al., 2004; Durance and Ormerod, 2007;
10
Daufresne and Bo ¨et, 2007; Meyer et al., 1999; Webb et al., 2008). Streams play a key role in the landscape as major pathways of solutes and in the processing and down-stream transport of energy (Vannote et al., 1980). Furthermore, the physical complexity of stream networks has led to a disproportionally large biological diversity per unit vol-ume. This biological diversity is, however, threatened from pressures consequent to
15
human activities in the catchments (e.g. Marzin et al., 2012 and Stoddard et al., 2006). Effects of climate change on stream ecosystems can be difficult to disentangle from the impacts of other stressors (Durance and Ormerod, 2007), but research indicates that river temperatures are increasing (Caissie, 2006) and that alterations of form and func-tion are taking place in stream ecosystems due to the enhanced temperatures; thus,
al-20
terations in hydrological regimes have been documented (e.g. Daufresne et al., 2004). In-stream temperature is a key determinant of habitat quality (e.g. Rostgaard and Ja-cobsen, 2005) that highly affects the physiological processes of aquatic organisms (e.g. Beschta, 1997). For example, coldwater adapted species, such as salmonids, cannot tolerate temperatures above about 22◦C (Keleher and Rahel 1996).
25
HESSD
10, 6081–6106, 2013Riparian forest as a management tool
P. B. Kristensen et al.
Title Page
Abstract Introduction
Conclusions References
Tables Figures
◭ ◮
◭ ◮
Back Close
Full Screen / Esc
Printer-friendly Version Interactive Discussion
Discussion
P
a
per
|
Dis
cussion
P
a
per
|
Discussion
P
a
per
|
Discussio
n
P
a
per
and air temperature), stream bed (including groundwater input and hyporheic ex-change), stream discharge (including hydraulics such as inflow and outflow, volume of water, slope and turbulence) and topography (including riparian vegetation and upland shading). Availability of incoming solar energy in summer under clear-sky-conditions may be more than 90 % in an unshaded stream (Beschta, 1984 and 1997), whereas
5
shading levels of up to 80 % from riparian forest have been measured (Bohle, 1994). In small streams, even bushes and herbs will often provide enough shade to dampen summer maximum temperature (Beschta, 1997). Several studies have shown how ri-parian shade affects the in-stream temperature (Brown and Krygier, 1970; Beschta, 1997; Bourque and Pomeroy, 2001; Roy et al., 2005; Broadmeadow et al., 2011) and
10
how removal of riparian forest leads to increased temperatures (Brown and Krygier, 1970; Bourque and Pomeroy, 2001). With the aim to combat the negative effects of increasing temperatures on stream ecosystems riparian forestation is therefore one of the most widely used mitigation measures. For example, in Oregon, US, the Depart-ment of Forestry has impleDepart-mented forest rules and laws to increase shading in the
15
riparian areas of streams in order to support anadromous salmon populations (Oregon Department of Forestry, 2010), and in New Brunswick provincial forestry regulations require that all non-intermittent streams>0.5 m wide should have a forested buffer strip of 30 m on each side of the stream to protect them from warming (Stewart and Comeau, 1996). These landscape planning initiatives do not, however, take into
con-20
sideration how long a reach is needed to obtain a significant decrease in temperature or how dense the canopy cover should be. Thus, to provide managers with a proper basis for decision making in riparian landscape planning, obtaining information about length and density of the canopy cover is crucial.
Some studies have investigated how different riparian vegetation structures, ranging
25
HESSD
10, 6081–6106, 2013Riparian forest as a management tool
P. B. Kristensen et al.
Title Page
Abstract Introduction
Conclusions References
Tables Figures
◭ ◮
◭ ◮
Back Close
Full Screen / Esc
Printer-friendly Version Interactive Discussion
Discussion
P
a
per
|
Dis
cussion
P
a
per
|
Discussion
P
a
per
|
Discussio
n
P
a
per
|
(open reaches) and stream reaches with riparian forest in order to test two hypotheses: (1) riparian forest reduces summer stream temperatures in small lowland streams, and (2) temperature reduction depends on the length of the forested reach, on canopy cover and stream channel morphology. Based on our results we evaluated the effects/the value of riparian forest as a measure to mitigate stream water heating and estimated
5
the length and denseness of a forested reach required to obtain a temperature de-crease.
2 Methods
2.1 Study sites and temperature measurements
In each of the five streams studied there was a sharp transition between an upstream
10
open reach and a downstream forested reach. The total length of the studied stream reaches ranged from 750–1400 m. All streams had a relatively stable flow regime (dis-charge ranging from 18 to 449 L s−1) and there was no input of surface water from tributaries or effluent sources along the study reaches. Furthermore, as major ground-water input may potentially affect the temperature regime, all reaches were visually
15
inspected prior to the study, identifying and excluding areas with likely groundwater input. Temperature was measured using Hobo® Pendant temperature loggers every hour at nine sites that were evenly distributed along each stream, with four loggers be-ing placed in each of the open and forested sections and one in the transition between these, providing a total of 45 temperature logging sites. All loggers were placed close
20
to the stream bed in well mixed water and temperature logging was initiated in June 2010. Data from all 45 loggers was retrieved in autumn 2010 (September 2010), allow-ing analysis of differences in mean daily temperature and amplitude per month among forested and open sections during the period of maximum air temperature and canopy cover (July, August and September). A subset of the loggers (three in each stream) was
25
HESSD
10, 6081–6106, 2013Riparian forest as a management tool
P. B. Kristensen et al.
Title Page
Abstract Introduction
Conclusions References
Tables Figures
◭ ◮
◭ ◮
Back Close
Full Screen / Esc
Printer-friendly Version Interactive Discussion
Discussion
P
a
per
|
Dis
cussion
P
a
per
|
Discussion
P
a
per
|
Discussio
n
P
a
per
amplitudes (the temperature loggers in the forested reach of River Gudenaa were lost and annual data on this reach are therefore unavailable). At each stream reach air tem-perature was measured every hour using Hobo® Pendant temperature loggers placed 1 m above the ground at a constantly shaded and well ventilated location. We checked between-logger precision by placing a subset (20) of the loggers in well mixed water
5
containing blocks of ice. The loggers were left to log every 10 min for 24 h and after data downloading we calculated the numeric values of all possible differences among loggers within the relevant temperature range (10–21◦C). We then calculated the av-erage between-logger difference and used this value (±0.07◦C) to correct temperature measurements for between-logger bias.
10
2.2 Stream characteristics
In order to describe the physical in-stream environments of the forested and open reaches of the five streams, a representative sub-reach of 100 m was characterised following the Danish national monitoring program on the aquatic environment (NO-VANA; Pedersen et al., 2007; Friberg et al., 2005). This 100 m sub-reach was placed
15
in the downstream end of the forested and open reaches and 20 cross sectional tran-sects were placed at 5 m intervals. We measured stream width at each transect, which was divided into five equally sized quadrates, water depths being measured in each quadrate. Width/Depth ratios and coefficient of variance (CV) in water depth and stream width were calculated. Also substrate type and macrophyte coverage were recorded in
20
each quadrate. Substrate types covering 25 % of a quadrate or more were registered using the categories stone (>60 mm diameter), gravel (3–60 mm), sand (0.25–3 mm), mud (<0.25 mm), clay and debris. The relative frequency of the various substratum types was determined from these recordings and macrophyte recordings from each quadrate were combined to an average coverage per stream reach. Water current
ve-25
HESSD
10, 6081–6106, 2013Riparian forest as a management tool
P. B. Kristensen et al.
Title Page
Abstract Introduction
Conclusions References
Tables Figures
◭ ◮
◭ ◮
Back Close
Full Screen / Esc
Printer-friendly Version Interactive Discussion
Discussion
P
a
per
|
Dis
cussion
P
a
per
|
Discussion
P
a
per
|
Discussio
n
P
a
per
|
open and forested reach in each stream using the velocity-area method of Jensen and Frost (1992).
In addition to the in-stream measurements, bank slope and bank height were quan-tified. Bank slope and height have previously been used as key variables in describing and categorizing Danish lowland streams (Baattrup-Pedersen et al., 2005). At each
5
transect two measurements (left and right side) of bank height and bank slope were conducted. First, bank slope was measured using an angle leveller. The bank was de-fined as the land area between the bank foot below the water level and the bank top (where the bank becomes horizontal). Next, bank height was determined as the vertical distance from the bank foot to the horizontal plane representing the bank top. Where
10
the bank consisted of several steps with different slopes, the length and slope of each step were measured and a combined slope was calculated.
Riparian shading was quantified in all five streams using a LAI-2000 plant canopy analyser (LI-COR, Lincoln, Nebraska), which uses a fisheye lens to project a hemi-spheric image of the sky radiation onto five detectors. Each measurement consists of
15
the ratio of a below canopy reading to an open field (no canopy) reading (Welles and Norman, 1991). The measurements are expressed as different indices, including the Leaf Area Index (LAI) and the Diffuse Non-Interceptance (DIFN). Both indices can be used to describe the relative cover of foliage at each stream site; DIFN being, however, a better index of stream shade (Davies-Colley and Payne, 1998). DIFN is the light
re-20
ceived at a horizontal plane (e.g. a stream water surface) expressed as a proportion of the light received under clear-sky conditions (e.g. no canopy). DIFN values range from 0–1, 1 representing a sky completely without shade. In this study we therefore use 1-DIFN as a measure of canopy cover (%) at each stream site. The DIFN estimate for each open and forested reach was obtained by combining readings for every 20 m
25
HESSD
10, 6081–6106, 2013Riparian forest as a management tool
P. B. Kristensen et al.
Title Page
Abstract Introduction
Conclusions References
Tables Figures
◭ ◮
◭ ◮
Back Close
Full Screen / Esc
Printer-friendly Version Interactive Discussion
Discussion
P
a
per
|
Dis
cussion
P
a
per
|
Discussion
P
a
per
|
Discussio
n
P
a
per
2.3 Statistics
For each stream we tested if physical properties and canopy cover differed between the open and the forested section using a mixed model with transect number defined as a random factor (Snedecor and Cochran, 1989). Prior to analysis, recordings for each substrate type were divided into five categories: (1) x=0; (2) 0< x≤25; (3)
5
25< x≤50; (4) 50< x≤75; (5) 75< x≤100, and then analysed using contingency
table methods (Agresti, 1990). In addition, difference in air temperature between the open and the forested section for each stream was tested using a pairedt test. The difference in temperature and amplitude between two neighbouring loggers within the same stream was estimated by subtracting the measurements recorded at the exact
10
same time at the two locations and applying a standard normal test for mean equal zero (Snedecor and Cochran, 1989). We only showed results when there was a diff er-ence of 0.14◦C or higher in temperature or amplitude among two neighbouring loggers because of the estimated between-logger bias of±0.07◦C.
To evaluate which variables influence the ability of forests to protect stream water
15
from heating, we selected a priori five variables: canopy cover (expressed as 1-DIFN),
W/D ratio, discharge, current velocity in the forested reach and water temperature when the stream enters the forest. W/D ratio was chosen as the only factor repre-senting stream channel morphology as an exploratory scatterplot suggested that the remaining variables describing channel morphology were not related to temperature
20
change. Furthermore, previous studies have documented that riparian forest often has a widening effect on streams and thereby increases the W/D ratio (McBride et al., 2008). Also discharge and current velocity were selected, being as they are factors in stream temperature budgets, particularly in smaller streams where there is a larger net energy exchange with the surroundings than in larger rivers (Brown, 1969). Finally,
25
HESSD
10, 6081–6106, 2013Riparian forest as a management tool
P. B. Kristensen et al.
Title Page
Abstract Introduction
Conclusions References
Tables Figures
◭ ◮
◭ ◮
Back Close
Full Screen / Esc
Printer-friendly Version Interactive Discussion
Discussion
P
a
per
|
Dis
cussion
P
a
per
|
Discussion
P
a
per
|
Discussio
n
P
a
per
|
changes, we first performed simple linear regressions. The combined effect of the five selected variables on reduction in stream water temperature was analysed using mul-tiple linear regression with stepwise selection. The dependent variable in the model was the total change in July temperature from the beginning to the end of the forested reaches and the independent variables were: canopy cover,W/Dratio, discharge
mea-5
sured at the border between open and forested reach, average current velocity and water temperature entering the forest. Using this approach we were able to test the combined effect of these five variables on temperature changes, while simultaneously allowing us to detect the influence of each individual variable by inspecting the signifi-cance level of each variable in the model.
10
3 Results
Canopy cover was significantly denser in all forested reaches than in open reaches and the forested reaches were significantly wider than the open reaches (Table 1). Except for River Gudenaa the forested reaches also had a significantly higher Width/Depth ratio than the open reaches, indicating that streams are generally widening and
conse-15
quently becoming shallower when they enter the forest (Table 1). Macrophyte coverage was significantly higher in the open reaches compared to the forested reaches in three streams (River Urlev, Storkesig brook and Voel brook; Table 1) and July air tempera-ture was significantly higher in the open than the forested reach in three streams (River Urlev, Storkesig Brook and River Gudenaa; Table 1). For the remaining physical
vari-20
ables there were no consistent differences between the open and the forested reaches (Table 1).
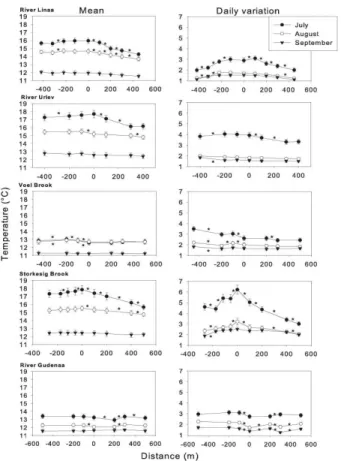
Mean daily stream water temperature significantly decreased from July to Septem-ber in four of the studied streams (One-Way ANOVA,P <0.0001; Fig. 1). In Voel Brook the mean stream temperature in July and August was similar, whereas the September
25
temperature was significantly lower than the summer temperature (One-Way ANOVA,
HESSD
10, 6081–6106, 2013Riparian forest as a management tool
P. B. Kristensen et al.
Title Page
Abstract Introduction
Conclusions References
Tables Figures
◭ ◮
◭ ◮
Back Close
Full Screen / Esc
Printer-friendly Version Interactive Discussion
Discussion
P
a
per
|
Dis
cussion
P
a
per
|
Discussion
P
a
per
|
Discussio
n
P
a
per
July than in August and September in four of the studied streams (One-Way ANOVA,
P <0.0001; Fig. 1), and only in River Gudenaa did the mean daily variation change
significantly among all three months (One-Way ANOVA,P <0.0001; Fig. 1).
Stream water temperature in the open reaches was affected by heating, and in three streams (River Linaa, River Urlev and Storkesig Brook, Fig. 1) we observed an
in-5
crease in temperature over the length of the open reach in July 2010. The heating was particularly pronounced in Storkesig Brook where a significant increase of more than 0.14◦C was recorded in July 2010 among two of the logger pairs located at the open reach (t=−12.85 and t=−8.96, respectively,P <0.0001). In four of the five studied streams (River Linaa, River Urlev, Storkesig Brook and River Gudenaa), a significant
10
decrease of more than 0.14◦C appeared in the July 2010 temperature between the logger located at the beginning of the forest and the next downstream logger (t=5.36,
t=47.31, t=21.88 and t=26.65, respectively, P <0.0001 for all; Fig. 1). The July 2010 temperature continued to decrease significantly with more than 0.14◦C between loggers in three of the streams (River Linaa, River Urlev and Storkesig Brook) when
15
moving further into the forested reach (t=16.05,t=52.07, andt=18.5, respectively,
P <0.0001 for all; Fig. 1), with an overall mean decrease of 1–2◦C from the beginning
to the end of the forested reaches. The temperature decline in River Linaa and Storke-sig Brook did not reach plateau, indicating that the full potential regarding riparian forest shading, and thereby the ability to prevent irradiative heating, was not reached here.
20
In River Gudenaa, the pattern was less consistent, showing a significant temperature increase in July 2010 of more than 0.14◦C when moving downstream to the next log-ger (t=−35.73, P <0.0001), followed by a significant decrease of more than 0.14◦C
between the last two loggers (t=33.88, P <0.0001; Fig. 1). In the last stream (Voel Brook) July 2010 temperatures did not change with more than 0.1◦C among any of the
25
loggers located in the forest (Fig. 1).
In August 2010 also water temperature decreased significantly by more than 0.14◦
C among all forest loggers in River Linaa (t=39.7, t=40.89, t=46.83, t=39.76;
HESSD
10, 6081–6106, 2013Riparian forest as a management tool
P. B. Kristensen et al.
Title Page
Abstract Introduction
Conclusions References
Tables Figures
◭ ◮
◭ ◮
Back Close
Full Screen / Esc
Printer-friendly Version Interactive Discussion
Discussion
P
a
per
|
Dis
cussion
P
a
per
|
Discussion
P
a
per
|
Discussio
n
P
a
per
|
the forested reach (t=21.28,t=31.86,t=19.42, P <0.0001; Fig. 1); the overall de-crease from the beginning to the end of the forested reach was, however, lower than for July 2010 (Fig. 1). In River Urlev no temperature change occurred in August 2010 from the beginning of the forest and downstream to the next logger (t=1.86,P =0.102), but a significant decrease by more than 0.14◦C occurred between the last pair of loggers
5
(t=20.76,P <0.0001; Fig. 1). Also the August 2010 temperature in River Gudenaa did not change significantly from the beginning of the forest and downstream to the next logger (t=−0.08,P =0.938), and as observed in July 2010 also the pattern for the
re-maining of the forested reach was inconsistent August 2010. A significant temperature increase of more than 0.14◦C was observed in July 2010 when moving downstream to
10
the next logger (t=−22.95, P <0.0001), this being followed by a difference<0.14◦C
between the last two loggers (Fig. 1). In Voel Brook, August 2010 temperatures did not change by more than 0.14◦C among any of the loggers located in the forest (Fig. 1). In September 2010 the effect of the forest was limited and temperature did not change by more than 0.14◦
C among any of the logger pairs located in the forest (Fig. 1).
15
The increase in stream temperature observed along the length of the open reach in three streams (River Linaa, River Urlev and Storkesig Brook, Fig. 1) was accompanied by a significant increase in daily temperature variation when moving downstream. The latter was particular notable in River Linaa and Storkesig Brook. In July 2010 in River Linaa there was a significant increase in daily variation by more than 0.14◦C between
20
the first three logger pairs located in the open reach (t=−5.78.t=−6.94, t=−4.21,
respectively,P <0.0002 for all). In Storkesig Brook the daily variation in July 2010 de-creased significantly by more than 0.14◦C between the first logger pair in the open reach (t=5.18,P <0.0001), but increased significantly by more than 0.14◦C between the two other pairs of loggers when moving downstream toward the forest (t=−5.74,
25
t=−5.33, respectively,P <0.0001 for both). After entering the forest the daily
HESSD
10, 6081–6106, 2013Riparian forest as a management tool
P. B. Kristensen et al.
Title Page
Abstract Introduction
Conclusions References
Tables Figures
◭ ◮
◭ ◮
Back Close
Full Screen / Esc
Printer-friendly Version Interactive Discussion
Discussion
P
a
per
|
Dis
cussion
P
a
per
|
Discussion
P
a
per
|
Discussio
n
P
a
per
followed by a significant decrease among the next three pairs of loggers (t=5.16,
t=10.57, T =10.88, respectively,P <0.00001 for all; Fig. 1). In River Urlev the daily variation in the July 2010 temperature decreased significantly by more than 0.14◦
C be-tween the first two logger pairs (t=4.0,t=4.23, respectively,P <0.001 for both), and in Storkesig Brook the daily temperature variation in July 2010 decreased significantly
5
by more than 0.14◦
C between all logger pairs when the stream moved into the forest (t=5.55,t=8.08,t=9.72,t=6.09, respectively,P <0.0001 for all; Fig. 1).
The daily temperature variation in August 2010 was only slightly affected by riparian forest, the only exception being Storkesig Brook where the daily temperature variation continued to decrease significantly by more than 0.14◦C between three logger pairs
10
located in the forest (t=6.1, t=5.11, t=4.31, respectively,P <0.002 for all; Fig. 1). By September 2010 the positive effect on temperature variation by forest shade had disappeared in all five streams (Fig. 1).
There was a significant linear relationship between canopy cover (1-DIFN) and change in July 2010 water temperature from upstream to downstream forested reaches
15
(R2=0.95, P =0.002; Fig. 2), between W/D ratio and the July 2010 temperature change (R2=0.66, P =0.05; Fig. 2) and between water temperature when enter-ing the forest and change in July 2010 temperature (R2=0.62, P =0.05; Fig. 2). In contrast, no significant linear relationship existed between discharge and temperature change in the forest (R2=−0.02, P =0.411; Fig. 2) or between current velocity in the
20
forest and change in July 2010 temperature (R2=−0.26, P =0.72; Fig. 2). Multiple
regression analysis with stepwise selection of the combined effects of canopy cover,
W/Dratio, discharge, current velocity in forested reaches and water temperature when entering the forest revealed a significant reduction in stream water temperature (F
value=722.07,P =0.001); however, only canopy cover (F value=90.88, P =0.002)
25
HESSD
10, 6081–6106, 2013Riparian forest as a management tool
P. B. Kristensen et al.
Title Page
Abstract Introduction
Conclusions References
Tables Figures
◭ ◮
◭ ◮
Back Close
Full Screen / Esc
Printer-friendly Version Interactive Discussion
Discussion
P
a
per
|
Dis
cussion
P
a
per
|
Discussion
P
a
per
|
Discussio
n
P
a
per
|
4 Discussion
4.1 Insulating effect of forest
We found that forest canopy significantly reduced the stream water temperature and daily amplitudes in four of our five study streams. This decrease was highly corre-lated with canopy cover and thereby supports the findings of Sridhar et al. (2004) and
5
Beschta and Taylor (1988) that canopy cover is a key parameter controlling stream water temperature. The shade of the forest also prevented air temperature from being heated in three of the five streams, thus adding to decreased stream water tempera-ture of the forested reaches and also resulting in significantly lower diel fluctuations in stream water temperature in the forested reaches. The largest potential for cooling of
10
stream water exists in the summer months due to convective heat loss (Maciejewski, 1996), this being supported by our identification of a significant relationship between stream water temperature at entry to the forest and change in July temperature. We also found that 100 m of forest canopy sufficed to produce a significant decrease in mean temperature and daily amplitude. To our knowledge, such a rapid response in
15
stream water temperature to a change in canopy cover has not been documented for temperate lowland streams before. Broadmeadow et al. (2011) suggested that planting of new riparian forest with a mean canopy cover of 20 % along 500 m stream would be enough to prevent summer water temperatures to exceed lethal limits for salmonids. Our findings suggest that an even shorter stream reach with a canopy cover denser
20
than 20 % may suffice to effectively reduce mean water temperatures and daily ampli-tudes and that the potential for reducing stream water temperature by riparian canopy cover grows with increasing canopy cover (Storkesig Brook and River Linaa). The lack of response in temperature along the canopy cover of River Gudenaa study reach is most likely the result of the much larger water volume here compared to the other study
25
HESSD
10, 6081–6106, 2013Riparian forest as a management tool
P. B. Kristensen et al.
Title Page
Abstract Introduction
Conclusions References
Tables Figures
◭ ◮
◭ ◮
Back Close
Full Screen / Esc
Printer-friendly Version Interactive Discussion
Discussion
P
a
per
|
Dis
cussion
P
a
per
|
Discussion
P
a
per
|
Discussio
n
P
a
per
reach, the River Gudenaa canopy was more unevenly distributed and characterised by patches of trees followed by short sections without trees.
4.2 Implications for stream biota
Stream water temperature is a key parameter affecting the overall health of an ecosys-tem (Caissie, 2006; Coutant, 1999). It affects both the distribution of stream organisms
5
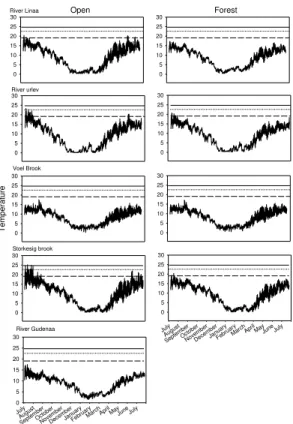
(e.g. Ebersole et al., 2001) and their growth rate (Elliot et al., 1995; Markarian, 1980). In Fig. 3 we show the annual variation in stream water temperatures in the studied streams together with indications of the upper growth limit and incipient lethal tempera-ture for brown trout (Salmo trutta) and the upper egg hatching limit of the mayflyBaetis rhodani. We chose these two stream organisms as being representative of fish and
10
macroinvertebrate communities as they are both very common in temperate lowland streams (Kristensen et al., 2012; Imholt et al., 2010) and therefore suitable examples for illustrating the potential consequences of stream water heating on the stream biota. The stream biota is characterised by ectotherms and is therefore greatly influenced by variations in temperature. Temperature influences the amount of dissolved oxygen and
15
metabolic activity and thereby the distribution of species (e.g. Rostgaard and Jacob-sen, 2005). Salmonids (e.g. salmon or trout) seek thermal refuge at high temperatures in colder water (Ebersole et al., 2001) or by migrating to cold-water tributaries (Cunjak et al., 1993), and in a study of salmonid fishes conducted in Wyoming streams Keleher and Rahel (1996) found that the fish distribution was limited to regions with mean air
20
temperatures below 22◦C. We recorded temperature peaks above 25◦C at the open site of Storkesig Brook, which exceeds the “incipient lethal temperature” for brown trout (24.7◦C), this usually being defined as the temperature which 50 % of the fish can tol-erate for 7 days (Elliott, 1994), and the temperature limit for growth of brown trout (19.1◦
C) and the upper limit for hatching ofBaetis rhodanieggs (22◦
C) were exceeded
25
HESSD
10, 6081–6106, 2013Riparian forest as a management tool
P. B. Kristensen et al.
Title Page
Abstract Introduction
Conclusions References
Tables Figures
◭ ◮
◭ ◮
Back Close
Full Screen / Esc
Printer-friendly Version Interactive Discussion
Discussion
P
a
per
|
Dis
cussion
P
a
per
|
Discussion
P
a
per
|
Discussio
n
P
a
per
|
latter study trout density in open reaches was low, whereas high abundances were observed in the colder forested reaches, indicating a negative impact of the warmer stream water of the open reaches.
The increase in annual maximum temperatures and amplitudes in four of our five study streams could potentially have substantial influence on the survival and
emer-5
gence patterns of macroinvertebrates. For example, the temperature limit for hatching ofBaetis rhodani eggs was exceeded in the open reach of two streams. We also found enhanced diel temperature amplitudes in the open reaches, which may also reduce the number of species. Durance and Ormerod (2007) showed that many core species of macroinvertebrates may persist at a global warming induced temperature increase of
10
3–4◦C, but also that the most scarce taxa (5–12 % of the species pool) would be in risk of local extinction. Furthermore, a 1.7◦C increase in winter mean temperature of Llyn Brianne, Wales, over 25 yr was demonstrated by Durance and Ormerod (2007) to in-crease the average specific growth rate of overwinteringBaetis rhodani, one of the most common insects in Danish streams. This also implies that nymphs may reach a suffi
-15
cient size for early emergence, nymph abundance consequently being lower in spring. Quinn et al. (1994) investigated temperature tolerance levels for selected stream in-vertebrates and found that LT50 values after 48 and 96 h’s exposure ranged from 24.5 to>34◦C and 22.6 to 32.6◦C, respectively, for the 12 macroinvertebrates species in-cluded in their study. Both Storkesig Brook and River Urlev experienced summer
tem-20
peratures within this range, i.e. above 25◦C, and nearly a doubling of the diel temper-ature amplitudes in the open compared to the forested reaches, suggesting a potential negative impact on the macroinvertebrate communities of these reaches. Not only tem-perature constitutes a future/current challenge for the stream biota in lowland streams, also ditching, draining of agricultural areas and intensive weed cutting combined with
25
HESSD
10, 6081–6106, 2013Riparian forest as a management tool
P. B. Kristensen et al.
Title Page
Abstract Introduction
Conclusions References
Tables Figures
◭ ◮
◭ ◮
Back Close
Full Screen / Esc
Printer-friendly Version Interactive Discussion
Discussion
P
a
per
|
Dis
cussion
P
a
per
|
Discussion
P
a
per
|
Discussio
n
P
a
per
4.3 Effect of stream channel morphology
We found that the morphology of the stream channels changes with riparian for-est cover, which corroborates previous study results (e.g. McBride et al., 2008; All-mendinger et al., 2005; Davies-Colley, 1997) and that circumstance that small streams widen in forests. The mechanisms behind these observations are still debated, some
5
suggesting that Large Woody Debris (LWD) plays an important role in the widening of forested reaches as LWD can create local scouring (Zimmerman et al., 1967). Others have hypothesized that when riparian forests are cleared, grasses can colonize gravel bars in the stream channel, rendering the bars more stable and less prone to erosion with consequent narrowing of the channel (Davies-Colley, 1997). The streams included
10
in our study are all located in lowland areas dominated by intensive agriculture. Stream maintenance involving macrophyte cutting and dredging in order to improve drainage is widely applied. This is most likely one of the factors behind the observed differences in stream channel morphology – several decades of maintenance have created deeper channels in open reaches than in forested reaches where maintenance is less
inten-15
sive or absent. As a consequence of the wider channels in the forested reaches, depth was generally lower here. Another important difference in habitats between the forested and the open reaches was the reduced macrophyte cover in the forest reaches, being, significant in three of the five streams. Such differences may impact the quality of the forested areas as habitats for larger-sized fish, since large fish require more water than
20
smaller fish. Moreover, macrophytes function as important structural assemblies for fish and macroinvertebrates (Phillips, 2003; Warfe and Barmuta, 2006), and the findings of a recent study conducted by McCormick and Harrison (2011) demonstrated lower den-sity and growth of salmonids in forested compared to open reaches as a consequence of the lower macrophyte abundance in the forested reaches. It is therefore important to
25
HESSD
10, 6081–6106, 2013Riparian forest as a management tool
P. B. Kristensen et al.
Title Page
Abstract Introduction
Conclusions References
Tables Figures
◭ ◮
◭ ◮
Back Close
Full Screen / Esc
Printer-friendly Version Interactive Discussion
Discussion
P
a
per
|
Dis
cussion
P
a
per
|
Discussion
P
a
per
|
Discussio
n
P
a
per
|
5 Conclusions
Our study results suggest that riparian forest can be an effective tool in climate change adaptation and add to the evidence showing that riparian canopy cover may be an effective regulator of stream water temperature (Malcolm et al., 2008; Broadmeadow and Nisbet, 2004; Brown and Krygier, 1970; Beschta, 1997; Bourque and Pomeroy,
5
2001; Roy et al., 2005; Broadmeadow et al., 2011). Our findings indicate that as small a stretch as 100 m riparian forest can reduce stream water temperature by up to 1◦C compared to the temperature of an open reach and that the combined insulating ef-fect of the entire forested reach (up to 500 m) can reduce the temperature by 2–3◦C, at least at canopy covers of about 75–90 %. Compared to published lethal limits and
10
limits for growth for selected stream organisms, our results suggest that a temperature reduction within this range is sufficient to prevent stream water temperature from ex-ceeding thermal thresholds. According to predictions, the air temperature in temperate regions will rise with up to 6.4◦
C (Solomon et al., 2007), which most likely will result in a stronger need for temperature reduction than suggested by the present study, i.e.
15
shaded reaches with dense canopy cover longer than 500 m. However, forestation as a mitigation measure should also take into account that many lowland streams histori-cally are rich in macrophytes which potentially could be outshaded following planting of riparian forest. In the present study we generally found lower coverage of macrophytes in the forested reaches. Macrophytes are important hotspots for fish and
macroinver-20
tebrates (Philips, 2003; Warfe and Barmuta, 2006; McCormick and Harrison, 2011). Loss of macrofauna biomass and diversity provided by these macrophyte beds as a re-sult of shading could be diminished if managers leave open reaches interspersed in the riparian canopy. We found that temperature decreased substantially over relatively short distances at dense canopy cover; thus, a riparian cover to reduce temperature
25
HESSD
10, 6081–6106, 2013Riparian forest as a management tool
P. B. Kristensen et al.
Title Page
Abstract Introduction
Conclusions References
Tables Figures
◭ ◮
◭ ◮
Back Close
Full Screen / Esc
Printer-friendly Version Interactive Discussion
Discussion
P
a
per
|
Dis
cussion
P
a
per
|
Discussion
P
a
per
|
Discussio
n
P
a
per
whereby streams can flood riparian areas and let natural succession lead to growth of smaller trees and bushes adapted to this environment (for example willow and alder). Investigation of this was not within the scope of this study, however, but may form the focus of future research, as more details on the combined positive effects of reducing stream temperature and increasing the biodiversity in both the stream and its riparian
5
area will improve the decision-making basis for policy makers and managers.
Acknowledgements. The authors acknowledge Kristian Emil Krogh Pedersen for assistance in the field. We also thank Anne Mette Poulsen for valuable editorial comments. The research was funded by FP7/ENV-2009-1 under grant agreement 244121 (REFRESH project) and The Danish Council for Independent Research (grant for T. Riis).
10
References
Agresti, A.: Categorical Data Analysis, John Wiley and Sons, New York, 710 pp., 1990. Allmendinger, N. E., Pizzuto, J. E., Potter Jr. N., Johnson, T. E., and Hession, W. C.: The
influence of riparian vegetation on stream width, eastern Pennsylvania, USA, Geol. Soc. Am. Bull., 117, 229–243, 2005.
15
Baattrup-Pedersen, A., Larsen, S. E., and Riis, T.: Long-term effects of stream management on plant communities in two Danish lowland streams, Hydrobiologia, 481, 33–45, 2002.
Baattrup-Pedersen, A., Friberg, N., Larsen, S. E., and Riis, T.: The influence of channelization on riparian plant assemblages, Freshwater Biol., 50, 1248–1261, 2005.
Beschta, R. L.: TEMP84: A Computer Model for Predicting Stream Temperatures Resulting
20
from the Management of Streamside Vegetation, Report WSDG-AD-00009, USDA Forest Service, Watershed Systems Development Group, Fort Collins, Colorado, 76 pp., 1984. Beschta, R. L.: Riparian shade and stream temperature: an alternative perspective,
Range-lands, 19, 25–28, 1997.
Beschta, R. L. and Taylor, R. L.: Stream temperature increases and land use in
25
HESSD
10, 6081–6106, 2013Riparian forest as a management tool
P. B. Kristensen et al.
Title Page
Abstract Introduction
Conclusions References
Tables Figures
◭ ◮
◭ ◮
Back Close
Full Screen / Esc
Printer-friendly Version Interactive Discussion
Discussion
P
a
per
|
Dis
cussion
P
a
per
|
Discussion
P
a
per
|
Discussio
n
P
a
per
|
Bohle, T. W.: Stream temperatures, riparian vegetation, and channel morphology in the Upper Grande Ronde River Watershed, Oregon, Department of Forest Engineering, Oregon State University, Corvallis, Oregon, 127 pp., 1994.
Bourque, C. P.-A. and Pomeroy, J. H.: Effects of forest harvesting on summer stream temper-atures in New Brunswick, Canada: an inter-catchment, multiple-year comparison, Hydrol.
5
Earth Syst. Sci., 5, 599–614, doi:10.5194/hess-5-599-2001, 2001.
Broadmeadow, S. and Nisbet, T. R.: The effects of riparian forest management on the freshwa-ter environment: a lifreshwa-terature review of best management practice, Hydrol. Earth Syst. Sci., 8, 286–305, doi:10.5194/hess-8-286-2004, 2004.
Broadmeadow, S., Jones, G., Langford, T. E. L., Shaw, P., and Nisbet, T. R.: The influence of
10
riparian shade on lowland stream water temperatures in Southern England and their viability for brown trout, River Res. Appl., 27, 226–237, 2011.
Brown, G. W.: Predicting temperatures of small streams, Water Resour. Res., 5, 68–75, 1969. Brown, G. W. and Krygier, J. T.: Effects of clear-cutting on stream temperature, Water Resour.
Res., 6, 1133–1139, 1970.
15
Caissie, D.: The thermal regime of rivers: a review, Freshwater Biol., 51, 1389–1406, 2006. Coutant, C. C.: Perspective on Temperature in the Pacific Northwest’s Fresh Water,
Environ-mental Sciences Division, Publication No. 4849, Oak Ridge National Laboratory, ORNL/TM-1999/44., Oak Ridge National Laboratory, Oak Ridge, Tennessee, 109 pp., 1999.
Cunjak, R. A., Caissie, D., EI-Jabi, N., Hardie, P., Conlon, J. H., Pollock, T. L., Giberson, D. J.,
20
and Komadina-outhwright, S.: The Catamaran Brook (New Brunswick) Habitat Research Project: biological, physical and chemical conditions (1990–1992), Canadian Technical Re-port of Fisheries and Aquatic Sciences, 1914, 81 pp., 1993.
Davies-Colley, R. J.: Stream channels are narrower in pasture than in forest, New Zeal. J. Mar. Fresh., 31, 599–608, 1997.
25
Davies-Colley, R. J. and Payne, G. W.: Measuring stream shade, J. N. Am. Benthol. Soc., 17, 250–260, 1998.
Daufresne, M. and Bo ¨et, P.: Climate change impacts on structure and diversity of fish commu-nities in rivers, Global Change Biol., 13, 2467–2478, 2007.
Daufresne, M., Roger, M. C., Capra, H., and Lamouroux, N.: Long-term changes within the
in-30
HESSD
10, 6081–6106, 2013Riparian forest as a management tool
P. B. Kristensen et al.
Title Page
Abstract Introduction
Conclusions References
Tables Figures
◭ ◮
◭ ◮
Back Close
Full Screen / Esc
Printer-friendly Version Interactive Discussion
Discussion
P
a
per
|
Dis
cussion
P
a
per
|
Discussion
P
a
per
|
Discussio
n
P
a
per
Durance, I. and Ormerod, S. J.: Climate change effects on upland stream macroinvertebrates over a 25-year period, Global Change Biol., 13, 942–957, 2007.
Ebersole, J. L., Liss, W. J., and Frissell, C. A.: Relationship between stream temperature, ther-mal refugia and rainbow trout Oncorhynchus mykiss abundance in arid-land streams in the northwestern United States, Ecol. Freshw. Fish, 10, 1–10, 2001.
5
Elliott, J. M.: Effect of temperature on the time of hatching in Baetis rhodani, Oecologia, 9, 47–51, 1972.
Elliott, J. M.: Quantitative Ecology and the Brown Trout, Oxford, Oxford University Press, 286 pp., 1994.
Elliott, J. M. and Elliott, J. A.: Temperature requirements of Atlantic salmon Salmo salar,
10
brown troutSalmo truttaand Arctic charrSalvelinus alpinus: predicting the effects of climate change, J. Fish Biol., 77, 1793–1817, 2010.
Elliott, J. M., Hurley, M. A., and Fryer, R. J.: A new, improved growth model for brown trout, Salmo trutta, Funct. Ecol., 9, 290–298, 1995.
Friberg, N., Baattrup-Pedersen, A., Lauge Pedersen, M., and Skriver, J.: The new Danish
15
stream monitoring programme (Novana) – preparing monitoring activities for the water frame-work directive era, Environ. Monit. Assess., 111, 27–42, 2005.
Imholt, C., Gibbins, C. N., Malcolm, I. A., Langan, S., and Soulsby, C.: Influence of riparian cover on stream temperatures and growth of the mayflyBaetis rhodani in an upland stream, Aquat. Ecol., 44, 669–678, 2010.
20
IPCC: Summary for Policymakers, in: Climate Change 2007: The Physical Science Basis. Con-tribution of Working Group I to the Fourth Assessment Report of the Intergovernmental Panel on Climate Change, edited by: Solomon, S., Qin, D., Manning, M., Chen, Z., Marquis, M., Av-eryt, K. B., Tignor, M., and Miller, H. L., Cambridge University Press, Cambridge, UK and New York, NY, USA, 2007.
25
Jensen, J. L. and Frost, K.: Hydrometrisk feltarbejde, Publikation nr. 10 fra Fagdatacenter for Hydrometriske Data, Hedeselskabet, 52 pp., 1992 (in Danish).
Keleher, C. J. and Rahel, F. J.: Thermal limits to salmonid distributions in the Rocky Mountain region and potential habitat loss due to global warming: a Geographic Information System (GIS) approach, T. Am. Fish. Soc., 125, 1–13, 1996.
30
HESSD
10, 6081–6106, 2013Riparian forest as a management tool
P. B. Kristensen et al.
Title Page
Abstract Introduction
Conclusions References
Tables Figures
◭ ◮
◭ ◮
Back Close
Full Screen / Esc
Printer-friendly Version Interactive Discussion
Discussion
P
a
per
|
Dis
cussion
P
a
per
|
Discussion
P
a
per
|
Discussio
n
P
a
per
|
Maciejewski, P. K.: Evidence of a convective instability allowing warm water to freeze in less time than cold water, J. Heat Transf., 118, 65–72, 1996.
Malcolm, I. A., Soulsby, C., Hannah, D. M., Bacon, P. J., Youngson, A. F., and Tetzlaff, D.: The influence of riparian woodland on stream temperatures: implications for the performance of juvenile salmonids, Hydrol. Process., 22, 968–979, 2008.
5
Markarian, R. K.: A study of the relationship between aquatic insect growth and water temper-ature in a small stream, Hydrobiologia, 75, 81–95, 1980.
Marzin, A., Archaimbault, V., Belliard, J., Chauvin, C., Delmas, F., and Pont, D.: Ecological assessment of running waters: do macrophytes, macroinvertebrates, diatoms and fish show similar responses to human pressures?, Ecol. Indic., 23, 56–65, 2012.
10
McBride, M., Cully-Heisson, W., and Rizzo, D. M.: Riparian reforestation and channel change: a case study of two small tributaries to sleepers river, Northeastern Vermont, USA, Geomor-phology, 102, 445–459, 2008.
McCormick, D. P. and Harrison, S. S. C.: Direct and indirect effects of riparian canopy on juvenile Atlantic salmon, Salmo salar, and brown trout, Salmo trutta, in south-west Ireland, Fish.
15
Manag. Ecol., 18, 444–455, 2011.
Meyer, J. L., Sale, M. J., Mulholland, P. J., and Poff, N. L.: Impacts of climate change on aquatic ecosystem functioning and health, J. Am. Water Resour. As., 35, 1373–1386, 1999.
Oregon Department of Forestry: Forest Practice Administrative Rules and Forest Practices Act, chap. 629, 1–88, 2010.
20
Pedersen, M. L.: Effects of channelisation, riparian structure and catchment area on physical habitats in small lowland streams, Fund. Appl. Limnol., 174, 89–99, 2009.
Pedersen, M. L., Friberg, N., and Larsen, S. E.: Physical habitat structure in Danish lowland streams, River Res. Appl., 20, 653–669, 2004.
Pedersen, M. L., Baattrup-Pedersen, A., and Wiberg-Larsen, P.: Økologisk overv ˚agning i
25
vandløb og p ˚a vandløbsnære arealer under NOVANA 2004–2009, 5. udgave, Danmarks Miljøundersøgelser, Aarhus Universitet, Teknisk anvisning nr. 21, 146 pp., 2007 (in Danish). Phillips, E. C.: Habitat preference of aquatic macroinvertebrates in an east Texas sandy stream,
Oikos, 18, 1–11, 2003.
Quinn, J. M., Steele, G. L., Hickey, C. W., and Vickers, M. L.: Upper thermal tolerances of twelve
30
HESSD
10, 6081–6106, 2013Riparian forest as a management tool
P. B. Kristensen et al.
Title Page
Abstract Introduction
Conclusions References
Tables Figures
◭ ◮
◭ ◮
Back Close
Full Screen / Esc
Printer-friendly Version Interactive Discussion
Discussion
P
a
per
|
Dis
cussion
P
a
per
|
Discussion
P
a
per
|
Discussio
n
P
a
per
Root, T. L., Price, J. T., Hall, K. R., Schneider, S. H., Rosenzweig, C., and Pounds, J. A.: Fingerprints of global warming on wild animals and plants, Nature, 421, 57–60, 2003. Rostgaard, S. and Jacobsen, D.: Respiration rate of stream insects measured in situ along
a large altitude range, Hydrobiologia, 549, 79–98, 2005.
Roy, A. H., Faust, C. L., Freeman, M. C., and Meyer, J. L.: Reach-scale effects of riparian forest
5
cover on urban stream ecosystems, Can. J. Fish. Aquat. Sci., 62, 2312–2329, 2005.
Snedecor, G. W. and Cochran, W. G.: Statistical Methods, Iowa State University Press, Ames, 1989.
Sridhar, V., Sansone, A. L., LaMarche, J., Dubin, T., and Lettenmaier, D. P.: Prediction of stream temperature in forested watersheds, J. Am. Water Resour. As., 40, 197–213, 2004.
10
Stewart, T. and Comeau, N.: GO 4723: Stage en milieu de travail, Unpublished Report, Dept. of Geography, Universit ´e de Moncton, NB, Canada, 1996.
Stoddard, J. L., Larsen, D. P., Hawkins, C. P., Johnson, R. K., and Norris, R. H.: Setting ex-pectations for the ecological condition of streams: the concept of reference condition, Ecol. Appl., 16, 1267–1276, 2006.
15
Vannote, R. L., Minshall, G. W., Cummins, K. W., Sedell, J. R., and Cushing, C. E.: The river continuum concept, Can. J. Fish. Aquat. Sci., 37, 130–137, 1980.
Walker, B., Steffan, W., Canadell, J., and Ingram, J. S. I.: The Terrestrial Biosphere and Global Change: Implications for Natural and Managed Ecosystems, Cambridge University Press, Cambridge, 439 pp., 1999.
20
Warfe, D. M. and Barmuta, L. A.: Habitat complexity mediates food web dynamics in a freshwa-ter macrophyte community, Oecologia, 150, 141–154, 2006.
Webb, B. W., Hannah, D. M., Moore, R. D, Brown, L. E., and Nobilis, F.: Recent advances in stream and river temperature research, Hydrol. Process., 22, 902–918, 2008.
Welles, J. M. and Norman, J. M.: Instrument for indirect measurement of canopy architecture,
25
Agron. J., 83, 818–825, 1991.
HESSD
10, 6081–6106, 2013Riparian forest as a management tool
P. B. Kristensen et al.
Title Page Abstract Introduction Conclusions References Tables Figures ◭ ◮ ◭ ◮ Back Close
Full Screen / Esc
Printer-friendly Version Interactive Discussion Discussion P a per | Dis cussion P a per | Discussion P a per | Discussio n P a per |
Table 1.Physical characteristics (means with range) of forested and open reaches. Also in-cluded are mean air temperatures (◦
C) in July from the open and forested reach at each stream and canopy cover (%). Bold (=the highest value) indicates a significant difference (at 5 % level) between forested and open reaches within the same stream.
River Linaa River Urlev Voel Brook Storkesig Brook River Gudenaa
Open Forest Open Forest Open Forest Open Forest Open Forest
July air Temperature (◦ C) 17.7 5–28 17.4 5–28 19.8 6–30 18.1 8–28 18.1 4–29 18.1 5–28 21.5 5–29 17.5 8–27 18.2 4–32 17.8 5–29
Discharge (L s−1) 27 132 35 18 449
Canopy cover (%) 80 92 67 89 61 77 27 93 49 81
Velocity (m s−1) 0.17 0.22 0.63 0.18 0.19 0.23 0.30 0.29 0.24 0.29
Width (m) 1.6
1–3 2 1.3–3 2.9 2–6 5.4 3.7–6.9 1.6 1.1–2 1.9 0.9–3.2 1.2 0.8–1.5 2.3 1.4–4.9 3.3 2.8–3.7 4.1 3.5–5
Depth (cm) 20
5–50 10 1–50 30 4–120 21 2–64 12 5–30 21 5–51 9 3–30 8 4–30 48 11–82 42 13–75 W/D 6.7 2–22 18.1 2.3–40 9.5 4–24 28.7 2.5–64 6.2 0.4–9 12.6 0.3–34 6 0.7–9 31.3 0–24 6.5 4–8.9 5.8 0.1–9 Bank height (cm) 142
70–240 70 50–95 99 55–180 89 55–140 72 25–110 69 30–130 64 25–145 83 45–180 102 70–145 113 85–245 Bank slope (◦
) 54 15–90 58 10–90 34,5 10–90 64 20–90 66 10–90 68.5 10–120 45 10–115 36 10–90 65 20–90 46 15–90
Boulders (%) 2.9
8–18 2.8 0–16 32.2 0–50 17.9 6–38 10.5 0–33 7.8 0–29 12.6 0–31 10.9 0–25 0 0
Coarse gravel (%) 11.8 0–33 15.8 0–41 2.4 0–20 21.6 0–30 22.8 6–71 16.3 0–31 16.1 0–33 25.1 7–33 0 0
Fine gravel (%) 8.5 0–30 12.5 0–35 0.9 0–8 20.6 10–28 21.5 0–71 17.4 0–31 17.9 5–29 23.4 13–29 0 0
Sand (%) 39
7–83 42.4 8–83 11.4 0–38 24.6 11–33 34.1 18–71 32.7 13–71 21.6 5–38 24 12–38 93.2 71–100 96 71–100
Mud (%) 13.3
0–40 1.3 0–18 3.7 0–38 1.2 0–10 1.4 0–15 4 0–25 2.3 0–20 0.8 0–5 4 0–20 0
Debris (%) 31.6
0–71 23.1 0–45 0.3 0–6 12.1 0–30 12.3 0–30 16.5 0–32 9.4 0–33 13.9 0–38 9 0–20 0
Living roots (%) 7.8 0–27 1.8 0–16 0 1.6 0–8 8.4 0–22 5.1 0–20 6.7 0–20 1.1 0–5 0 3.1 0–28 Macrophytes (%) 11.9
HESSD
10, 6081–6106, 2013Riparian forest as a management tool
P. B. Kristensen et al.
Title Page
Abstract Introduction
Conclusions References
Tables Figures
◭ ◮
◭ ◮
Back Close
Full Screen / Esc
Printer-friendly Version Interactive Discussion
Discussion
P
a
per
|
Dis
cussion
P
a
per
|
Discussion
P
a
per
|
Discussio
n
P
a
per
Fig. 1. Mean temperature (left panel) and daily variation (right panel) for the five streams. From left to right the open stretch runs towards the shaded stretch. Because of the accuracy of ±0.07◦C of the loggers, and to clarify the results and ease interpretation, we only show
statistical differences when differences in temperature or amplitude among two neighboring loggers are 0.14◦
C or larger (indicated by∗
HESSD
10, 6081–6106, 2013Riparian forest as a management tool
P. B. Kristensen et al.
Title Page
Abstract Introduction
Conclusions References
Tables Figures
◭ ◮
◭ ◮
Back Close
Full Screen / Esc
Printer-friendly Version Interactive Discussion
Discussion
P
a
per
|
Dis
cussion
P
a
per
|
Discussion
P
a
per
|
Discussio
n
P
a
per
|
Fig. 2. Mean temperature change in July (◦
HESSD
10, 6081–6106, 2013Riparian forest as a management tool
P. B. Kristensen et al.
Title Page Abstract Introduction Conclusions References Tables Figures ◭ ◮ ◭ ◮ Back Close
Full Screen / Esc
Printer-friendly Version Interactive Discussion Discussion P a per | Dis cussion P a per | Discussion P a per | Discussio n P a per Open 0 5 10 15 20 25 30 Forest 0 5 10 15 20 25 30 River Linaa 0 5 10 15 20 25 30 0 5 10 15 20 25 30 River urlev T emperat ure 0 5 10 15 20 25 30 0 5 10 15 20 25 30 Voel Brook 0 5 10 15 20 25 30 July Augu st Septe mbe r Octob er Nove mbe r Decem ber Janua ry Februa
ry MarchAprilMa
y JuneJuly
0 5 10 15 20 25 30 Storkesig brook July Augu st Septe mbe r Octob er Nove mbe r Decem ber Janua ry Februa
ry MarchAprilMa
y JuneJuly
0 5 10 15 20 25 30 River Gudenaa