HESSD
8, 2103–2144, 2011Assimilating SAR-derived water
level data into a hydraulic model
L. Giustarini et al.
Title Page
Abstract Introduction
Conclusions References
Tables Figures
◭ ◮
◭ ◮
Back Close
Full Screen / Esc
Printer-friendly Version Interactive Discussion
Discussion
P
a
per
|
Dis
cussion
P
a
per
|
Discussion
P
a
per
|
Discussio
n
P
a
per
|
Hydrol. Earth Syst. Sci. Discuss., 8, 2103–2144, 2011 www.hydrol-earth-syst-sci-discuss.net/8/2103/2011/ doi:10.5194/hessd-8-2103-2011
© Author(s) 2011. CC Attribution 3.0 License.
Hydrology and Earth System Sciences Discussions
This discussion paper is/has been under review for the journal Hydrology and Earth System Sciences (HESS). Please refer to the corresponding final paper in HESS if available.
Assimilating SAR-derived water level data
into a hydraulic model: a case study
L. Giustarini1, P. Matgen1,4, R. Hostache1, M. Montanari1, D. Plaza2,
V. R. N. Pauwels2, G. J. M. De Lannoy2, R. De Keyser3, L. Pfister1, L. Hoffmann1, and H. H. G. Savenije4
1
Centre de Recherche Public – Gabriel Lippmann, D ´epartement Environnement et Agro-biotechnologies, Belvaux, Luxembourg
2
Laboratory of Hydrology and Water Management, Ghent University, Ghent, Belgium
3
Department of Electrical Energy – Systems and Automation, Ghent University, Ghent, Belgium
4
Water Resources Section, Faculty of Civil Engineering and Geosciences, Delft University of Technology, GA Delft, The Netherlands
Received: 4 February 2011 – Accepted: 8 February 2011 – Published: 25 February 2011 Correspondence to: L. Giustarini ([email protected])
HESSD
8, 2103–2144, 2011Assimilating SAR-derived water
level data into a hydraulic model
L. Giustarini et al.
Title Page
Abstract Introduction
Conclusions References
Tables Figures
◭ ◮
◭ ◮
Back Close
Full Screen / Esc
Printer-friendly Version Interactive Discussion
Discussion
P
a
per
|
Dis
cussion
P
a
per
|
Discussion
P
a
per
|
Discussio
n
P
a
per
|
Abstract
Satellite-based active microwave sensors not only provide synoptic overviews of flooded areas, but also offer an effective way to estimate spatially distributed river wa-ter levels. If rapidly produced and processed, these data can be used for updating hydraulic models in near real-time. The usefulness of such approaches with real event 5
data sets provided by currently existing sensors has yet to be demonstrated. In this case study, a Particle Filter-based assimilation scheme is used to integrate ERS-2 SAR and ENVISAT ASAR-derived water level data into a one-dimensional (1-D) hydraulic model of the Alzette River. Two variants of the Particle Filter assimilation scheme are proposed with a global and local particle weighting procedure. The first option finds 10
the best water stage line across all cross sections, while the second option finds the best solution at individual cross sections. The variant that is to be preferred depends on the level of confidence that is attributed to the observations or to the model. The results show that the Particle Filter-based assimilation of remote sensing-derived wa-ter elevation data provides a significant reduction to the model forecast uncertainty. 15
Moreover, it is shown that the periodical updating of hydraulic models through the pro-posed assimilation scheme leads to an improvement of model predictions over several time steps. However, the performance of the assimilation depends on the skill of the hydraulic model and the quality of the observation data.
1 Introduction
20
Synthetic Aperture Radar (SAR) is regarded as the most promising technology to mon-itor floods from space. Since the launch of the ENVISAT mission in 2002 and more recently the successful launches of the high–resolution COSMO Skymed, TerraSAR-X and Radarsat-2 missions in 2007, considerable progress has been made with respect to SAR-based flood delineation algorithms (e.g. Zwenzner and Voigt, 2009; Martinis 25
HESSD
8, 2103–2144, 2011Assimilating SAR-derived water
level data into a hydraulic model
L. Giustarini et al.
Title Page
Abstract Introduction
Conclusions References
Tables Figures
◭ ◮
◭ ◮
Back Close
Full Screen / Esc
Printer-friendly Version Interactive Discussion
Discussion
P
a
per
|
Dis
cussion
P
a
per
|
Discussion
P
a
per
|
Discussio
n
P
a
per
|
specifically developed for rapid, repeatable and reliable flood mapping. Remote sens-ing data have become more frequent and rapidly available and accuracies of SAR-derived flood detection have improved due to higher spatial resolutions and enhanced image processing algorithms. There is a growing pressure on the scientific community to find new ways to use the increased volume and accuracy of remote sensing data in 5
order to improve near real-time flood monitoring and prediction applications.
The retrieval of water level data by merging remote sensing-derived inundated areas with a digital elevation model (“indirect measuring technique”) can be viewed as a way to add value to remote sensing data for hydrological applications (e.g. Hostache et al., 2009; Raclot, 2006; Schumann et al., 2007). Direct measuring techniques such 10
as those from the proposed swath altimetry ‘Surface Water and Ocean Topography’ (SWOT) mission (Alsdorf et al., 2007) represent a potential enhancement of the indirect measuring techniques as they enable the systematic acquisition of elevation data of inland water surfaces with a reliable observation uncertainty of 50 cm. Both techniques enable the monitoring of changes in water volume in ways that are not possible using 15
hydrometric station data.
However, space-borne sensors provide instantaneous snap-shots of an area of the Earth’s surface, there is a need to combine remote sensing data sets with hydrologic-hydraulic prediction models to generate time-lapses of flooded surfaces. Sequential data assimilation methods can be used to integrate time-continuous model state fore-20
casts (e.g. soil moisture, surface water storage) with remote sensing observations as they become available. The quantification of uncertainty for all observations is a pre-requisite to any meaningful data assimilation study. To date, only a few studies have investigated the uncertainty description of remote sensing derived water stages. Ac-cording to Schumann et al. (2008), geo-location accuracy of the flood extent and pa-25
HESSD
8, 2103–2144, 2011Assimilating SAR-derived water
level data into a hydraulic model
L. Giustarini et al.
Title Page
Abstract Introduction
Conclusions References
Tables Figures
◭ ◮
◭ ◮
Back Close
Full Screen / Esc
Printer-friendly Version Interactive Discussion
Discussion
P
a
per
|
Dis
cussion
P
a
per
|
Discussion
P
a
per
|
Discussio
n
P
a
per
|
cumulative distribution functions (cdfs) of water elevation estimates. In the case study of the Alzette 2003 flood, the indirect water stage measuring technique yields cdfs that indicate non-normal distributions and skewness of the SAR-based water level es-timates for many cross-sections. Uncertainty of stage over the entire river reach was on the order of 2 m.
5
In situ measurements are routinely assimilated for hydrologic-hydraulic modelling ap-plications (e.g. Neal et al., 2007; Madsen and Skotner, 2005; Pauwels and De Lannoy, 2009). However, only a few studies have attempted to assimilate remote sensing-derived water stage data into hydraulic models. Matgen et al. (2007) used a direct in-sertion method that forced water stage data simulated by a hydraulic model to fall within 10
the confidence interval of ENVISAT and European Remote Sensing satellite (ERS-2) SAR-derived water stages. They showed that the insertion of remote sensing derived water levels increased the accuracy of modelled water levels. However, this version of a direct insertion method is not an optimal sequential assimilation method and ap-pears as a useful approach only if uncertainties associated with observation data are 15
much smaller than simulation uncertainties and distribution functions of observations are unknown.
Different variants of the Kalman filter present dynamic methods for merging uncertain simulation data with uncertain observations. Andreadis et al. (2007) and Biancamaria et al. (2010) successfully applied an ensemble Kalman filter (EnKF) to assimilate syn-20
thetic water level measurements from the proposed SWOT mission with simulations from the LISFLOOD-FP 2-D hydraulic model. Durand et al. (2008) assimilated virtual SWOT-derived water level observations into a hydraulic model of the Amazon River to improve the estimates of bathymetric depths by 84% compared to the model runs without assimilation.
25
HESSD
8, 2103–2144, 2011Assimilating SAR-derived water
level data into a hydraulic model
L. Giustarini et al.
Title Page
Abstract Introduction
Conclusions References
Tables Figures
◭ ◮
◭ ◮
Back Close
Full Screen / Esc
Printer-friendly Version Interactive Discussion
Discussion
P
a
per
|
Dis
cussion
P
a
per
|
Discussion
P
a
per
|
Discussio
n
P
a
per
|
was defined from the perturbations of this ensemble of water level estimates around the mean. Neal et al. (2009) only considered the measurement members with the smallest inter-quantile range over the ensemble at any river section. They argue that because of the spatial coverage offered by remote sensing it is not necessary to use all measurements. Following this approach, they showed that it is possible to significantly 5
reduce discharge and water level uncertainty of a hydraulic model by using ENVISAT Advanced SAR-derived water stage estimates.
Since the Gaussian error assumption may not be satisfied for most remote sensing observations of water stage, Matgen et al. (2010) proposed an assimilation scheme based on the Particle Filter (PF) as a possibility to relax the Gaussian assumption in 10
the EnKF while preserving its advantages. Their experiments showed that the PF is able to correct water depths from a corrupted 1-D hydrodynamic model by assimilating synthetic observations that are realistic in terms of accuracy for remote sensing-derived water levels. In this case, the PF leads to a significant increase of the accuracy and a reduction of the model forecast uncertainty. Matgen et al. (2010) further state that 15
problems related to a spatially and temporally variable non-Gaussian distribution of water level observations still need to be solved.
The objective of this paper is thus to examine the usefulness of currently available satellite data to update a hydraulic model in near real time, through a PF-based assim-ilation scheme. The specific objectives are: (1) to adapt the PF assimassim-ilation scheme in 20
order to deal with non-Gaussian distributions of remote sensing derived (RSD) water levels; (2) to deal with model structural errors and parameter uncertainties, proposing two variants of the PF; (3) to assess the usefulness of SAR data with respect to in situ hydrometric station data.
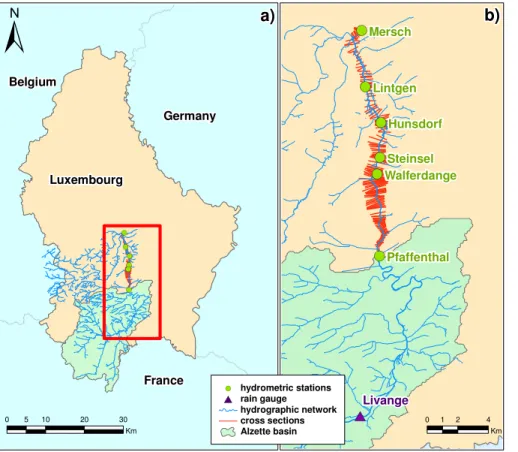
2 Study area and available data
25
The area of interest is situated in the Grand Duchy of Luxembourg (Fig. 1).
HESSD
8, 2103–2144, 2011Assimilating SAR-derived water
level data into a hydraulic model
L. Giustarini et al.
Title Page
Abstract Introduction
Conclusions References
Tables Figures
◭ ◮
◭ ◮
Back Close
Full Screen / Esc
Printer-friendly Version Interactive Discussion
Discussion
P
a
per
|
Dis
cussion
P
a
per
|
Discussion
P
a
per
|
Discussio
n
P
a
per
|
gauge located in Pfaffenthal. This produces the upstream boundary condition for the hydrodynamic model, which simulates the 19 km reach of the Alzette River between hy-drometric stations at Pfaffenthal and Mersch (Montanari et al., 2009). The river reach is described by 144 ground-surveyed and evenly spaced (∼130 m) channel cross sec-tions.
5
The investigated event was a flood recorded in January 2003. Hydrometric data were recorded every 15 min at six stream gauges interspersed throughout the 19 km reach (Pfaffenthal, Walferdange, Steinsel, Hunsdorf, Lintgen and Mersch). Moreover, information about the maximum water level reached along the river during the flood was available, as measured by means of a theodolite (altimetric accuracy around±2 cm) at 10
distributed points across the floodplain. The availability of in situ data not only allows evaluating the results of the assimilation of remote sensing data, but also helps to contrast the use of space-based and in situ based water level monitoring in a data assimilation exercise. The comparison of results provides insights on the advantages and limitations of each data set.
15
This paper makes use of the actual measured precipitation rate to drive the hydro-logic model: hourly rainfall data observed in Livange between the 1st and the 7th of January 2003 are available. Contrary to Neal et al. (2009), who used predictions of convective and stratiform precipitation and evaporation, in this case the forcings of the hydrologic model can be considered as the best available representation of the rain 20
field, potentially leading to a more accurate basin response. The set-up of this case study can be viewed as a realistic representation of an operational application of the proposed methodology.
Two subsequent SAR images, acquired at two distinct stages of the 2003 flood event have been used in this study: one was acquired by the ERS-2 satellite during the rising 25
HESSD
8, 2103–2144, 2011Assimilating SAR-derived water
level data into a hydraulic model
L. Giustarini et al.
Title Page
Abstract Introduction
Conclusions References
Tables Figures
◭ ◮
◭ ◮
Back Close
Full Screen / Esc
Printer-friendly Version Interactive Discussion
Discussion
P
a
per
|
Dis
cussion
P
a
per
|
Discussion
P
a
per
|
Discussio
n
P
a
per
|
to retrieve the water stages (Schumann et al., 2009). RSD observations of the water stages in the river were retrieved from the two available images, which have a spatial resolution of 12.5 m: in other words, at each cross section more or less independent water stages were observed.
2.1 Uncertainty assessment for RSD water stages
5
Different approaches can be used to estimate spatially distributed water levels and their associated uncertainties from a sequence of wet/dry flood edges extracted from radar imagery and fused with a DEM.
Schumann et al. (2008) and Hostache et al. (2009) proposed procedures to esti-mate uncertainty associated with RSD water stage data using a Monte Carlo-based 10
statistical analysis. Both approaches take into account different sources of uncertainty (i.e. parameters of image segmentation algorithm, co-registration of geo-information layers, accuracy of digital elevation model) that affect the retrieval of water eleva-tion data from remote sensing imagery. First, flood extension limits with their re-spective geo-location uncertainty are derived from a SAR image using a radiometric 15
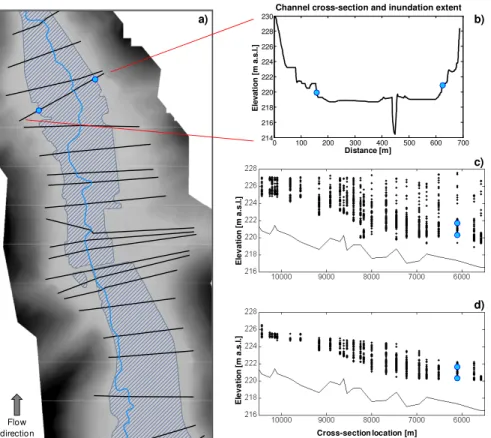
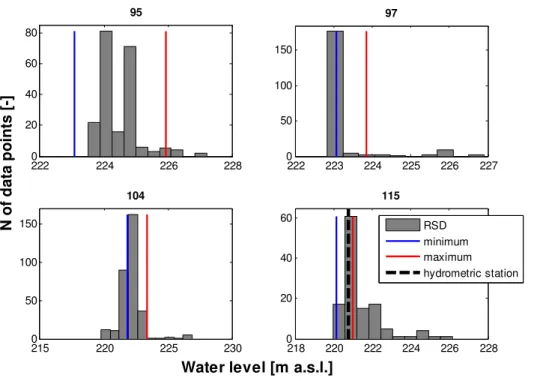
thresholding-based procedure. Next, the ensemble of flood boundaries is superim-posed on a DEM in order to estimate water levels. The method takes into account the uncertainty stemming from the underlying DEM and ultimately provides empirical dis-tribution functions of water level data from space at every river cross section (Fig. 3). In assimilation studies, this approach thus potentially allows exploiting the full empirical 20
distribution of observed water levels. However, the resulting uncertainty can be very high (Fig. 3). Moreover the distribution functions often exhibit bias and skewness, es-pecially in the vicinity of steep embankments. All of these factors render the use of the empirical distribution functions in data assimilation studies problematic.
In order to reduce the estimation uncertainty, all water level estimates were hydrauli-25
HESSD
8, 2103–2144, 2011Assimilating SAR-derived water
level data into a hydraulic model
L. Giustarini et al.
Title Page
Abstract Introduction
Conclusions References
Tables Figures
◭ ◮
◭ ◮
Back Close
Full Screen / Esc
Printer-friendly Version Interactive Discussion
Discussion
P
a
per
|
Dis
cussion
P
a
per
|
Discussion
P
a
per
|
Discussio
n
P
a
per
|
stage estimates within the floodplain. Knowing that the water level decreases from up-stream to downup-stream, an algorithm imposed the following two constraints on the water stage estimate intervals: (1) the upper bounds of the water stage intervals have to de-crease from upstream to downstream and (2) the lower bounds of the water stage intervals have to increase from downstream to upstream. This algorithm allowed a 5
significant reduction of the mean water level estimation intervals, as shown in the pan-els on the bottom right in Fig. 3. As a result, water level information was available as cross-section specific values of the possible local water levels and it is assumed that the “true” water level values are included among them.
3 Simulation design
10
Figure 4 shows the setup of the data assimilation experiments using event data. The methodology consists of assimilating remote sensing-derived water stage observations into an ensemble of 1-D hydraulic model integrations for a number of cross sections. The upstream boundary conditions (flow hydrographs) are produced using an ensem-ble of semi-distributed hydrologic model forecasts with perturbed parameter sets, initial 15
conditions and precipitation data.
3.1 Coupled hydrologic-hydraulic model
The semi-distributed hydrologic model is loosely coupled to a 1-D hydraulic model: the discharge hydrograph computed by the hydrologic model is used as upstream bound-ary condition to drive the hydraulic simulation, but the hydraulic model does not feed 20
back into the hydrologic model.
HESSD
8, 2103–2144, 2011Assimilating SAR-derived water
level data into a hydraulic model
L. Giustarini et al.
Title Page
Abstract Introduction
Conclusions References
Tables Figures
◭ ◮
◭ ◮
Back Close
Full Screen / Esc
Printer-friendly Version Interactive Discussion
Discussion
P
a
per
|
Dis
cussion
P
a
per
|
Discussion
P
a
per
|
Discussio
n
P
a
per
|
procedure of De Lannoy et al. (2007). Model parameters, forcings and initial conditions of the hydrologic model were perturbed in such a way that the ensemble mean dif-fers from the observation by a value that is equal to the time average of the ensemble spread (De Lannoy et al., 2006). More details on the ensemble generation and the verification measures that were used to monitor the ensemble spread can be found in 5
Matgen et al. (2010). The land surface model was initialized a month before the ana-lyzed flood event to allow spin up and balancing of the state variables in each ensemble member.
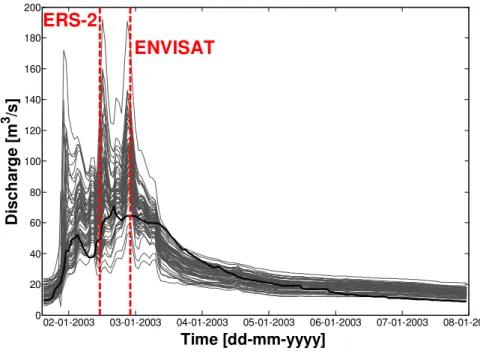
In order to represent the hydrodynamic model uncertainty, an ensemble of 64 up-stream boundary conditions (i.e. discharge) was generated with CLM 2.0, adopting 10
the same methodology as discussed in Matgen et al. (2010). The hydrographs are shown in Fig. 5 together with the 2 time steps of satellite overpasses for the 2003 flood event. As opposed to the synthetic experiment by Matgen et al. (2010), no artificial bias was added here to the output of the hydrologic model. However, we noticed that during the receding limb of the hydrograph, the ensemble did not bracket the observed 15
discharge, indicating a tendency of the hydrologic model to underestimate the inflow during that period. The ensemble of the hydraulic model realizations or particles (see box on top-left of Fig. 4) has been produced by integrating the hydrodynamic model with all the members of the discharge ensemble generated by the hydrologic model for the analysis period 1st January 15:00 – 7th January 23:00, 2003 (GMT+1).
20
The hydraulic model is implemented over a 19 km reach of the Alzette River between the gauging stations of Pfaffenthal and Mersch. Since flow direction in this area is mainly parallel to the channel, the 2-D flow field that is typically related to riverbank overtopping can be accurately approximated by a 1-D representation and thus, the Hydrologic Engineering Center River Analysis System – HEC-RAS (HEC-RAS 4.0, 25
HESSD
8, 2103–2144, 2011Assimilating SAR-derived water
level data into a hydraulic model
L. Giustarini et al.
Title Page
Abstract Introduction
Conclusions References
Tables Figures
◭ ◮
◭ ◮
Back Close
Full Screen / Esc
Printer-friendly Version Interactive Discussion
Discussion
P
a
per
|
Dis
cussion
P
a
per
|
Discussion
P
a
per
|
Discussio
n
P
a
per
|
3.2 Data assimilation algorithm
The data assimilation technique applied in this study is a sequential Particle Filter (PF), an ensemble filtering method that has its origin in Bayesian estimation. Unlike the widely used EnKF (e.g. Burgers et al., 1998; Evensen, 1994), which simplifies the recursive estimation by assuming a Gaussian distribution for state variables, the PF 5
relaxes the need for restrictive assumptions regarding the shape of the probability den-sity functions and can easily manage the propagation of a non-Gaussian distribution through nonlinear hydrologic and hydrodynamic models (Moradkhani, 2008). In the PF the assumption of Gaussianity is relaxed and the fundamental idea is to represent the required posterior density by a set of properly weighted samples (Smith et al., 2008), 10
named particles, and to compute the estimate based on these samples and weights.
3.2.1 Sequential Importance Sampling (SIS)
The simplest implementation of the PF is based on the Sequential Importance Sam-pling (SIS) method (see box in the middle of Fig. 4). Each particle consists of a possible value of the state. The filtering density is approximated by a discrete distribution, whose 15
support is the set of particles. The probability mass assigned to each particle is pro-portional to that particle’s weight, which, in turn, is propro-portional to the likelihood of the observation at the assimilation time step (Fearnhead, 2002).
In this case study, a particle represents the water surface line resulting from one hydrodynamic model run at the assimilation time stept=k, and the number of state 20
variables corresponds to the number of cross sections. The particles are sampled di-rectly from the state-space to represent the posterior probability, and a weight is com-puted for each particle according to the information contained in the RSD water level observations. In this case study, the SIS algorithm was implemented using two different distribution functions that are characteristic for the data sets at hand. A local weight, 25
HESSD
8, 2103–2144, 2011Assimilating SAR-derived water
level data into a hydraulic model
L. Giustarini et al.
Title Page
Abstract Introduction
Conclusions References
Tables Figures
◭ ◮
◭ ◮
Back Close
Full Screen / Esc
Printer-friendly Version Interactive Discussion
Discussion
P
a
per
|
Dis
cussion
P
a
per
|
Discussion
P
a
per
|
Discussio
n
P
a
per
|
Section 2.1.2 describes an approach for retrieving for each cross section an interval of possible water stage values. In this case the most appropriate way to assimilate the observation data is the application of a uniform distribution whose boundaries are the derived maximum and the minimum water stage estimate. Therefore, the likelihood or weight,wi ,j, of the water level, xi ,j, simulated by particle i at cross section j for the 5
time-step of the observation acquisition is simply computed as:
wi ,j=
( 1
b−a fora j
≤xi ,j≤bj
0 forxi ,j< aj or xi ,j> bj (1)
wherex is the state vector of the state variables (simulated water stages at any cross sectionj for any particle i),a and b are the lower and upper observed endpoints or minimum and maximum, respectively, for any cross sectionj.
10
All assimilation experiments were also carried out using hydrometric station data as it allowed contrasting results obtained with relatively uncertain but densely distributed satellite-derived data with those obtained with accurate but poorly distributed in situ measurements. When assimilating data from these stations, a Gaussian distribution was used, assuming the recorded water level to be the mean of a normal distribution 15
whose shape is also defined by a pre-defined value of standard deviation (Matgen et al., 2010). Note that water stage estimates obtained from space-borne swath altimeters were assumed to be normally distributed as well (Andreadis et al., 2007). One weight, wi ,j, for any water level,xi ,j, simulated by particlei at cross sectionj for the time-step of the observation acquisition is therefore computed as:
20
wi ,j= 1
σ√2πe
−
xi ,j−µj2
2σ2 (2)
HESSD
8, 2103–2144, 2011Assimilating SAR-derived water
level data into a hydraulic model
L. Giustarini et al.
Title Page
Abstract Introduction
Conclusions References
Tables Figures
◭ ◮
◭ ◮
Back Close
Full Screen / Esc
Printer-friendly Version Interactive Discussion
Discussion
P
a
per
|
Dis
cussion
P
a
per
|
Discussion
P
a
per
|
Discussio
n
P
a
per
|
Regardless of the way the weights of the individual particles are computed (e.g. as-suming a normal or uniform distribution of residuals), the matrix of weights contains all local weights, wi ,j, that are obtained for any model run or particle i at all the No ob-served cross sectionsj. Subsequently, an overall likelihood of the water level globally simulated along the river reach for any particle or model run is computed by applying 5
the joint probability theory for independent variables:
wi= No Y
j=1
wi ,j (3)
whereNois the number of observations.
The resulting global weight is then normalized.
Wi= w i
Np P
i=1
wi
(4) 10
Npis the number of particles or water surface lines.
The probability obtained with the global weights at the previous steps allows comput-ing an expectation of the updated water stage as follows for the assimilation time-step k:
E(xk)=xexp=
Np X
i=1
xiWi (5)
15
3.2.2 Sequential Importance Resampling (SIR)
HESSD
8, 2103–2144, 2011Assimilating SAR-derived water
level data into a hydraulic model
L. Giustarini et al.
Title Page
Abstract Introduction
Conclusions References
Tables Figures
◭ ◮
◭ ◮
Back Close
Full Screen / Esc
Printer-friendly Version Interactive Discussion
Discussion
P
a
per
|
Dis
cussion
P
a
per
|
Discussion
P
a
per
|
Discussio
n
P
a
per
|
point estimate (Moradkhani et al., 2005). To avoid unnecessarily high computational resources, a resampling step is carried out to eliminate samples with low weight and to replicate samples with high weight. In other words, the HEC-RAS model is re-initialized at the time-step of the observation acquisition,k, replicating the water lines with higher weight (see box on the bottom of Fig. 4). The resampled particles have the 5
same weight, until the next assimilation step. The most common resampling scheme is the Sequential Importance Resampling (SIR) developed by Gordon et al. (1993). The authors refer to Moradkhani et al. (2005) and Weerts et al. (2006) for more detailed explanations of the SIR and its use in hydrologic applications.
It should be mentioned that resampling is independent of the proposal distribution 10
(Fearnhead, 2002) but it is also possible to implement a PF without resampling. In any case, the SIR algorithm also suffers from particle degeneracy. Smith et al. (2008) showed that the resampling step only reduces the degeneracy of the particles. More-over, a different problem may arise, known as sample impoverishment, causing parti-cles with high weight to be selected many times, which leads to a loss of diversity in the 15
sample. In fact, due to the discrete approximation of the filtering density, inaccuracies accumulate over many time steps and the result is often a clustering of particles in small areas of the state-space (Fearnhead, 2002).
The experimental set-up of this case study avoided the problem of sample impover-ishment through a loose coupling of the hydrologic and hydraulic model components. 20
Only the water levels were resampled, while the spread in the input data was main-tained. Therefore, even in the extreme case where a single particle was retained and replicated, the spread in the discharge hydrographs ensured that shortly after the as-similation a sufficient spread of the state variables was obtained. As in Matgen et al. (2010), at the assimilation time-step k, the estimate of the upstream water level 25
xexp1 (Eq. 5) was used to compute the corresponding estimate of the dischargeE
HESSD
8, 2103–2144, 2011Assimilating SAR-derived water
level data into a hydraulic model
L. Giustarini et al.
Title Page
Abstract Introduction
Conclusions References
Tables Figures
◭ ◮
◭ ◮
Back Close
Full Screen / Esc
Printer-friendly Version Interactive Discussion
Discussion
P
a
per
|
Dis
cussion
P
a
per
|
Discussion
P
a
per
|
Discussio
n
P
a
per
|
on bottom right of Fig. 4):
Q1
i =Q
1
i −
Q1k−E
Q1k
Qk1
·Q
1
i (6)
whereQ1iis the upstream discharge of particlei andQ1
i is the average, computed
dur-ing the analysis stepk, of the hydrograph ensemble. The forcing update was applied until the next assimilation time-step, based on the assumption that relative model er-5
rors remain constant and that correcting the inflows by the same relative error term at subsequent time steps will improve the accuracy of the model prediction.
3.3 Synthetic experiment vs. real-event case study
The set-up of the case study was very similar to the one presented for the synthetic experiment in Matgen et al. (2010), but there were some significant differences that 10
need to be highlighted.
3.3.1 First assumption: observations
In the synthetic experiment, one of the basic assumptions was that the observed and assimilated (synthetic) satellite water level data were unbiased and normally dis-tributed. In a real case study, the Gaussian assumption may not be satisfied for at least 15
some of the remote sensing-derived water stage observations. Examples of cross-section specific pdfs of RSD data retrieved with the procedure proposed by Schumann et al. (2008) are shown in Fig. 6. The data obtained from the first satellite overpass (ERS-2 on 2.01.2003 at 11.00 GMT+1) are given for four representative cross sections. As it can be seen, the data at each section exhibit a different pdf shape. Obviously, the 20
HESSD
8, 2103–2144, 2011Assimilating SAR-derived water
level data into a hydraulic model
L. Giustarini et al.
Title Page
Abstract Introduction
Conclusions References
Tables Figures
◭ ◮
◭ ◮
Back Close
Full Screen / Esc
Printer-friendly Version Interactive Discussion
Discussion
P
a
per
|
Dis
cussion
P
a
per
|
Discussion
P
a
per
|
Discussio
n
P
a
per
|
coherence concept (Hostache et al., 2009) are also shown. It can be seen from these results that a significant reduction of the water level estimation intervals was obtained (see also Fig. 3). Here we assume that within each interval the RSD water levels are uniformly distributed.
Furthermore, Fig. 6 highlights bias and skewness in the RSD data retrieved using the 5
first image. The RSD water levels at the first satellite overpass (ERS-2 on 2.01.2003 at 11.00 GMT+1) for the gauged cross section of Lintgen (named 115 in the hydraulic model) were not centered on the in situ water level measurements.. For this cross section and the considered time step, the RSD water levels showed a tendency to overestimate the actual water level. After applying the hydraulic coherence concept, the 10
plausible interval was significantly narrowed and, most importantly, included the ground “truth”. Therefore, the data assimilation algorithm was run assuming the uniform pdf to represent the statistical distribution of RSD water levels.
3.3.2 Second assumption: model
A further characteristic of the synthetic experiment by Matgen et al. (2010) was that 15
the hydraulic model was correct in it structure, parameter set and initial or analysis conditions. Therefore, the differences between observations and models only derived from inaccuracies in the input data (i.e. hydrographs at the upstream boundary). This means that, for a given forcing (Q), the model generally performs equally well (or poorly) at all cross sections along the river. In other words, due to the fact that the same model 20
is used both to generate the artificial satellite observations and to assimilate them, a model run that is good at a given cross section performs well at all the other cross sections.
In a real case study, model structure errors (e.g. 1-D flow approximation, errors in geometry) and parameter uncertainties (e.g. Manning’s roughness values), cause local 25
HESSD
8, 2103–2144, 2011Assimilating SAR-derived water
level data into a hydraulic model
L. Giustarini et al.
Title Page
Abstract Introduction
Conclusions References
Tables Figures
◭ ◮
◭ ◮
Back Close
Full Screen / Esc
Printer-friendly Version Interactive Discussion
Discussion
P
a
per
|
Dis
cussion
P
a
per
|
Discussion
P
a
per
|
Discussio
n
P
a
per
|
river reach but at the same time has a poor performance at a local level (i.e. at some cross sections).
In the present case study, the Manning friction coefficients for both the channel and the floodplain were calibrated by means of discharge measurements carried out in the period 2001–2009 along the river reach on the hydrometric stations of Pfaffenthal, 5
Steinsel, Hunsdorf and Lintgen. Measurements of both water levels and discharge taken at the same time allowed calibrating Manning’s roughness values for the four cited cross sections in the main channel. In particular, given the study’s focus on flood modelling, the calibration aimed to reproduce the highest measurements of discharge. For the calibration, parameter sets for the friction coefficient in the main channel 10
were generated within the values of 0.030–0.060 s m−1/3. The results of the model runs were compared with the field observations and the selected roughness value for each cross section was found by minimizing the difference between the rating curves derived from the ground observations and the internal HEC-RAS.
The calibration reproduced the high discharge values reasonably well, with Man-15
ning’s roughness coefficients set equal to 0.042, 0.044, 0.053 and 0.039 s m−1/3, for Pfaffenthal, Steinsel, Hunsdorf and Lintgen, respectively. The plots in Fig. 7 display the calibrated rating curves for the cross sections with available measurements. For the cross sections in between, the friction coefficient was linearly interpolated. It has to be noted that the distance between Pfaffenthal and Steinsel is nearly 8 km, which 20
is rather significant with respect to the total river reach length (19 km). Therefore we expect model errors to be higher in the upper part of the river reach. In particular, the cross section of Walferdange did not have measurement data and its friction value was deduced from the one in Steinsel, the nearest calibrated cross section. For the floodplain, a Manning’s coefficient equal to 0.184 s m−1/3was assumed (Montanari et 25
HESSD
8, 2103–2144, 2011Assimilating SAR-derived water
level data into a hydraulic model
L. Giustarini et al.
Title Page
Abstract Introduction
Conclusions References
Tables Figures
◭ ◮
◭ ◮
Back Close
Full Screen / Esc
Printer-friendly Version Interactive Discussion
Discussion
P
a
per
|
Dis
cussion
P
a
per
|
Discussion
P
a
per
|
Discussio
n
P
a
per
|
4 Results and discussion
The hydrodynamic model, built from the 144 surveyed cross sections, was used to simulate water levels along the river reach, considering as inputs the ensemble of 64 hydrographs generated by the CLM 2.0. At each satellite overpass, RSD water level estimated were assimilated into the coupled hydrologic-hydraulic model following 5
the procedure outlined in Sect. 3.2. The results are compared against in situ station data. In addition, some tests with assimilation of these station data are discussed for reference.
4.1 Global weighting procedure (gw)
4.1.1 Analysis step
10
When a satellite observation becomes available, weights are computed for all the sim-ulations at any cross section. A global weight is computed for every particle according to the procedure outlined in Sect. 3.2.1.
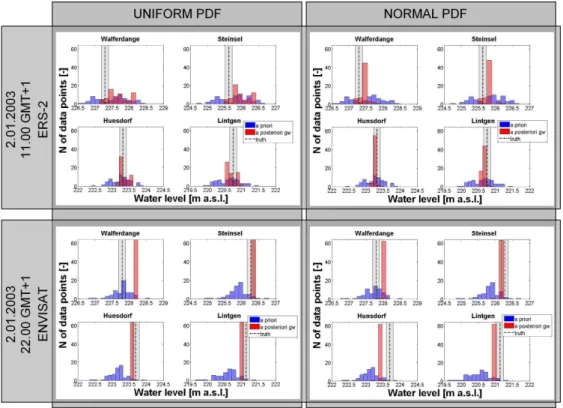
Figure 8 shows the histograms of computed water stages before and after resam-pling the particles during the assimilation procedure. The histograms shown here cor-15
respond to the four intermediate gauging stations in Walferdange, Steinsel, Hunsdorf and Lintgen. The two groups of four panels on top refer to the first satellite overpass (i.e. ERS-2 image), while those on the bottom refer to the second assimilation time step (i.e. ENVISAT image). On the left, the results of the assimilation corresponding to the application of the uniform pdf with the RSD observed data are displayed, while on 20
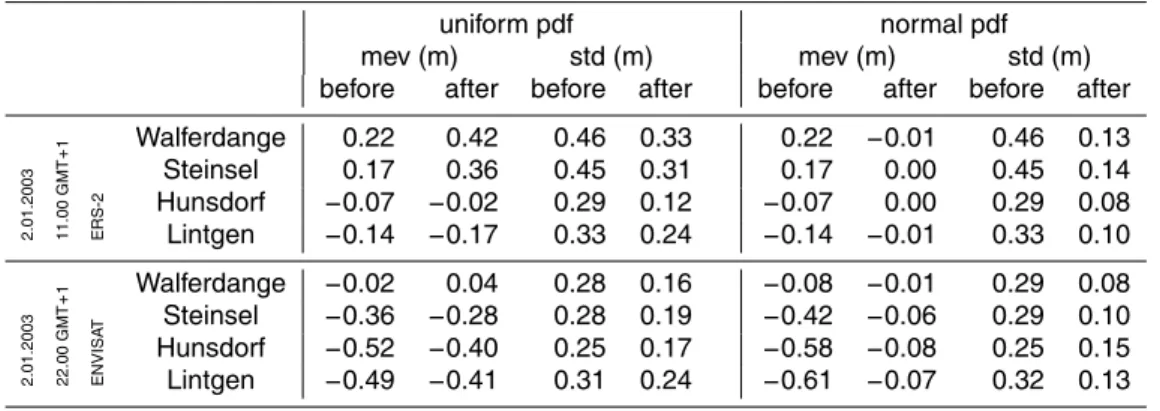
the right the reported outcome corresponds to the application of the normal pdf with the in situ data. The in situ measurements at six hydrometric stations located on the river reach also serve as validation datasets for assessing the performance of the anal-ysis. The performance of the assimilation is evaluated through the mean error value, the change in distance between the mean of the a priori histogram and the truth com-25
HESSD
8, 2103–2144, 2011Assimilating SAR-derived water
level data into a hydraulic model
L. Giustarini et al.
Title Page
Abstract Introduction
Conclusions References
Tables Figures
◭ ◮
◭ ◮
Back Close
Full Screen / Esc
Printer-friendly Version Interactive Discussion
Discussion
P
a
per
|
Dis
cussion
P
a
per
|
Discussion
P
a
per
|
Discussio
n
P
a
per
|
The standard deviation of the histogram both a priori and a posteriori is computed as a measure of the reduction of uncertainty in the water level at the assimilation time step. Considering the use of the uniform pdf (panels on the left side in Fig. 8), the results obtained via the assimilation of the intervals, defined by the maxima and minima of the retrieved water stages, show a significant reduction of the spread in the a posteriori 5
distribution of the simulated water stages. The reduction in uncertainty is evident for the first time step and becomes even more significant for the second. Moreover, at the time step of the ERS-2 image acquisition, at all the investigated cross sections the a posteriori distribution of water level estimates encompasses the truth. However, the spread reduction is most significant for cross sections in Hunsdorf and Lintgen, located 10
in the downstream part of the river, where most of the flooding occurred (i.e. where most observations of water stage are available). As a result of the analysis there is a decrease of the mean error value, changing from−0.07 to 0.02 m for Hunsdorf cross section and from −0.14 to −0.06 m for Lintgen. The decrease in terms of standard deviation (changing from 0.29 to 0.13 m and from 0.33 to 0.14 m for the two cross sec-15
tions, respectively) further outlines the positive effect that the assimilation procedure has at a local level. However, for the sections in Walferdange and Steinsel, both lo-cated in the upstream part of the river reach, we observe a tendency to overestimate the recorded stage data post assimilation. In both sections the mean error value in-creases, from 0.22 to 0.37 m in Walferdange and from 0.17 to 0.34 m in Steinsel. The 20
fact that the standard deviation is reduced merely illustrates that uncertainty, as it is defined here, only expresses model uncertainty and not truly probabilistic prediction limits of the assimilation procedure.
This limitation of the “global weighting procedure” is confirmed by the results ob-tained at the second assimilation time step. Overall, the assimilation of data retrieved 25
HESSD
8, 2103–2144, 2011Assimilating SAR-derived water
level data into a hydraulic model
L. Giustarini et al.
Title Page
Abstract Introduction
Conclusions References
Tables Figures
◭ ◮
◭ ◮
Back Close
Full Screen / Esc
Printer-friendly Version Interactive Discussion
Discussion
P
a
per
|
Dis
cussion
P
a
per
|
Discussion
P
a
per
|
Discussio
n
P
a
per
|
after this time step, while the mean error values are reduced to less than 10 cm for all cross sections, except Walferdange, where an overestimation remains apparent. On all other sections the a posteriori distribution includes the truth. It has to be ob-served that for Walferdange it was not possible to calibrate the roughness value of the hydraulic model, due to the unavailability of discharge measurements. Its Manning’s 5
coefficient was interpolated considering the values of the upstream and downstream cross sections. The poor quality of the model results at this cross section could thus be explained with a badly calibrated model. Moreover, as flooding only occurred on the downstream part of the river reach, there are no RSD observations available in the up-per part of the river (i.e upstream of the Steinsel cross section). These limitations partly 10
explain the difficulty the global weighting procedure has to select models that perform well along the entire river reach. This result shows that one of the main assumption of the synthetic experiment, namely that input data is the only source of error in hydraulic modelling, can no longer be maintained. Table 1 summarizes the results in terms of mean error and standard deviation values for the two assimilation time steps and the 15
two distribution functions.
Before applying and testing a procedure based on local weighting, an experiment was carried out with precise in situ measurements of water level, recorded at six cross sections along the river at the time of the two satellite overpasses. This test represents a circular way to operate, due to the fact that the same data set is used for assimi-20
lation and validation. However, the rationale behind this test is to distinguish model errors from observation errors. A good model is expected to provide results that are centred on the truth at every single cross section. In this experiment the normal pdf was used, assuming a standard deviation equal to 0.1 m to represent the uncertainty of the measurements. As can be seen from the panels on the right in Fig. 8, for the 25
HESSD
8, 2103–2144, 2011Assimilating SAR-derived water
level data into a hydraulic model
L. Giustarini et al.
Title Page
Abstract Introduction
Conclusions References
Tables Figures
◭ ◮
◭ ◮
Back Close
Full Screen / Esc
Printer-friendly Version Interactive Discussion
Discussion
P
a
per
|
Dis
cussion
P
a
per
|
Discussion
P
a
per
|
Discussio
n
P
a
per
|
very significant and only a limited number of particles are selected at any cross sec-tion. The results are surprisingly similar to those results obtained with the less accurate RSD observations. However, only in Steinsel did the assimilation methodology predict the truth, while for all other cross-sections the resampling of the particles either leads to a slight over- or underestimation. This indicates that no model run performs equally 5
well along the entire river reach. We assume that this is due to the fact that important sources of errors are not sufficiently well represented by the ensemble of model runs.
Table 1 summarises the information in terms of performance and standard deviation values for the two satellite acquisitions and the two distribution functions. From these results we conclude that the proposed PF-based filtering approach is an efficient tool 10
to assimilate observations described by characteristic distribution functions. However, the observed over- and underestimations are an indication that local inconsistencies persist in the calibrated model. This can lead to a sub-optimal functioning of the PF or indeed the rejection of all models: when one particle represents the water level over the whole reach as state vector and the weights are computed according to Eq. (3), 15
systematic model errors at a local scale heavily impact the weight that is attributed to individual particles. Rather than selecting and replicating the best particles over-all, the application of the joint probability theory for independent particles penalizes particles that have low weight at some locations. As a result, the global weighting procedure favours compromise solutions that provide acceptable results at all model 20
cross-sections. Therefore, it is important to bear in mind that the PF has been ini-tially designed for removing noise and not systematic errors. A pre-requisite for the application of the PF is thus to reduce systematic errors in the model prior to any data assimilation experiment.
4.1.2 Forecasting step
25
HESSD
8, 2103–2144, 2011Assimilating SAR-derived water
level data into a hydraulic model
L. Giustarini et al.
Title Page
Abstract Introduction
Conclusions References
Tables Figures
◭ ◮
◭ ◮
Back Close
Full Screen / Esc
Printer-friendly Version Interactive Discussion
Discussion
P
a
per
|
Dis
cussion
P
a
per
|
Discussion
P
a
per
|
Discussio
n
P
a
per
|
the stage hydrographs corresponding to the cross-section at Lintgen, when using the uniform pdf to assimilate the RSD observations. The performance of the forecast is illustrated considering the RMSE of the ensemble mean water stage,hass, with respect
to the recorded water stage htruth:
RMSE=
v u u u u t
tendw P
t=tass+d t
hass(t)−htruth(t)
2
tendw−tass
for (tass+d t)< tendw< tend (7)
5
which is computed over different time windows, starting from the first time step after the satellite overpass,tass+d t, and stopping attendw, gradually increasing withd t, the
time step of the simulation, in order to evaluate the usefulness of the assimilation as a function of the number of time steps following the analysis step (withtendcorresponding
to the last time step of the simulation). 10
As it can be seen from Fig. 9, after the ERS-2 satellite overpass, when the analysis step efficiently drags the simulated water level towards the observed water level, the RMSE is first close to zero before gradually increasing at subsequent time steps due to the predominant effect of the inflow condition. Although the relative error term was correctly inferred from satellite observations, it becomes obvious from Fig. 9 that the 15
proposed inflow correction model (Eq. 6) under-predicts simulation errors in the time window between the two satellite acquisitions. However, the forecasts with filter are consistently better than the open loop predictions for the first time steps. After the second acquisition the RMSE approaches zero and the error term in Eq. (6) leads to correct predictions for more than 5 h after the assimilation, as the error remains 20
constant for some time steps. Nevertheless, later on the application of a constant error prediction term for the inflow leads to wrong predictions, with an underestimation of the falling limb of the hydrograph. Hence, the analysis step is of fundamental importance in order to carry out an efficient inflow correction. Errors in the analysis propagate through the inflow correction model and this can significantly decrease model performance at 25
HESSD
8, 2103–2144, 2011Assimilating SAR-derived water
level data into a hydraulic model
L. Giustarini et al.
Title Page
Abstract Introduction
Conclusions References
Tables Figures
◭ ◮
◭ ◮
Back Close
Full Screen / Esc
Printer-friendly Version Interactive Discussion
Discussion
P
a
per
|
Dis
cussion
P
a
per
|
Discussion
P
a
per
|
Discussio
n
P
a
per
|
4.2 Local weighting procedure (lw)
4.2.1 Analysis step
As an alternative to the global weighting procedure, an approach based on local weight-ing has been developed and tested. In this procedure, each cross section has its own particle set, with as state vector the water levels at the cross section itself (i.e. the state 5
vector is a scalar). Each particle has its own weight, as required for the PF. This proce-dure is different from global weighting, where one particle has as state vector the water level over the whole reach.
Once again, the uniform distribution was used in the assimilation algorithm. We expect a local weighting based method to yield better results when model structural 10
and parameterization errors are present. However, this method will be rather sensitive to local observational errors. The results are given in Fig. 10. The histograms were obtained at four representative cross sections.
Using the uniform distribution together with the local weighting procedure, the re-duction of uncertainty is less evident than with the global weighting method. At each 15
cross section all particles that provide water stage estimates included in the RSD in-tervals are retained and equally weighted. As a result, the standard deviation values are generally higher than before. While the global weighting procedure applied to the ENVISAT-derived data led to the selection of only two particles, the application of a local weighting procedure causes many simulations to be retained at each cross sec-20
tion. For instance, in Lintgen after the second assimilation step the standard deviation is reduced to 0.01 using a global weight but only to 0.24 using local weights. All the a posteriori distributions include the truth, even if in Walferdange a tendency to over-estimate the truth persists. With respect to the mean error values, the two weighting approaches give comparable results at the first assimilation step. For the second satel-25
HESSD
8, 2103–2144, 2011Assimilating SAR-derived water
level data into a hydraulic model
L. Giustarini et al.
Title Page
Abstract Introduction
Conclusions References
Tables Figures
◭ ◮
◭ ◮
Back Close
Full Screen / Esc
Printer-friendly Version Interactive Discussion
Discussion
P
a
per
|
Dis
cussion
P
a
per
|
Discussion
P
a
per
|
Discussio
n
P
a
per
|
Finally, the assimilation was carried out using in situ water level measurements at six cross sections at the time of the two satellite overpasses (Fig. 10). Here we apply the local weighting procedure to compute the a posteriori histograms. As expected, this is the easiest setup for the assimilation algorithm to recognise the truth. For both time steps and in all the cross sections, the resampled particles encompass the truth. This 5
experiment shows that if observations are of high quality, the local weighting proce-dure yields very satisfactory results. Adopting a local weighting proceproce-dure significantly reduced model uncertainty, as demonstrated by the means of the global weighting ex-periment. However, as we suspect other sources of error than inflows (e.g. spatially varying friction parameters, intermediate inflows and/or errors in geometry) to be re-10
sponsible for contradicting results obtained in sub-reaches of the model domain, it has to be expected that these improvements cannot be maintained over many time steps. It is therefore recommended to use the results of the analysis to find the reasons for re-gionally conflicting results and to make use of such a diagnosis for improving the model in a more persistent way than through a mere re-initialization and inflow correction. 15
Considering the local weighting variant of the PF, Table 2 summarises the results in terms of mean error and standard deviation for the two time satellite acquisitions and for the two distribution functions.
4.2.2 Forecasting step
Figure 11 illustrates the performance of the forecasts considering the local weighting 20
procedure to assimilate the ground measurements recorded at six hydrometric sta-tions. It shows that when the analysis step gives good results (i.e. when the error term at the time of the observation is correctly estimated), the short-term forecasts with as-similation are improved. However, the limitation of a possible overcorrection of inflow persists as the inflow-corrected mid-term to long-term forecasts seem to have less skill 25
HESSD
8, 2103–2144, 2011Assimilating SAR-derived water
level data into a hydraulic model
L. Giustarini et al.
Title Page
Abstract Introduction
Conclusions References
Tables Figures
◭ ◮
◭ ◮
Back Close
Full Screen / Esc
Printer-friendly Version Interactive Discussion
Discussion
P
a
per
|
Dis
cussion
P
a
per
|
Discussion
P
a
per
|
Discussio
n
P
a
per
|
errors are difficult to predict as precipitation errors continuously add to model param-eter and model structural errors. This conclusion is in line with the findings of Matgen et al. (2010) who stated that because of the underlying assumption of constant relative errors, the inflow correction model is reliable only during flow recession periods.
5 Conclusions
5
Our case study illustrates advantages and drawbacks related to the application, in a quasi-operational context, of a PF-based assimilation of RSD water levels into a hydraulic model. Two variants of the PF, based respectively on local weighting and global weighting procedures, are proposed. In the global weighting procedure, a single particle contains water levels at all cross sections as state vector. Hence, the likelihood 10
for each particle is derived from its ability to correctly predict water levels along the entire river reach. The local weighting procedure attributes a separate particle set to each cross section (i.e. a single particle has the water level from one cross section as state vector) and thus associates likelihoods to each particle according to its ability to correctly predict water stage at a given cross section. The experiment concludes with 15
the following findings.
1. Matgen et al. (2010) demonstrated through a series of synthetic experiments with unbiased model forecasts and observations that a PF-based assimilation scheme enables the sequentially updating of flood forecasting models. The filter helps to correct for errors in the forcings and guides the recovery of the correct water depth over a 20
modelled river reach. In our real-event case study, even according to the best-case scenario when precise in situ measurements are assimilated into a hydraulic model, difficulties arise from the fact that model accuracy varies in space. This makes it difficult for a global weighting procedure to identify a model run that performs equally well at all cross sections. In fact, input errors are not the only source of model uncertainty. 25
HESSD
8, 2103–2144, 2011Assimilating SAR-derived water
level data into a hydraulic model
L. Giustarini et al.
Title Page
Abstract Introduction
Conclusions References
Tables Figures
◭ ◮
◭ ◮
Back Close
Full Screen / Esc
Printer-friendly Version Interactive Discussion
Discussion
P
a
per
|
Dis
cussion
P
a
per
|
Discussion
P
a
per
|
Discussio
n
P
a
per
|
a local weighting procedure seems to be the preferred solution when dealing with a model that cannot be well calibrated and when observations with a very low uncertainty are to be assimilated.
2. Before any assimilation of data, the set-up and calibration of the hydraulic model are of paramount importance. It is important to bear in mind that the Particle Filter 5
(and also the Kalman Filter) is a method designed to filter noise, not systematic errors. Our results show that this is particularly important when in situ measurements are assimilated, because there is a significant risk that the performance of a model at a local level is not truly representative for its behaviour at a regional level. In this case, the assimilation can potentially lead to a deterioration of model performance.
10
3. The quality of the observation data is the second factor that largely determines the effectiveness of the filter. In instrumented basins with well-calibrated models, the hydrodynamic model uncertainty appears low compared to currently available remote sensing observation uncertainty. Nevertheless, our experiment shows that forecast im-provements are achievable with currently existing SAR data. However, there is a need 15
to take into account the possibility of bias in the observation data. A PF that is based on a local weighting procedure is the preferred solution when assimilating unbiased and/or very precise observations as it helps to identify the true water surface line at the time of data acquisition. In ungauged basins where RSD water levels are the only available data source, the PF with a global weighting procedure is to be recommended. 20
Certainly, methodologies for retrieving water levels from remote sensing observations need to be improved. The availability of VHR SAR satellites and the global DEMs with increased accuracy can be used to further reduce uncertainty and bias of such data sets. The hydraulic coherence concept that was applied in this study is another step forward. We show that observational uncertainty can be significantly reduced by us-25
ing hydraulic rules governing overland flow in a floodplain to correct unrealistic water levels.
HESSD
8, 2103–2144, 2011Assimilating SAR-derived water
level data into a hydraulic model
L. Giustarini et al.
Title Page
Abstract Introduction
Conclusions References
Tables Figures
◭ ◮
◭ ◮
Back Close
Full Screen / Esc
Printer-friendly Version Interactive Discussion
Discussion
P
a
per
|
Dis
cussion
P
a
per
|
Discussion
P
a
per
|
Discussio
n
P
a
per
|
are precise and provide time-continuous data. However, the data sets are only avail-able as point measurements, which can lead to the over- or under-correction of mod-els. The RSD information provides distributed water level information over many cross sections. The uncertainty of water stage estimates inferred from currently operating sensors, as well as sampling rates of 24 h and less, represent serious limitations. The 5
combination of both data sets likely yields the best assimilation results but more re-search on this topic is required.
5. For operational applications, it is important to achieve a persistent improvement of the forecasts as a result of a PF-based assimilation of water stage data. Due to the dominant effect of the upstream boundary condition, this means that the results of the 10
analysis need to be used to correct erroneous inflow data. Although this study focused mainly on an improvement of the analysis step, two limitations of the initially proposed inflow correction model are highlighted. First, it becomes obvious that the analysis step is of paramount importance for carrying out an efficient inflow correction: errors in the analysis propagate through the inflow correction model, thereby potentially degrading 15
the skill of the forecasts. Second, the error prediction model itself needs to be reviewed as it is clearly shown that the underlying assumption of constant relative errors is not valid, especially during the rising limb of the hydrograph. Hence, we advocate the development of enhanced error prediction models.
Acknowledgements. This study was part of the HYDRASENS project, financed by the National
20
Research Fund (FNR) of the Grand Duchy of Luxembourg and the Belgian Federal Science Pol-icy Office in the framework of the STEREO II research programme (Contract nr. SR/00/100). Renaud Hostache was funded by the FLOODTRACKER project, financed by the National Re-search Fund (FNR) of the Grand Duchy of Luxembourg in the framework of the CORE reRe-search programme. Gabri ¨elle De Lannoy is a postdoctoral research fellow of the Research Foundation
25
HESSD
8, 2103–2144, 2011Assimilating SAR-derived water
level data into a hydraulic model
L. Giustarini et al.
Title Page
Abstract Introduction
Conclusions References
Tables Figures
◭ ◮
◭ ◮
Back Close
Full Screen / Esc
Printer-friendly Version Interactive Discussion
Discussion
P
a
per
|
Dis
cussion
P
a
per
|
Discussion
P
a
per
|
Discussio
n
P
a
per
|
References
Alsdorf, D. E., Rodriguez, E., and Lettenmaier, D. P.: Measuring surface water from space, Rev. Geophys., 45, RG2002, doi:10.1029/2006RG000197, 2007.
Andreadis, K. M., Clark, E. A., Lettenmaier, D. P., and Alsdorf, D. E.: Prospects for river dis-charge and depth estimation through assimilation of swath-altimetry into a rasterbased
hy-5
drodynamics model, Geophys. Res. Lett., 34, L10403, doi:10.1029/2007GL029721, 2007. Biancamaria, S., Durand, M., Andreadis, K. M., Bates, P. D., Booneg, A., Mognard, N. M.,
Rodriguez, E., lsdorf, D. E., Lettenmaier, D. P., and Clark, E. A.: Assimilation of virtual wide swath altimetry to improve Arctic river modeling, Remote Sense. Environ., 115 (2), 373–381, doi:10.1016/j.rse.2010.09.008, 2010.
10
Burgers, G., Leeuwen, P. J. V., and Evensen, G.: Analysis scheme in the ensemble Kalman filter, Mon. Weather Rev., 126, 1719–1724, 1998.
Dai, Y., Zeng, X., Dickinson, R. E., Baker, I., Bonan, G., Bosilovich, M., Denning, S., Dirmeyer, P., Houser, P., Niu, G., Oleson, K., Schlosser, C. A. and Yang, Z.-L.: The common land model (CLM), B. Am. Meteorol. Soc., 84, 1013–1023, 2003.
15
De Lannoy, G. J. M., Houser, P. R., Pauwels, V. R. N., and Verhoest, N. E. C.: Assessment of model uncertainty for soil moisture through ensemble verification, J. Geophys. Res., 111, D10101, doi:10.1029/2005JD006367, 2006.
De Lannoy, G. J. M., Houser, P. R., Pauwels, V. R. N., and Verhoest, N. E. C.: State and bias estimation for soil moisture profiles by an ensemble Kalman filter: Effect of assimilation depth
20
and frequency, Water Resour. Res., 43(6), W06401, doi:10.1029/2006WR005100, 2007. Durand, M., Andreadis, K. M., Alsdorf, D. E., Lettenmaier, D. P., Moller, D., and Wilson, M. D.:
Estimation of bathymetric depth and slope from data assimilation of swath altimetry into a hydrodynamic model, Geophys. Res. Lett., 35, L20401, doi:10.1029/2008GL034150, 2008. Evensen, G.: Sequential data assimilation with a nonlinear quasi-geostrophic model using
25
Monte Carlo methods to forecast error statistics, J. Geophys. Res., 99 (C5), 10143–10162, 1994.
Fearnhead, P.: Markov chain Monte Carlo, sufficient statistics, and particle filters, J. Comput. Graph. Stat., 11, 848–862, 2002.
Gordon, N., Salmond, D., and Smith, A. F. M.: Novel approach to nonlinear and non-Gaussian
30
Bayesian state estimation, in: Pr. Inst. Electr. Elect., Part F, 140, 107–113, 1993.