Copyright: Wyższa Szkoła Logistyki, Poznań, Polska
Citation: Kaushik S.P., Kaushik V.K., 2014, A simplified, result oriented supplier performance management system testing
LogForum
> Scientific Journal of Logistics <
http://www.logforum.net p-ISSN 1895-2038 e-ISSN 1734-459X
A SIMPLIFIED, RESULT ORIENTED SUPPLIER PERFORMANCE
MANAGEMENT SYSTEM TESTING FRAMEWORK FOR SME
Satya Parkash Kaushik
1, Veerender Kumar Kaushik
21) Singhania University, Pacheri Bari, Rajasthan, India, 2) School of Management of the Technological Institute of Textile&Sciences, Bhiwani, Haryana, India
ABSTRACT. Background: Supplier performance management continues to be a significant concern for small & medium enterprises (SME). How can small & medium enterprises better position themselves to check and sustain actual supplier performance improvement? A key framework is the establishment of a value-added supplier performance audit program that places significant emphasis on supplier performance controls. A value-added supplier audit program can help SME mitigate business and regulatory risk while reducing the cost of poor quality (COPQ). Thus a good supplier performance audit program is the cornerstone of supplier performance management integrity.
Methods: By acknowledging and addressing the challenges to an effective supplier Performance Audit program, this paper proposes an objective framework of supplier performance audit program, built on a strong, yet versatile statistical methodology - Analysis of variance (ANOVA). This performance audit framework considers process definition, standardization, review of the contemporary literature on ANOVA & its practical application in supplier performance scorecard of one of the reputed Sports Goods Industry in India.
Results and conclusions: The advantages of this framework are that: it simultaneously considers multiple supplier performance in multiple time frames and effectively identifies the differences across the suppliers in terms of their performance. Through this framework the organization will be able to increase the odds of performing a predictable and successful implementation of a value-added supplier performance audit.
Key words: Supplier Performance Audit, Analysis of variance (ANOVA), Supply Chain, Supplier Performance Management, Small & Medium Enterprises (SME).
INTRODUCTION
"In today's competitive environment it is impossible to successfully produce high quality, low cost products without considering a satisfactory set of suppliers" [Soukoup 1987]. Supplier performance can be used as a strategic accelerator and to achieve cost savings, which can average 8 percent to 12 percent of total procurement costs, and as much as 40 percent for some categories. Also, Supplier performance improvements can result in shorter cycle times, product innovation and increased revenue. "However, without careful
monitoring of supplier performance, a firm is unable to accurately assess whether its current suppliers are meeting the needs of the firm, and suppliers are unable to respond to unexpressed partner needs" [Simpson et al. 2002].
Purpose
performance management. If we do not have a value-added supplier performance management system audit framework in place: How do we know whether used supplier performance management system is really genuine & effective? A value-added supplier performance management system audit framework can help organizations mitigate business and regulatory risk while reducing the cost of poor quality (COPQ). Generally such supplier performance management system audit framework comprises of buyer, supplier and sourcing, supplier performance management system, supplier scorecard and framework for auditing the effect of used supplier performance management system on supplier scores.
In this paper, the author worked as Head Of Materials Department for more than 14 years has proposed & tested an objective framework of supplier performance management audit framework, built on a strong, yet versatile statistical methodology - the 1-Way within Subjects ANOVA in a reputed Indian Sports Goods Industry to audit effectiveness & genuineness of used supplier performance management system (IV) on suppliers performance scores (DV) & move for further improvement suggestions for effective supplier performance management to reduce cost and support a lean procurement organization. This framework audited that implemented supplier performance management system really did have an effect on Supplier Performance Score. Did Supplier Performance Score significantly increase or decrease? Was there no difference in Supplier Performance Score?
Question
Whether a suggested supplier performance management system audit framework, built on the repeated 1-Way within Subjects ANOVA methodology effectively audits the effect of used supplier performance management system (IV) on supplier performance score (DV)?
Hypothesis
It is hypothesized that suggested supplier performance management system audit framework, built on the repeated 1-Way within Subjects ANOVA methodology effectively
audits the effect of used supplier performance management system (IV) on supplier performance score (DV)?
LITERATURE REVIEW
"Supply Management is a process responsible for the development & management of a firm's total supply system - focuses heavily on the strategic aspects of the key elements of a firm's supply system" [Dobler et al. 2002]. As noted by fine, "supply chains are the next source of competitive advantage" [Fine, Charles 1999]. "Supply chain consists of all stages involved, directly or indirectly, in fulfilling a customer request. The supply chain not only includes the manufacturer & suppliers, but also transporters, warehouses, retailers & customer themselves" [Chopra et al. 2001]. "Good supplier performance is a key ingredient in enabling firms to achieve business performance excellence. But how can firms manage or even influence the performance of outside suppliers? Supplier performance management (SPM) is being widely adopted as a method to understand and improve the performance of the extended enterprise" [Gordon, Sherry 2010]. "Firms should concentrate on strategic suppliers who are integrated business partners as well as core suppliers, who require integration and development plus other suppliers that may supply a high-cost or high-risk item" [Barrett et al. 2008].
statistical methodology - the 1-Way within Subjects ANOVA to audit effectiveness & genuineness of used supplier performance management system (IV) on suppliers performance scores (DV).
The One-Way within Subjects ANOVA
What is ANOVA?
Sometimes, we want to compare more than two groups of data to see if more than two groups of data are different. While T-tests could be used to compare the means from two different groups of data, but we need a different kind of test when comparing three or more groups. Here 1-Way ANOVA test can be used to compare three or more groups or conditions in an experiment. A 1-Way ANOVA can find out if the means for each group / condition are significantly different from one another or if they are relatively the same. If the means are significantly different, it means that the variable being manipulated, Independent Variable (IV), had an effect on the variable being measured, i.e. Dependent Variable (DV). In statistics, one-way analysis of variance (abbreviated one-way ANOVA) is a technique used to compare means of two or more samples (using the F distribution). This technique can be used only for numerical data [Howell 2002]. ANOVA allows one to determine whether the differences between the samples are simply due to random error (sampling errors) or whether there are systematic treatment effects that cause the mean in one group to differ from the mean in another.
Variables in ANOVA
Dependent variable is metric.
Independent variable(s) is nominal with two or more levels - also called treatment, manipulation, or factor.
Types of ANOVA
One-way ANOVA: only one independent variable (IV) with two or more levels.
Two-way ANOVA: two independent variables (IV) each with two or more levels
With ANOVA, a single metric dependent variable is tested as the outcome of a treatment or manipulation whereas with MANOVA (Multiple Analysis of Variance), two or more metric dependent variables are tested as the outcome of a treatment(s). The one-way ANOVA is used to test for differences among at least three groups, since the two-group case can be covered by a t-test [Gosset 1908]. ANOVA can analyze and compare the variability of scores between conditions and within conditions. This helps us find out if the IV had a significant effect on the DV.
1-Way between Subjects ANOVA
This type of test is used to compare more three or more groups of participants that are not related in any way. The groups of participants are independent from one another. So, participants in one group have no relationship to participants in the other groups.
1-Way within Subjects ANOVA:
This type of test used to compare three or more groups of participants that are related in some way. There are many ways that participants in three or more groups can be related. One of the most common ways is that participants in the first group are the same as participants in the other groups. This is called a repeated measures design. Such type of 1-Way within Subjects ANOVA is also called as 1-Way Repeated Measures ANOVA.
1-Way Repeated Measures ANOVA:
A One-Way within subjects design involves repeated measures on the same participants (multiple observations overtime, or under experimental different conditions). The simplest example of one-way repeated measures ANOVA is measuring before and after scores for participants who have been exposed to some experiment (before-after design).
Example: An employer measures employee's knowledge before a workshop and two weeks after the workshop. One-way repeated measure ANOVA and paired-samples t test are both appropriate for comparing scores in before and after designs for the same participants. Repeated-measures designs are considered an extension of the paired-samples t test when comparisons between more than two repeated measures are needed.
Hypotheses
Generally Software like SPSS conducts 3 types of tests if the within-subject factor has more than 2 levels:
− The standard univariate F within subjects
− Alternative univariatetests, and
− Multivariate tests [SPSS Statistics Base 17.0]
All these repeated measures ANOVA tests evaluate the same hypothesis:
− The population means are equal for all levels of a factor.
− H0: μ1= μ 2= μ 3…
− HA: At least one treatment or observation mean (μ) is different from the others.
Sources of Variability
In repeated measure ANOVA, there are three potential sources of variability:
− treatment variability: between columns,
− within subjects variability: between rows,
− -random variability: residual (chance factor or experimental error beyond the control of a researcher).
A repeated measure design is powerful, as it controls for all potential sources of variability.
The test statistic for the repeated measures ANOVA has the following structure:
Variance between treatments
F =
Variance within subjects + variance expected by chance/error
The logic of Repeated measures ANOVA Any differences that are found between treatments can be explained by only two factors:
− Treatment Effect.
− Error or Chance
This formula leaves only differences due to treatment/observation effects.
A large F value indicates that the differences between treatments/observations are greater than would be expected by chance or error alone.
Univariate Assumptions
Normality Assumption: ANOVA is a relatively robust procedure with respect to violations of the normality assumption [Kirk 1995].
− The dependent variable is normally distributed in the population for each level of the within-subject factor.
− With a moderate or large sample sizes the test may still yield accurate p values even if the normality assumption is violated except in thick tailed and heavily skewed distributions.
− A commonly accepted value for a moderate sample size is 30 subjects.
Sphericity Assumption: Non-Robust
− The population variance of difference scores computed between any two levels of a within subject factor is the same.
− The sphericity assumption (also known as the homogeneity of variance of differences assumption) is meaningful only if there are more than two levels of a within subjects factor.
− Sphericity can be tested using the Mauchly's Sphericity Test. If the Chi-Square value obtained is significant, it means that the assumption was violated.
− If the sphericity assumption is not met, some procedures can be used to correct the univariate results. These tests make adjustments to the degrees of freedom in the denominator and numerator.
− SPSS, computes alternative test which are all robust to violations of the sphericity assumption as they adjust the degrees of freedom to account for any violations of this assumption. These tests include: Univariate Tests (e.g. Greenhouse-Geisser Epsilon, Huynh-Feldt Epsilon, Lower-bound Epsilon) and multivariate tests (e.g. Pillai's Trace, Wilk's Lambda, Hotelling's Trace, Roy's Largest Root
Independence Assumption: Non-Robust
-The cases represent a random sample from the population and there is no dependency in the scores between participants.
− Dependency can exist only across scores for individuals.
− Results should be not trusted if this assumption is violated.
Multivariate Assumptions
Normality Assumption: Non-Robust
− The difference scores are multivariately normally distributed in the population.
− To the extent that population distributions are not normal and the sample sizes are small, especially in thick tailed or heavily skewed distributions, the p values are invalid.
Independence Assumption: Non-Robust
− The difference scores for any one subject are independent from the scores for any other subjects.
− The test should not be used if the independence assumption is violated.
METHODOLOGICAL APPROACH
This Research Study has been undertaken as a single exploratory descriptive case study
with a deductive positivism approach with Cosco (India) Limited, One of the reputed sports & fitness goods company from India for empirical study of whether suggested supplier performance management system audit framework, built on the repeated 1-Way within Subjects ANOVA methodology, effectively audited the effect of used supplier performance management system (IV) on supplier performance score (DV)?
Data Collection
In this study, both primary and secondary data were collected through direct & participant observation along with documentation & archival records. The primary data were gathered through observations noted from company considered for this case study based research study. The secondary data were collected from literature, journals, articles & internet.
The interpretation of results of the researches can be conducted by various types of tests. The test ANOVA was chosen. It is not the best one from mathematical point of view, but it is the simplest one and at the same time enables the unambiguous interpretation of results. It was stated during the preliminary researches.
EMPIRICAL STUDY
Auditing Supplier Performance Management System by ANOVA
There are three steps in conducting the one-way repeated measures ANOVA:
− Conducting the omnibus test
− Conducting polynomial contrasts (compares the linear effect, quadratic effect, and cubic effect).
− Conducting pair wise comparisons.
Required input
Repeated measurements variables: the variables containing the different measurements. Note that the order in which we select the variables is important for trend analysis.
Required output
In this experiment, required output is to know if there is a significant difference between the data collected from each condition/quarter. We want to know revised supplier performance management system really does have an effect on Supplier Performance Score. Does Supplier Performance Score significantly increase or decrease. Is there no difference in Supplier Performance Score?
Let's Start Auditing/Testing
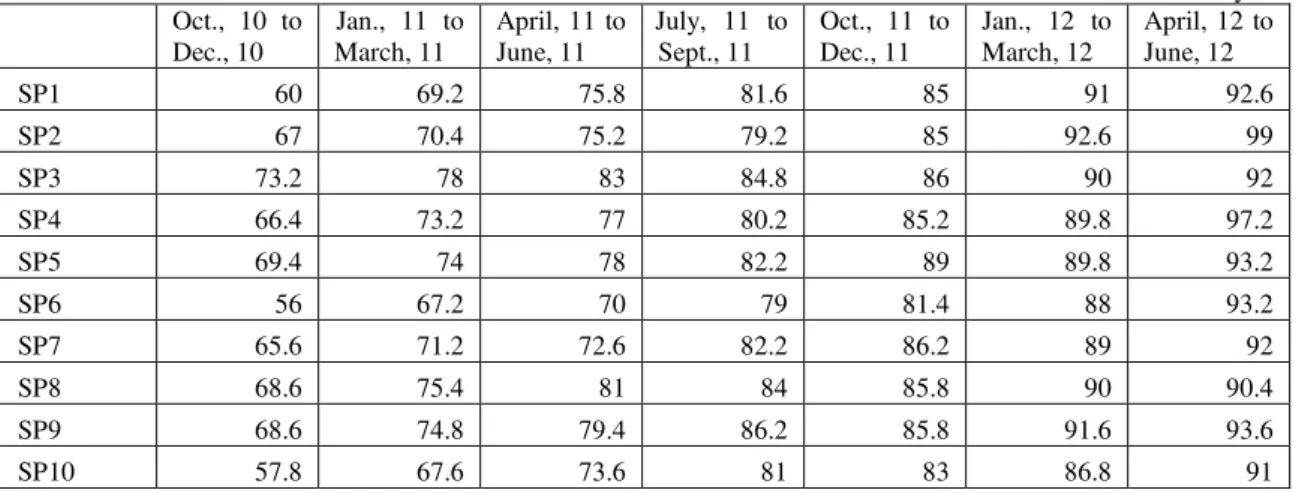
To answer the research question posed in Introduction i.e. "Whether suggested supplier performance management system audit framework, built on the repeated 1-Way within Subjects ANOVA methodology effectively audit the effect of used supplier performance management system (IV) on supplier performance score (DV)?", an hypothesis was created that It is hypothesized that suggested supplier performance management system audit framework, built on the repeated 1-Way within Subjects ANOVA methodology effectively audit the effect of used supplier performance management system (IV) on supplier performance score (DV)? Here we want to audit the effect of revised supplier performance management system (IV) on supplier performance score (DV). This is now being tested by using Repeated One-Way Analysis of Variance (ANOVA). To test this hypothesis we check & test the effect of revised supplier performance management system (IV) on supplier performance score (DV) by collecting data set of supplier performance score in six continuous quarters (i.e. groups) from January, 2011 to June, 2012 on a sample of 10 main critical suppliers / participants in comparison with performance score in quarter from October, 2010 to December, 2010 on account of earlier supplier performance management system.
Table 1. Data set of supplier performance score Tabela 1. Dane oceny dostawcy Oct., 10 to
Dec., 10
Jan., 11 to March, 11
April, 11 to June, 11
July, 11 to Sept., 11
Oct., 11 to Dec., 11
Jan., 12 to March, 12
April, 12 to June, 12
SP1 60 69.2 75.8 81.6 85 91 92.6
SP2 67 70.4 75.2 79.2 85 92.6 99
SP3 73.2 78 83 84.8 86 90 92
SP4 66.4 73.2 77 80.2 85.2 89.8 97.2
SP5 69.4 74 78 82.2 89 89.8 93.2
SP6 56 67.2 70 79 81.4 88 93.2
SP7 65.6 71.2 72.6 82.2 86.2 89 92
SP8 68.6 75.4 81 84 85.8 90 90.4
SP9 68.6 74.8 79.4 86.2 85.8 91.6 93.6
The null hypothesis:
There is no difference of supplier performance score among the 7 treatment different quarters (Levels) i.e. have the same μ.
Ho: μ1 = μ2 = μ 3 = μ5 = μ6 = μ7
If we reject null, and say, "no," then at least one of the populations has a different μ.
The alternative hypothesis:
The alternative hypothesis, Ha: Is the opposite of the null hypothesis. i.e. there is difference of supplier performance score among the 7 treatment different quarters (Levels) i.e. either greater μ or lesser μ than
one another subsequently but not have the same μ.
Ha: μ1≠ μ2≠ μ 3 ≠μ5≠μ6≠μ7
Ha: μ1 > μ2 > μ 3 > μ5 > μ6 > μ7 or
Ha: μ1 < μ2 < μ 3 < μ5 < μ6 < μ7
A one-tailed test uses an alternate hypothesis that states either H1: μ > μ0 or H1:
μ < μ0, but not both. But here we want to test
both, using the alternate hypothesis H1: μ≠μ0,
then we need to use a two-tailed test.
Here We have used a statistical program MedCalc Software version 12 - © 1993-2012 for conducting Repeated measures analysis of variance to check & test the effect of revised supplier performance management system (IV) on supplier performance score (DV) by analyzing the data set of supplier performance score from 7 different quarters (Levels) from October, 2010 to June, 2012 of 10 critical supplier firms.
Enter Data
Data for the different variables are entered in different columns of The MedCalc spreadsheet. In the top row of the columns we entered the names of the variables / groups i.e. OCT 10 TO DEC 10, JAN 11 TO MARCH 11, APRIL 11TO JUNE 11, JULY 11 TO SEPT 11, OCT 11 TO DEC 11, JAN 12 TO MARCH
12, APRIL 12 TO JUNE 12. All data for each selected critical supplier or case are entered in one row in the spreadsheet. A variable name should not include any spaces. We can use the underscore character _ to separate words, e.g. GRADE_A. Also the following characters cannot be used in a variable's name: - + / * = < > ^ ( ) $ " ' : ,.
Save the data
Save data file to a meaningful place with a meaningful name. We decided to save our data file as "Effect of simple & superior supplier performance management system on supplier performance score Data.sav."
Statistical Analyses
After entering the data in the spreadsheet, we selected an option in the Statistics menu to perform repeated measures analysis of variance statistical analysis
Results
"A one-way within subjects (or repeated measures) ANOVA was conducted with 10 main critical suppliers to compare the effect of revised supplier performance management system (IV) on supplier performance score (DV) in seven continuous quarters (i.e. groups) from October, 2010 to June, 2012."
Repeated measures ANOVA
Number of subjects 10
Sphericity
the data are to being spherical. Both the Greenhouse-Geisser and Huynh-Feldt estimates are used as a correction factor that is applied to the degrees of freedom used to calculate the P-value for the observed value of F.
Table 2. Estimates (epsilon) of sphericity Tabela 2. Szacowana sferowość
Method Epsilon
Greenhouse-Geisser (1959)
0.358 Huynh-Feldt (1976) 0.473 Source: MedCalc Software version 12
The Greenhouse-Geissure & Huynh-Feldt estimates can both range from the lower bound (the most severe departure from sphericity possible given the data) and 1 (no departure from sphericity at all)
Here above reported epsilon by MedCalc is not closure to 1, resulting in to heterogeneity of variances of differences instead of homogeneity of variances. It means that variances are not equal across groups or samples.
Test of Within-Subjects Effects
Table 3. Displaying the variation attributed to "Factor" and "Residual" variation Tabela 3. Zmienność wartości „Factor” i „Residual” Source of variation Sum of Squares DF Mean Square F P
Factor Sphericity assumed Greenhouse-Geisser Huynh-Feldt
5975.792 5975.792 5975.792
6 2.147 2.841
995.965 2783.403 2103.430
158.04 158.04 158.04
<0.001 <0.001 <0.001 Residual Sphericity assumed
Greenhouse-Geisser Huynh-Feldt
340.299 340.299 340.299
54 19.322 25.569
6.302 17.612 13.309
Source: MedCalc Software version 12
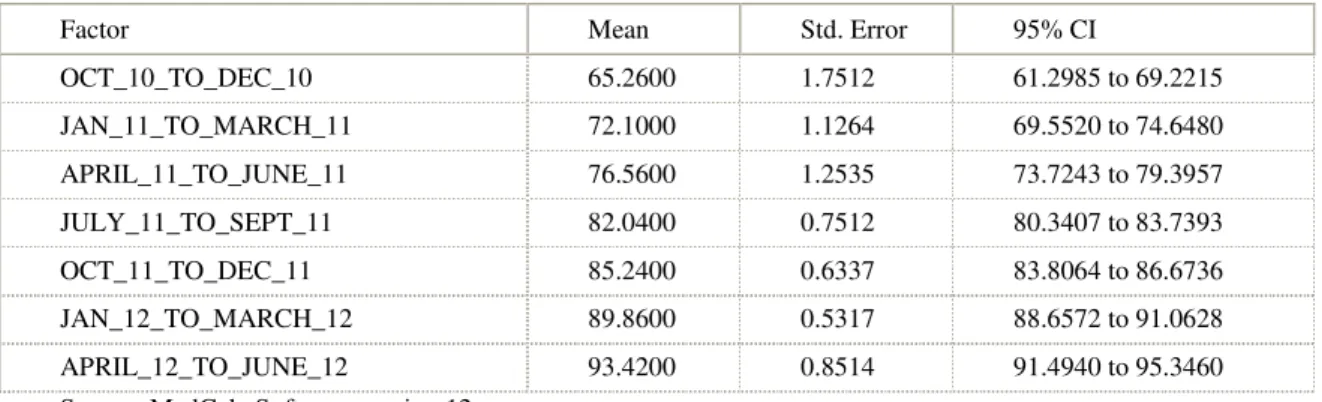
Table 4. Summary of The within-subjects factors Tabela 4. Podsumowanie czynników within subjects
Factor Mean Std. Error 95% CI
OCT_10_TO_DEC_10 65.2600 1.7512 61.2985 to 69.2215
JAN_11_TO_MARCH_11 72.1000 1.1264 69.5520 to 74.6480
APRIL_11_TO_JUNE_11 76.5600 1.2535 73.7243 to 79.3957
JULY_11_TO_SEPT_11 82.0400 0.7512 80.3407 to 83.7393
OCT_11_TO_DEC_11 85.2400 0.6337 83.8064 to 86.6736
JAN_12_TO_MARCH_12 89.8600 0.5317 88.6572 to 91.0628
APRIL_12_TO_JUNE_12 93.4200 0.8514 91.4940 to 95.3460
Source: MedCalc Software version 12
In table 3, the variation attributed to "Factor" and "Residual" variation is displayed. If the P-value next to "Factor" is low (P<0.05) it can be concluded that there is significant difference between the different measurements. MedCalc produces two corrections based upon the estimates of sphericity by Greenhouse and Geisser (1958)
Here the P value is less than a preset threshold value 0.05. It can be concluded that the populations really are significantly different.
Within-subjects factors
The within-subjects factors are summarized in the following table 4 with Mean, Standard Error and 95% Confidence Interval.
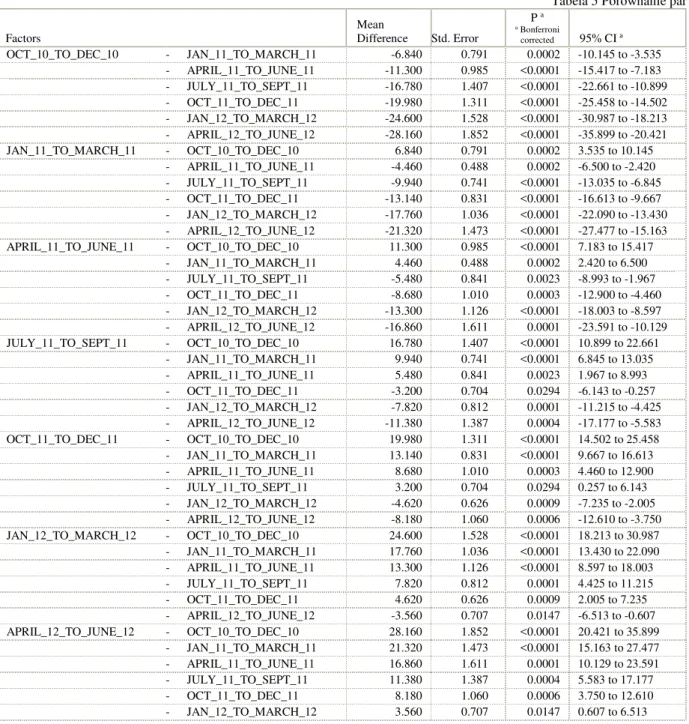
Table 5. The Pair wise comparisons table Tabela 5 Porównanie par
Factors
Mean
Difference Std. Error
P a
a Bonferroni
corrected 95% CI a
OCT_10_TO_DEC_10 - JAN_11_TO_MARCH_11 -6.840 0.791 0.0002 -10.145 to -3.535
- APRIL_11_TO_JUNE_11 -11.300 0.985 <0.0001 -15.417 to -7.183
- JULY_11_TO_SEPT_11 -16.780 1.407 <0.0001 -22.661 to -10.899
- OCT_11_TO_DEC_11 -19.980 1.311 <0.0001 -25.458 to -14.502
- JAN_12_TO_MARCH_12 -24.600 1.528 <0.0001 -30.987 to -18.213
- APRIL_12_TO_JUNE_12 -28.160 1.852 <0.0001 -35.899 to -20.421
JAN_11_TO_MARCH_11 - OCT_10_TO_DEC_10 6.840 0.791 0.0002 3.535 to 10.145
- APRIL_11_TO_JUNE_11 -4.460 0.488 0.0002 -6.500 to -2.420
- JULY_11_TO_SEPT_11 -9.940 0.741 <0.0001 -13.035 to -6.845
- OCT_11_TO_DEC_11 -13.140 0.831 <0.0001 -16.613 to -9.667
- JAN_12_TO_MARCH_12 -17.760 1.036 <0.0001 -22.090 to -13.430
- APRIL_12_TO_JUNE_12 -21.320 1.473 <0.0001 -27.477 to -15.163
APRIL_11_TO_JUNE_11 - OCT_10_TO_DEC_10 11.300 0.985 <0.0001 7.183 to 15.417
- JAN_11_TO_MARCH_11 4.460 0.488 0.0002 2.420 to 6.500
- JULY_11_TO_SEPT_11 -5.480 0.841 0.0023 -8.993 to -1.967
- OCT_11_TO_DEC_11 -8.680 1.010 0.0003 -12.900 to -4.460
- JAN_12_TO_MARCH_12 -13.300 1.126 <0.0001 -18.003 to -8.597
- APRIL_12_TO_JUNE_12 -16.860 1.611 0.0001 -23.591 to -10.129
JULY_11_TO_SEPT_11 - OCT_10_TO_DEC_10 16.780 1.407 <0.0001 10.899 to 22.661
- JAN_11_TO_MARCH_11 9.940 0.741 <0.0001 6.845 to 13.035
- APRIL_11_TO_JUNE_11 5.480 0.841 0.0023 1.967 to 8.993
- OCT_11_TO_DEC_11 -3.200 0.704 0.0294 -6.143 to -0.257
- JAN_12_TO_MARCH_12 -7.820 0.812 0.0001 -11.215 to -4.425
- APRIL_12_TO_JUNE_12 -11.380 1.387 0.0004 -17.177 to -5.583
OCT_11_TO_DEC_11 - OCT_10_TO_DEC_10 19.980 1.311 <0.0001 14.502 to 25.458
- JAN_11_TO_MARCH_11 13.140 0.831 <0.0001 9.667 to 16.613
- APRIL_11_TO_JUNE_11 8.680 1.010 0.0003 4.460 to 12.900
- JULY_11_TO_SEPT_11 3.200 0.704 0.0294 0.257 to 6.143
- JAN_12_TO_MARCH_12 -4.620 0.626 0.0009 -7.235 to -2.005
- APRIL_12_TO_JUNE_12 -8.180 1.060 0.0006 -12.610 to -3.750
JAN_12_TO_MARCH_12 - OCT_10_TO_DEC_10 24.600 1.528 <0.0001 18.213 to 30.987
- JAN_11_TO_MARCH_11 17.760 1.036 <0.0001 13.430 to 22.090
- APRIL_11_TO_JUNE_11 13.300 1.126 <0.0001 8.597 to 18.003
- JULY_11_TO_SEPT_11 7.820 0.812 0.0001 4.425 to 11.215
- OCT_11_TO_DEC_11 4.620 0.626 0.0009 2.005 to 7.235
- APRIL_12_TO_JUNE_12 -3.560 0.707 0.0147 -6.513 to -0.607
APRIL_12_TO_JUNE_12 - OCT_10_TO_DEC_10 28.160 1.852 <0.0001 20.421 to 35.899
- JAN_11_TO_MARCH_11 21.320 1.473 <0.0001 15.163 to 27.477
- APRIL_11_TO_JUNE_11 16.860 1.611 0.0001 10.129 to 23.591
- JULY_11_TO_SEPT_11 11.380 1.387 0.0004 5.583 to 17.177
- OCT_11_TO_DEC_11 8.180 1.060 0.0006 3.750 to 12.610
- JAN_12_TO_MARCH_12 3.560 0.707 0.0147 0.607 to 6.513
Source: MedCalc Software version 12
Pair wise comparisons
In the Pair wise comparisons table, the different measurements are compared to each other. The mean difference with standard error, P-value, and 95% Confidence Interval of the
difference is given. Bonferroni correction for multiple comparisons is applied for P-values and confidence intervals.
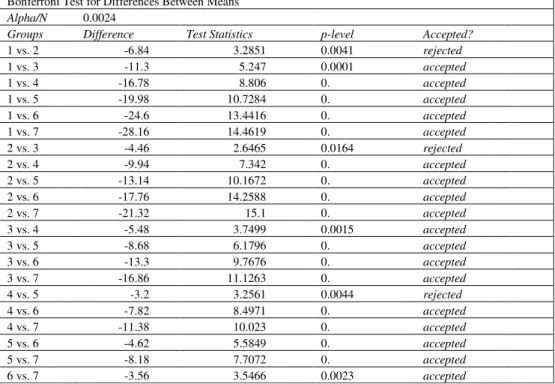
made (or confidence intervals to be constructed) while still assuring an overall confidence coefficient is maintained. Which pairs of means differ? The Bonferroni Test is
done for all possible pairs of means [http://www2.fiu.edu/].
Table 6. Bonferroni Test for Differences between Means Tabela 6. Test Bonferroni dla różnicy średnich
Bonferroni Test for Differences Between Means
Alpha/N 0.0024
Groups Difference Test Statistics p-level Accepted?
1 vs. 2 -6.84 3.2851 0.0041 rejected
1 vs. 3 -11.3 5.247 0.0001 accepted
1 vs. 4 -16.78 8.806 0. accepted
1 vs. 5 -19.98 10.7284 0. accepted
1 vs. 6 -24.6 13.4416 0. accepted
1 vs. 7 -28.16 14.4619 0. accepted
2 vs. 3 -4.46 2.6465 0.0164 rejected
2 vs. 4 -9.94 7.342 0. accepted
2 vs. 5 -13.14 10.1672 0. accepted
2 vs. 6 -17.76 14.2588 0. accepted
2 vs. 7 -21.32 15.1 0. accepted
3 vs. 4 -5.48 3.7499 0.0015 accepted
3 vs. 5 -8.68 6.1796 0. accepted
3 vs. 6 -13.3 9.7676 0. accepted
3 vs. 7 -16.86 11.1263 0. accepted
4 vs. 5 -3.2 3.2561 0.0044 rejected
4 vs. 6 -7.82 8.4971 0. accepted
4 vs. 7 -11.38 10.023 0. accepted
5 vs. 6 -4.62 5.5849 0. accepted
5 vs. 7 -8.18 7.7072 0. accepted
6 vs. 7 -3.56 3.5466 0.0023 accepted
Source: MedCalc Software version 12
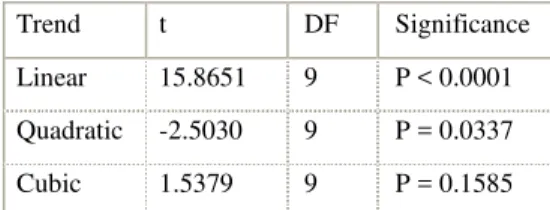
Trend analysis
The Trend analysis table shows whether the measurements show a linear or non-linear (quadratic, cubic) trend. A trend analysis tests the hypotheses that the means of the ordered groups change in a linear or higher order (e.g., quadratic or cubic) fashion.
Table 7. Trend analysis table Tabela 7. Analiza trendu Trend t DF Significance Linear 15.8651 9 P < 0.0001 Quadratic -2.5030 9 P = 0.0337 Cubic 1.5379 9 P = 0.1585 Source: MedCalc Software version 12
There is a significant linear trend (p <0.0001), shown in Figure 1. The results suggest that there is a linear increase in population means.
Decision Rule
The populations really are significantly different. Therefore our Null Hypothesis Ho:
μ1 = μ2 = μ3 = μ4 = μ5 = μ6 = μ7 is not true. We
have to reject this & accept following alternative hypothesis:
Ha: μ1≠μ2≠μ3≠μ4≠μ5≠μ6≠μ7
Ha: μ1 < μ2 < μ3 < μ4 < μ5 < μ6 < μ7
Audit result can be concluded that a one-way within subjects (or repeated measures) ANOVA was conducted on a sample of 10 critical suppliers to compare the effect of revised supplier performance system on supplier performance score in seven continuous quarters / conditions i.e. from Oct., 10 to June, 12. There was a significant effect of supplier performance system in continuously increasing supplier performance score. Thus supplier performance management system audit framework, built on the repeated 1-Way within Subjects ANOVA methodology effectively audited the effect of used supplier
performance management system (IV) on supplier performance score (DV).
CONCLUDING REMARKS
This research paper was aimed to develop & implement an objective framework of supplier performance audit program, built on a strong, yet versatile statistical methodology - Analysis of variance (ANOVA). The empirical study of this supplier performance management system audit framework has been undertaken as a single exploratory descriptive case study with a deductive positivism approach with one of the reputed Sports Goods Manufacturing Industry from India i.e. Cosco (India) Limited.
To check the findings of this supplier performance management system audit framework, during the case study the effect of earlier as well as revised Supplier Performance Management System on supplier performance scores on a sample of 10 critical suppliers in seven concerned & continuous quarters i.e. from Oct., 10 to June, 12 were analyzed & audited/tested through a one-way within subjects (or repeated measures) ANOVA. Test result can be concluded that there is a significant effect of supplier performance system in continuously increasing supplier performance score. Thus this supplier performance management system audit framework effectively audited the effect of used supplier performance management system (IV) on supplier performance score (DV).
From the outset, this supplier performance management system audit framework had the advantages of simplicity, understandability and ease of implementation. It is highly reliable and its implementation costs are moderate & hence suitable for small & medium enterprises (SME).
Research Contributions
activity in the organization in order to make it more effective. This will also provide guidance to anyone who wants to develop a resulted oriented supplier performance management system in any organization.
REFERENCES
Barrett, Jane and Rizza, Mickey North, 2008. Supplier Performance Management: It's More Than a Scorecard - It's a Strategy, AMR Research Alert, June 6, 2008.
Chopra Sunil, Meindl Peter, 2001. Supply Chain Management: Strategy, Planning, and Operation, Prentice Hall, New Jersey. Dobler D.W., Lee L.Jr., Burt D.N., 1990.
Purchasing and Materials Management: Text and Cases, 5th edn, McGraw-Hill, New York.
Dobler Donald W., Burt David N., 2002, Purchasing and supply chain management: Text and cases, Tata McGraw-Hill Publishing Company Limited, New Delhi. Field A.P., 2013. Discovering statistics using
IBM SPSS Statistics: And sex and drug & rock 'n' roll (4th ed.). London: Sage.
Fine Charles H., 1999. Clock speed: Winning Industry Control in the age of Temporary advantage, Persues Books, New York. Girden ER, 1992. ANOVA: repeated
measures. Sage University Papers Series on Quantitative Applications in the Social Sciences, 84. Thousand Oaks, CA: Sage. Gordon Sherry R., 2010. Understanding and
Improving Supplier Performance: Supplier Performance Management Retrieved from http://www.esourcingwiki.com/index.php/S upplier_Performance_Management (15 Dec 2010)
Greenhouse SW, Geisser S., 1959. On methods in the analysis of profile data. Psychometrika, 24, 95-112.
Howell David, 2002. Statistical Methods for Psychology. Duxbury. 324-325. ISBN 0-534-37770-X.
Huynh H, Feldt LS, 1976. Estimation of the Box correction for degrees of freedom from sample data in randomised block and split-plot designs. Journal of Educational Statistics, 1, 69-82.
Kirk RE, 1995. Experimental Design: Procedures For The Behavioral Sciences (3 ed.). Pacific Grove, CA, USA: Brooks/Cole.
Lecture B., 1991. A correction for the e approximate test in repeated measures designs with two or more independent groups. Journal of Educational Statistics, 16, 371-372.
Leenders M.R., Fearon H.E., England W.P., 1981. Purchasing and Materials Management, 9th, Irwin, Homewood, IL. Narasimhan R., 1983. An analytical approach
to supplier selection. Journal of Purchasing and Materials Management, 19(4), 2732. Simpson Penny M., Siguaw Judy A., White
Susan C., 2002. Measuring the performance of suppliers: An analysis of evaluation processes, Journal of Supply Chain Management,Vol. 38 (1), 29.
Soukoup R.W., 1987. Supplier selection strategies, International Journal of Purchasing and Materials Management, Vol. 23(1), 7-11.
SPSS Statistics Base 17.0 User's Guide (2007). Chicago, IL: SPSS Inc.}
Timmerman E., 1986. An approach to vendor performance evaluation. Journal of Purchasing and Materials Management, 22 (4), 2-8.
Zenz G.J., 1987. Purchasing and Management of Materials, 6th edn, John Wiley, New York.
UPROSZCZONA METODA OCENY ZARZ
Ą
DZANIA DOSTAWCAMI
DLA MAŁYCH I
Ś
REDNICH PRZEDSI
Ę
BIORSTW
STRESZCZENIE. Wstęp: Zarządzanie oceną dostawców jest obszarem o istotnym znaczeniu dla małych I średnich przedsiębiorstw. Jak tego typu przedsiębiorstwa mogą uzyskać lepszą pozycję rynkową poprzez poprawę systemu oceny dostawców? Kluczową sprawą jest zbudowanie systemu oceny wartości dodanej wniesionej przez dostawców opartego
na grupie wskaźników. Taki system audytowania może pomóc małych i średnim przedsiębiorstwom obniżyć poziom ryzyka oraz obniżyć koszty wynikające ze złej jakości. Dlatego też dobrej jakości program oceny dostawców jest
istotnym narzędziem zarządzania dla przedsiębiorstwa.
Metody: Aby sprostać wymaganiom stawianym programom efektywnej oceny dostawców, w pracy zaproponowano ogólne zasady takiego programu opartego na silnej i jednocześnie wszechstronnej analizie wariancji (ANOVA). Zaprezentowano definicję procesu, standaryzację, przegląd współczesnej literatury oraz praktyczne zastosowanie na
przykładzie przedsiębiorstwa Sports Goods Industry z Indii.
Wyniki i wnioski: Zaletą proponowanej metody jest uwzględnienie różnorodności działa przedsiębiorstwa oraz jednocześnie efektywnej identyfikacji różnic pomiędzy dostawcami. Dzięki stosowaniu tej metody możliwe jest podniesie jakość pracy przedsiębiorstwa.
Słowa kluczowe: audit dostawcy, analiza wariancji (ANOVA), łańcuch dostaw, zarządzanie dostawcami, małe i
średnie przedsiębiorstwa
EINE VEREINFACHTE METHODE FÜR DIE BEURTEILUNG DES
MANAGEMENTS
VON
LIEFERANTEN
FÜR
KLEIN-
UND
MITTELSTÄNDISCHE UNTERNEHMEN
ZUSAMMENFASSUNG. Einleitung: Das Management der Beurteilung von Lieferanten stellt für die klein- und mittelständischen Unternehmen einen Bereich von wesentlicher Bedeutung dar. Auf welche Art und Weise können solche Unternehmen eine bessere Marktposition durch die Verbesserung des die Lieferanten anbetreffenden Beurteilungssystems erlangen? Die Schlüsselfrage dabei ist das Aufbauen eines auf die Gruppe von Kennziffern gestützten Systems für die Beurteilung der durch die Lieferanten erbrachten Wertschöpfung. Solch ein Auditing-System kann bei der Verminderung des Risikoniveaus und der Herabsetzung der aus der schlechten Qualität resultierenden Kosten in den klein- und mittelständischen Unternehmen eine Hilfe leisten. Daher stellt ein hochqualitatives Programm für die Beurteilung der Lieferanten ein brauchbares Tool für das Management im Unternehmen dar.
Methoden: Um den an die Programme der effektiven Beurteilung der Lieferanten gestellten Anforderungen das Genüge zu leisten, hat man die allgemeinen Prinzipien eines solchen Programms, das auf eine strenge und gleichzeitig universale Varianten-Analyse (ANOVA) gestützt ist, vorgeschlagen. Es wurden die Definition des Prozesses, Standardisierung, der Überblick über die gegenwärtige Gegenstandliteratur und die praktische Anwendung am Beispiel des Unternehmens Sports Goods Industry von Indien projiziert.
Ergebnisse und Fazit: Der Vorteil der vorgeschlagenen Methode besteht auf der Berücksichtigung der Unterschiedlichkeit von Aktivitäten des Unternehmens sowie einer effektiven Identifikation von Differenzen zwischen den Lieferanten. Dank der Anwendung dieser Methode ist die Erhöhung der Arbeit-Qualität des Unternehmens möglich..
Codewörter: Auditing des Lieferanten, Varianten-Analyse (ANOVA), Lieferkette, Management von Lieferanten, klein- und mittelständische Unternehmen.
Satya Parkash Kaushik Singhania University
Pacheri Bari, Rajasthan, India e-mail: [email protected]
Dr. Veerender Kumar Kaushik
School of Management of the Technological Institute of Textile & Sciences Bhiwani, Haryana, India