Copyright: Wyższa Szkoła Logistyki, Poznań, Polska
Citation: Parkash S., Kaushik V.K., 2011, Simple, Cost effective & Result oriented Framework for Supplier Performance > Scientific Journal of Logistics <
Vol. 7
Issue 3
No 2
http://www.logforum.net
SIMPLE, COST EFFECTIVE & RESULT ORIENTED FRAMEWORK
FOR SUPPLIER PERFORMANCE MEASUREMENT IN SPORTS
GOODS MANUFACTURING INDUSTRY
S Parkash
1, Veerender Kumar Kaushik
21) Singhania University, Rajasthan, India 2) Technological Institute of Textile & Sciences, Bhiwani, Haryana, India
ABSTRACT. The emergences of global markets have increased competition worldwide. For the Sports Goods Manufacturing Industry which is considered to be an intensive supplier base industry with limited resources to sustain in what is already a very competitive market there is a need for the entire supply chain viz. raw material and machinery suppliers and manufacturers to measure their supplier's performance to reduce business risks and revenue losses. How to design & execute a simple, cost effective & result oriented Framework for Supplier Performance Measurement for sports goods manufacturing small - medium enterprises is the main aim of this research paper.
Key words: Supplier Performance Measurement, Supply Chain, the Weighted Point Model, Sports Goods Manufacturing Industry, ISO 9001.
INTRODUCTION
"In today's competitive environment it is impossible to successfully produce high quality, low cost products without considering a satisfactory set of suppliers."[ Soukoup 1987] The Sports Goods Manufacturing Industry involves several types of suppliers ranging from general utilities, PU, PVC, Padding Material, Cork Wood, Cotton & Polyester, Latex & Rubber, Non Woven Fabric, Bonding Agents, Bladders, Screen printing Inks, Stitching Threads, Machinery for Stitching, cutting etc. to large plant equipments. In case suppliers to the end manufacturer of sporting goods do not perform as agreed upon, it will first of all have an impact on the whole supply chain because the supplier is the first link in this chain. Thus, the end product will be negatively affected as well. Consequently, an end product can only be as good as the parts it is made of. In this context, the buyer's products or services are heavily dependent on his suppliers' performances. "However, without careful monitoring of supplier performance, a firm is unable to accurately assess whether its current suppliers are meeting the needs of the firm, and suppliers are unable to respond to unexpressed partner needs."[ Simpson et al. 2002] A supplier performance expectation can be defined as "a specific statement of a business practice, process, policy and/or the results anticipated or required from a supplier's performance or behavior in relation to the customer".[ Gordon, Sherry 2008]
In this pursuit, the author having worked as Head Of Materials Department in one of the reputed Sports Goods Industry with in India for more than 12 years selected this as a single exploratory case study to find out what the industry expect from suppliers and if suppliers are efficient to fulfill industry requirements.
This paper is composed of five sections. In the following section supplier performance measurement is overviewed with its basic concepts, and then measurement methods used in the paper are explained based on literature review. The third & fourth section focuses on the methodology explaining the way of WPM application with using ISO 9001; 2008 QMS standards and example showing its results. In the final section, the results are discussed and commented.
LITERATURE REVIEW
World-class competition, criticality of product / marketing timing, escalating customer demands & the tremendous emphasis on quality are but a few of the key challenges confronting most sports goods manufacturing industries today. "These developments in turn, have had a monumental impact on the purchasing function in most organizations. Now purchasing has expanded to become supply management. Often included in this expanded responsibility is the integration of long - term strategic materials planning with the corporate strategic planning process. This approach inherently recognizes the pivotal role played by suppliers. They are the key to successful execution of the buying firm's plans. Purchasing emerging role -proactive & more strategically oriented - focuses the management of subsequent supplier relations & performance, with an emphasis on quality." [Dobler et al. 2002] "Supply Management is a process responsible for the development & management of a firm's total supply system - focuses heavily on the strategic aspects of the key elements of a firm's supply system." [Dobler, Burt 2002] A key and perhaps the most important process of the supply management is the efficient performance of suppliers, because it brings significant savings for the organization e.g. reduce risk and maximize the total value for the buyer. Suppliers are key value supply chain participants. "Supply chain consists of all stages involved, directly or indirectly, in fulfilling a customer request. The supply chain not only includes the manufacturer & suppliers, but also transporters, warehouses, retailers & customer themselves." [Chopral, Meindl 2001] As noted by fine, "supply chains are the next source of competitive advantage" [Fine 1999] Suppliers have varied strengths and weaknesses. It is very difficult for supplier to excel in all dimensions of performance. But these have to satisfy minimum overall performance standards.
Supplier performance measurement (SPM) is a mechanism to track supplier progress towards meeting organizational goals, & gives feedback to the supplier base on their individual performance. "Good supplier performance is a key ingredient in enabling firms to achieve business performance excellence. But how can firms manage or even influence the performance of outside suppliers? Supplier performance management (SPM) is being widely adopted as a method to understand and improve the performance of the extended enterprise." [Gordon Sherry R. 2010]
Basis: It is built through effective communication, & clearly defined objectives. It includes critical processes to define measure and analyze supplier performance to meet business goals. Create & maintain performance targets that can be defined & monitored, to ensure that our supply base understands that quality & delivery levels to meet our customer satisfaction goals.
A Perfect SPM program should:
− Align with objectives of the firm, not be focused only on Procurement − Planned and designed with those corporate goals in mind - not just "happen"
Main Elements
A supplier performance evaluation has four primary areas: − Factor & Criteria
− Weighting − Rating Scale
− Ease of Use and Effectiveness in providing data for decision-making − Share results with suppliers and stakeholders
− Review and recalibrate performance measures periodically
A company should select performance measures that best represent the criteria that lead to improved customer, operational and financial performance. "Firms should concentrate on strategic suppliers who are integrated business partners as well as core suppliers, who require integration and development plus other suppliers that may supply a high-cost or high-risk item." [Barrett, Rizza 2008]
The following seven steps comprise a process for developing and deploying supplier assessment:
1. Align supplier performance goals with organizational goals and objectives.
2. Determine an evaluation approach.
3. Develop a method to collect information about suppliers.
4. Design and develop a robust assessment system.
5. Deploy a supplier performance assessment system.
6. Give feedback to suppliers on their performance.
7. Produce results from measuring supplier performance. [Gordon 2010]
The Development of the supplier evaluation model
In literature, there exist a lot of contribution in the form of practice and models for evaluating and measuring supplier performance [Tan et al., 1999; Neely, 1999; Anderson and Lee, 1999; Tracey and Tan, 2001; Çebi and Bayaktar, 2003; Gunasekaran et al., 2004].
Organisations that perform well tend to place less importance on unit price than on selection and evaluation criteria; they select and evaluate suppliers on the basis of good quality, delivery reliability and product performance [Gunasekaran et al., 2004]. They also involve their key suppliers in the decision-making process and successfully involve them in continuous improvement programmes [Tracey and Tan, 2001]. Percin [2006] states that the analytic hierarchy process (AHP), introduced by Saaty [1977], is a theory of measurement that provides the ability to incorporate both qualitative and quantitative factors in the decision making process. Sarode et al. [2008] reported total twelve measures which includes qualitative and quantitative type-quality, visibility, flexibility and responsiveness, resource utilization, cost, asset, technological capability, service and time to market apart from these twelve measure total fifty eight items/ variables identified.
Some recent supplier performance evaluation and selection studies in various industries are, Baby Food Manufacturing Industry, Weber [1996]; Agricultural and Construction Equipment Industry, Liu et al. [2000], Telecommunications Industry, Narasimhan et al. [2001]; Wooden Furniture Industry, Yahya and .Kingsman [1999]; Food Manufacturing Industry, Çebi and Bayraktar [2004]; retail industry (Wagner vd. [1989] etc.). However, to the author's best knowledge, this will be the first study measuring the supplier performance of sports goods manufacturing industry by the use of Weighted Point Method (WPM) supported with ISO 9001; 2008 QMS Standards.
The Weighted Point Method
The Weighted Point Method has been around for more than half a century. Its longevity attests to its continued usefulness. In the weighted-point method, the relevant attributes are chosen and each are assigned a weight depending on the importance to the overall performance. The firm reaches a consensus on weight assignments to prevent or minimize subjectivity. The weight for each performance category is then multiplied by the performance score that is assigned to it. Finally, these products are totalled to determine a final rating for each supplier. It is highly reliable and its implementation costs are moderate. In addition, it combines qualitative and quantitative performance factors into a common system. Because users can change the weights assigned to each performance category, or change the performance categories themselves depending on the strategic priorities of the firm, the system is flexible.
ISO 9001 Standards
ISO 9001 is an international standard that gives requirements for an organization's quality management system (QMS). These have modifications in the purchasing section as presented in the following clauses.
1. Purchasing
Purchasing Control (ISO9001, Clause 4.6)
Is there a system for assessing sub contractors & vendors?
Do you have a documented procedure for evaluating sub contractors & vendors [Lal 1996]
The organization shall ensure that purchased product conforms to specified requirements. The type and extent of control applied to the supplier and the product shall be dependent upon the impact of the purchased product on subsequent product realization or the final product. The organization shall measure supplier performance based on their ability to supply product in accordance with the organization's requirements. Criteria for performance appraisal shall be established. The results of performance appraisal and subsequent follow-up actions shall be recorded.
Purchasing information
Purchasing information shall describe the product to be purchased, including where appropriate:
A.Requirements for approval of product, procedures, processes, facilities and equipment
B.Requirements for qualification of personnel
C.Quality management system requirements.
The organization shall ensure the adequacy of specified requirements prior to their communication to the supplier.
Verification of purchased product
intends to perform verification activities at the supplier's premises, the organization shall specify the required verification arrangements and method of product release in the purchasing information.
2. Analysis of data
The organization shall determine, collect and analyze appropriate data to determine the suitability and effectiveness of the quality management system and to evaluate where improvements of the quality management system can be made. This shall include data generated by monitoring and measuring and other relevant sources.
The analysis of data shall provide information relating to:
a)Customer satisfaction;
b)Conformance to product requirements;
c)Characteristics and trends of processes and products including opportunities for preventive action; and
d)Suppliers.
In order to stay compliant with the new ISO 9001 Standards, has to be performed some sort of data analysis on suppliers. The standard gives no suggestions with respect to what to monitor or measure since it is not prescriptive.
ISO 9001:2008 states
In sub clause 0.2 Process Approach: "The application of a system of processes within an organization, together with the identification and interactions of these processes, and their management to produce the desired outcome, can be referred to as the "process approach".
In sub clause 4.1 General requirements: "The organization shall establish, document, implement and maintain a quality management system and continually improve its effectiveness in accordance with the requirements of this International Standard. The organization shall:
a)determine the processes needed for the quality management system and their application throughout the organization (see 1.2),
b)determine the sequence and interaction of these processes,
c)determine criteria and methods needed to ensure that both the operation and control of these processes are effective,
d)ensure the availability of resources and information necessary to support the operation and monitoring of these processes,
e)monitor, measure (where applicable), and analyze these processes, and
f)implement actions necessary to achieve planned results and continual improvement of these processes.
These processes shall be managed by the organization in accordance with the requirements of this International Standard".
THE METHODOLOGY & EMPIRICAL STUDY
This Research Study has been undertaken as a single exploratory case study with one of the reputed Sports Goods Manufacturing Industry from India for Empirical Examination of framework for Supplier Performance Measurement System by the use of Weighted Point Method (WPM) supported with ISO 9001; 2008 QMS Standards. This research paper Details the business case for supplier performance measurement; where to start; what to measure; how to develop an evaluation process &
How to rank and manage supplier network to get lower operating costs, reduced risk exposure, and more satisfied customers.
Where to start?
Quality Business Process Mapping & establishing Standard Operating Procedures / Working Instructions by use of the "Process Approach" to the ISO 9001:2008 QMS e.g.
A.Purchase Planning & Ordering: Process map is developed & documented for indenting requirements for purchasing, planning & ordering of materials.
B. Supplier Development, Evaluation & Selection: Process map was developed & documented to provide instruction & responsibility for development, evaluation & selection of suppliers.
C. Supplier Performance Monitoring / Re-evaluation: Process map was developed & documented for monitoring the performance of suppliers as per laid down criteria. This process details the steps for quarterly review of supplier performance.
D.Records of the suppliers' performance measurement shall be maintained and kept. The evaluation process would be introduced to the records control process according to paragraph 4.2.4 - control of records.
Whom to measure?
Supplier Selection: All listed supplier which affect quality related to product & job work as discussed with the firms Director Operation
Who will measure?
Organization's purchasing and supply management staff, engineers and quality staff & user will participate in supplier performance measuring program. Here Materials Manager, Purchase Supervisor, Store Keeper & Incoming inspection In charge participate
What to measure?
The performance measures used to determine the degree to which suppliers are performing are selected in consideration with organizational quality policy, objectives & challenges after discussion with the firm's director operation. The following criteria are selected:
− Quality i.e. Receipt Acceptance Rate − Delivery i.e. On-Time Receipt − Competitive Pricing
− Proper Responsiveness
How to measure?
"On-Time Receipt"
A procurement system can look at the due dates for each order to a specific supplier and determine which of those orders had receipts against them on or before the due dates and which of those orders had receipts against them after the due dates. E.G. If one receipt arrived on or before the due dates and the other receipt arrived after the due dates, then supplier has an on-time delivery performance of 1 for 2, or 50%
"Receipt Acceptance Rate"
If 10 out of 100 of a supplier's receipts failed incoming inspection, then supplier would have an acceptance rate of 90%.
"Competitive Pricing" & "Proper Responsiveness"
Supplier Scorecard for each of these performance measures is framed. Each scorecard represents a survey of the concerned participant opinion of that supplier's proficiency for the selected performance measures. The scores for each performance measure are based on a scale of 1 to 5 where 1 indicates poor performance and 5 indicate good performance.
Supplier Scorecard Sample
Supplier S - 1
Performance Measure
How Measured
Score Provides Competitive Pricing 1 = Poor
5 = Good
Provides Proper Response 1 = Poor
5 = Good
Weighted Point Method
The above-acquired information generates concerned performance measure rating which when multiplied by its corresponding criteria weight produce a weighted score for that performance measure. The weighted scores for the individual performance measures are then added to produce a final score of concerned supplier.
How to grade?
The final score for each supplier is computed by summing up all four scores obtained for each performance measure.
Suppliers are ranked from poor performance level to good by creating a list of suppliers & their total scores, then sorting it as per pre determined supplier rating levels. The supplier rating levels are fixed in consideration with organizational quality policy after discussion with the firm's director operation.
Give feedback to suppliers on their performance.
EXAMPLE AND EMPIRICAL RESULTS
Table 1. Data Set of "On-Time Receipt" for the period from Oct. 2010 to Dec., 2010 Tabela 1. Dane dot. terminowości przyjęć za okres październik-grudzień 2010
Supplier No. of On-Time Receipts
Total No. of receipts
Delivery Performance Ratio
S1 37 47 37/47 = 0.78
S2 42 59 42/59 = 0.71
S3 4 4 4/4 = 1
S4 9 15 9/15 = 0.60
S5 15 18 15/18 = 0.83
S6 9 9 9/9 = 1
S7 32 32 32/32 = 1
S8 20 20 20/20 = 1
S9 3 3 3/3 = 1
S10 11 11 11/11 = 1
Table 2. Data Set of "Receipt Acceptance Rate" for the period from Oct., 2010 to Dec., 2010 Tabela 2. Dane dot. akceptowalności dostaw za okres październik-grudzień 2010
Supplier No. of Accepted Receipts
Total No. of receipts
Quality Performance Ratio
S1 37 47 37/47 = 0.78
S2 59 59 59/59 = 1
S3 4 4 4/4 = 1
S4 15 15 15/15 = 1
S5 18 18 18/18 = 1
S6 9 9 9/9 = 1
S7 32 32 32/32 = 1
S8 20 20 20/20 = 1
S9 3 3 3/3 = 1
S10 11 11 11/11 = 1
Table 3. Data Set of "Competitive Pricing" for the period from Oct., 2010 to Dec., 2010 Tabela 3. Dane dot. konkurencyjności cenowej za okres październik-grudzień 2010
Supplier Attained Score Maximum
Score
Competitive Pricing Performance Ratio
S1 9 10 9/10 = 0.90
S2 7 10 7/10 = 0.70
S3 6 10 6/10 = 0.60
S4 6 10 6/10 = 0.60
S5 7 10 7/10 = 0.70
S6 6 10 6/10 = 0.60
S7 7 10 7/10 = 0.70
S8 7 10 7/10 = 0.70
S9 8 10 8/10 = 0.80
Table 4. Data Set of "Proper Responsiveness" for the period from Oct., 2010 to Dec., 2010 Tabela 4. Dane dot. „właściwego nastawienia do klienta” za okres październik-grudzień 2010
Supplier Attained Score
Maximum Score
Proper Responsiveness Performance Ratio
S1 9 10 9/10 = 0.90
S2 7 10 7/10 = 0.70
S3 6 10 6/10 = 0.60
S4 7 10 7/10 = 0.70
S5 7 10 7/10 = 0.70
S6 6 10 6/10 = 0.60
S7 6 10 6/10 = 0.60
S8 8 10 8/10 = 0.80
S9 8 10 8/10 = 0.80
S10 5 10 5/10 = 0.50
SUPPLIER PERFORMANCE RATING BY USE OF THE WEIGHTED POINT METHOD
Criteria Criteria Weight
Points for Quality Conformance = 40 Points
Points for Receipt Conformance = 40 Points
Points for Competitive Pricing Conformance = 10 Points
Points for Proper Responsiveness Conformance = 10 Points
Supplier Quality Performance Rating/weighted score
Quality Performance Ratio X Criteria Weight
No. Of Receipts in Quality standard Q.P.R =
Total No. Of Receipts
Supplier Delivery Performance Rating/weighted score
Delivery Performance Ratio X Criteria Weight
No. Of Receipts in Schedule D.P.R =
Total No. Of Receipts
Supplier Competitive Pricing Performance Rating/weighted score:
Competitive Pricing Performance Ratio X Criteria Weight
Supplier Proper Responsiveness Performance Rating/weighted score:
Proper Responsiveness Performance Ratio X Criteria Weight
Proper Response Performance Ratio = Attained Score --- Maximum Score
Table 5. Quality Performance Rating/Score by use of the Weighted Point Method for the period Oct. - Dec. 2010 Tabela 5. Dane dot. jakości obsługi przy zastosowaniu metody punktów ważonych za okres październik-grudzień 2010
Supplier Quality
Performance Ratio
Criteria Weight
Quality Performance Rating/weighted
score
S1 0.78 40 31.20
S2 1 40 40
S3 1 40 40
S4 1 40 40
S5 1 40 40
S6 1 40 40
S7 1 40 40
S8 1 40 40
S9 1 40 40
S10 1 40 40
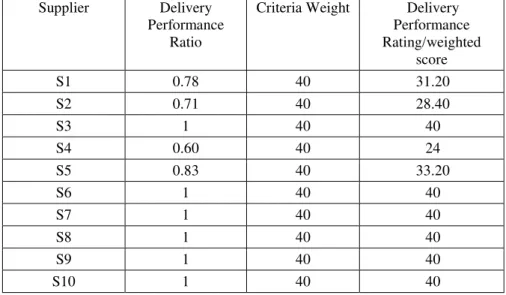
Table 6. Delivery Performance Rating/Score by use of the Weighted Point Method for the period Oct. - Dec. 2010 Tabela 6. Dane dot. obsługi dostaw przy zastosowaniu metody punktów ważonych za okres październik-grudzień 2010
Supplier Delivery
Performance Ratio
Criteria Weight Delivery Performance Rating/weighted
score
S1 0.78 40 31.20
S2 0.71 40 28.40
S3 1 40 40
S4 0.60 40 24
S5 0.83 40 33.20
S6 1 40 40
S7 1 40 40
S8 1 40 40
S9 1 40 40
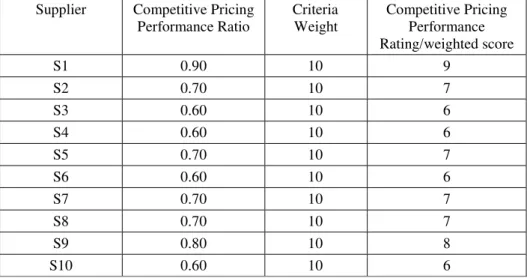
Table 7. Competitive Pricing Performance Rating/Score by use of The Weighted Point Method for the period Oct. - Dec. 2010 Tabela 7. Dane dot. konkurencyjności cen przy zastosowaniu metody punktów ważonych
za okres październik-grudzień 2010
Supplier Competitive Pricing Performance Ratio
Criteria Weight
Competitive Pricing Performance Rating/weighted score
S1 0.90 10 9
S2 0.70 10 7
S3 0.60 10 6
S4 0.60 10 6
S5 0.70 10 7
S6 0.60 10 6
S7 0.70 10 7
S8 0.70 10 7
S9 0.80 10 8
S10 0.60 10 6
Table 8. Proper Responsiveness Performance Rating/Score by use of The Weighted Point Method for the period Oct. - Dec. 2010 Tabela 8. Dane dot. „właściwego nastawienia do klienta” przy zastosowaniu metody punktów ważonych za okres
październik-grudzień 2010
Supplier
Proper Responsiveness Performance Ratio
Criteria Weight
Proper Responsiveness
Performance Rating/weighted
score
S1 0.90 10 9
S2 0.70 10 7
S3 0.60 10 6
S4 0.70 10 7
S5 0.70 10 7
S6 0.60 10 6
S7 0.60 10 6
S8 0.80 10 8
S9 0.80 10 8
S10 0.50 10 5
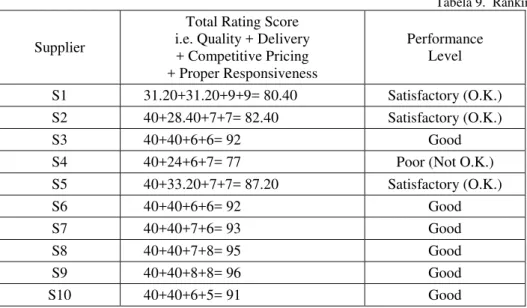
Supplier Performance Grading System
90 - 100 Points / Percent = Good
80 - 89 Points / Percent = Satisfactory (O.K.)
Below 80 Points/ Percent = Poor (Not O.K.)
Table 9. Supplier Ranking Tabela 9. Ranking dostawców
Supplier
Total Rating Score i.e. Quality + Delivery + Competitive Pricing + Proper Responsiveness
Performance Level
S1 31.20+31.20+9+9= 80.40 Satisfactory (O.K.)
S2 40+28.40+7+7= 82.40 Satisfactory (O.K.)
S3 40+40+6+6= 92 Good
S4 40+24+6+7= 77 Poor (Not O.K.)
S5 40+33.20+7+7= 87.20 Satisfactory (O.K.)
S6 40+40+6+6= 92 Good
S7 40+40+7+6= 93 Good
S8 40+40+7+8= 95 Good
S9 40+40+8+8= 96 Good
S10 40+40+6+5= 91 Good
CONCLUSIONS
From the outset, this multi-criteria supplier performance measurement framework had the advantages of simplicity, understandability and ease of implementation. [Aljian 1973] It is highly reliable and its implementation costs are moderate. In addition, it combines qualitative and quantitative performance factors into a common system. Because users can change the weights assigned to each performance category, or change the performance categories themselves depending on the strategic priorities of the firm, the system is flexible. Beginning with the 1958 Purchasing Handbook, the weighted point evaluation method (WPEM) was given good grades for its usefulness and effectiveness. [Aljian 1958]
Dobler and Burt state, "The approach is widely used in practice and generally leads to a fair and reasonably objective result." [Dobler, Burt 1996]
This framework will hopefully provide guidance for anyone who wants to develop supplier performance measurement system in sports goods manufacturing industry & other small - medium enterprises.
REFERENCES
Aljian, George W., 1973, Purchasing Handbook, 3rd Edition, New York: McGraw-Hill.
Aljian, George W., 1958, Purchasing Handbook, 1st Edition, New York: McGraw-Hill.
Barrett, Jane and Rizza, Mickey North, 2008, "Supplier Performance Management: It's More Than a Scorecard - It's a Strategy", AMR Research Alert, June 6, 2008.
Chopra, Sunil and Meindl, Peter, 2001, Supply Chain Management: Strategy, Planning, and Operation, Prentice Hall, New Jersey.
Dobler, D.W., Lee, L. Jr. and Burt, D.N., 1990, Purchasing and Materials Management: Text and Cases, 5th edn, McGraw-Hill, New York.
Dobler, Donald W. and Burt, David N., 2002, Purchasing and supply chain management: Text and cases, Tata McGraw-Hill Publishing Company Limited, New Delhi.
Fine, Charles H., 1999, Clock speed: Winning Industry Control in the age of Temporary advantage, Persues Books, New York.
Gordon, Sherry R., Understanding and Improving Supplier Performance: Supplier Performance Management Retrieved from http://www.esourcingwiki.com/index.php/Supplier_ Performance_Management (accessed 15 December 2010)
Gordon, Sherry R., 2008, Supplier Evaluation and Performance Excellence, A Guide to Meaningful Metrics and Successful Results, J. Ross Publishing, USA.
Introduction and support package: Guidance on the concept and use of the process approach for management systems (Document: ISO/TC 176/SC 2/N544R3 October 2008, http://www.iso.org) (accessed 15 December 2010).
Lal H., 1996, International Trade Centre, UNCTAD/WTO, Geneva, Switzerland and International Organization for Standardization, Geneva, Switzerland, ISO 9000 QUALITY MANAGEMENT SYSTEMS Guidelines for enterprises in developing countries.
Leenders, M.R., Fearon, H.E. and England, W.P., 1981, Purchasing and Materials Management, 9th edn, Irwin, Homewood, IL.
Narasimhan, R., 1983, An analytical approach to supplier selection. Journal of Purchasing and Materials Management, 19 (4), 2732.
Simpson, Penny M. and Siguaw, Judy A. and White, Susan C., 2002, Measuring the performance of suppliers: An analysis of evaluation processes, Journal of Supply Chain Management,Vol. 38 (1), pg. 29Soukoup, R.W. (1987), "Supplier selection strategies", International Journal of Purchasing and Materials Management, Vol. 23(1), pp. 7-11.
Timmerman, E., 1986, An approach to vendor performance evaluation. Journal of Purchasing and Materials Management, 22 (4), 2-8.
Zenz, G.J., 1987, Purchasing and Management of Materials, 6th edn, John Wiley, New York.
PROSTE, EKONOMICZNE ORAZ ZORIENTOWANE NA WYNIK
ZASADY OCENY DOSTAWCÓW W PRZEMY
Ś
LE WYTWÓRCZYM
SPRZ
Ę
TU SPORTOWEGO
STRESZCZENIE. Powstanie rynków o zasięgu globalnym zwiększyło również konkurencję na skalęświatową. Przemysł wytwórczy sprzętu sportowego, jako przemysł bardzo zależny od dostawców oraz z ograniczonymi zasobami, aby przetrwać
na bardzo konkurencyjnym rynku wymaga sprawnego kompletnego łańcucha dostaw, począwszy od surowców aż do dostawców maszyn jak również systemu oceny tych dostawców w celu redukcji ryzyka związanego z działalnością
gospodarczą. Celem tej pracy był system oceny dostawców dla małych i średnich przedsiębiorstw przemysłu wytwórczego sprzętu sportowego, który jest prosty, łatwy w stosowaniu, ekonomiczny oraz zorientowany na wynik.
EINFACHE, KOSTENGÜNSTIGE UND ERGEBNISORIENTIERTE
RAHMEN FÜR DIE BEWERTUNG DER LIEFERANTEN IN DER
BRANCHE DER SPORTARTIKELINDUSTRIE
ZUSAMMENFASSUNG. Die Entstehung der globalen Märkte hat den Wettbewerb auf globaler Ebene erhöht. Die Sportartikelindustrie, die sehr abhängig von Lieferanten und mit begrenzen Ressourcen ist, um in sehr wettbewerbsintensiven Markt zu überlegen, erfordert eine komplette Lieferkette vom Rohstoff bis zum Fertigungsmaschinen, wie auch ein Bewertungssystem von Lieferanten, um die Geschäftsrisiken zu reduzieren. Das Ziel dieser Studie war ein Bewertungssystem von Lieferanten für kleinen und mittleren Unternehmen von der Sportartikelindustrie, die einfach, kostengünstig und ergebnisorientiert ist.
Codewörter: Bewertung von Lieferanten, Lieferkette, gewogen Punkt Modell, Sportartikelindustrie, ISO 9001