* Brno University of Technology, Faculty of Business and Management (schuller@f bm.vutbr.cz; pekarek@f bm.vutbr.cz).
MARKET ATTRACTIVENESS
CLASSIFICATION OF EUROPEAN UNION
COUNTRIES FOR ESTABLISHING
LOGISTICS CENTRES
David Schüller, Jan Pekárek*
Abstract
At present, enterprises are forced to serve their customers as quickly as possible if they want to succeed on turbulent global markets. Enterprises are looking for regions with high-quality infrastructure where they can establish new logistics centres that enable enterprises to serve their customers quickly. This paper focuses on the segmentation of the European Union market for enterprises that are willing to set up logistics centres in order to be able to distribute products fluently and more quickly to their customers in Europe. An agglomerative hierarchical clustering algorithm was used and Ward’s criterion applied for the purposes of market segmentation. A Logistic Performance Index and the indicator Dealing with Construction Permits were used as two relevant dimensions reflecting the market attractiveness of identified clusters. Based on the given statistical output, fundamental marketing concepts were formulated for each cluster composed of EU countries with similar characteristics.
Keywords: market attractiveness, EU countries, logistic performance index, construction permit procedure, logistics centres
JEL Classification: C38, M31, L10
Introduction
Growing liberalisation in the international marketplace and fierce domestic competition are forcing companies to expand onto the global market. Global expansion activities are increasingly significant to the growth and prosperity of modern companies [Morgan et al., 2004]. In the current business climate, enterprises are forced to apply new strategies and tactics that are often based on a differentiation approach. Customers are endeavouring to maximise their utility and enterprises are striving to maximise their profit. Currently, companies are being forced to look for new proposals to be able to compete in an ever-increasing competitive environment. Segmentation is one of the most important
ARTICLES
methods in this process. There are many kinds of segmentation in marketing. Marketing segmentation is used for targeting a smaller market and helps marketers reach the chosen segment of customers effectively with a single marketing mix [Anderson & Vincze, 2003]. Marketing segmentation splits a large market into smaller consumer groups with similar characteristics [Huang et al., 2007]. Market segmentation must be an effective and profitable process [Wedel & Kamakura, 2000]. Marketers have to analyse each segment properly and create an effective marketing mix on the basis of the customers’ preferences, needs or characteristics, etc. [Dibb & Simkin, 1995]. The optimal segment is created when it is possible to serve customers effectively with a single marketing mix [Liautaud & Hammond, 2002]. On the one hand, a relatively wide scope of the product portfolio increases demand and sales; on the other hand, enterprises incur higher costs and generally use larger amounts of their limited resources. With too much variability in the product portfolio, the manufacturing process becomes inefficient [Child et al., 1991]. For this reason, it is necessary to set up a product portfolio sufficiently large for the customer, while keeping it within the limits imposed by the company’s limited resources. Each market segment should be financially attractive to yield growth in sales and profits [McDonald & Dunbar, 2004]. Companies take two dimensions into account when they evaluate market segments: the segments’ attractiveness and the company’s resources [Kotler & Armstrong, 2014].
With general variables, customers are partitioned by characteristics that represent differences in the market. Geographic segmentation is often used by companies as a fundamental technique that can be complemented by additional types of data – demographic variables for instance. In geographic segmentation, enterprises gain information from their customers concerning their postcode, country, city, district, etc. On the basis of this information, they create different segments and develop various strategies for their clients. Geographic segmentation is extremely important to international marketing and the combination of relevant data and geographic clustering methods can provide accurate specification of market segments [Kotler & Keller, 2008].
1. Logistic Performance Index and Dealing with Construction Permits
The Logistic Performance Index (LPI) classified 160 countries on the basis of six variables of trade. These six dimensions comprise the efficiency of customs and border clearance management; the quality of trade and transport infrastructure; the ease of arranging competitively priced shipments; the competence and quality of logistics services – trucking, forwarding and customs brokerage; the ability to track and trace consignments; and the frequency with which shipments reach consignees within scheduled or expected delivery times.
The Logistic Performance Index is created on the basis of worldwide research. Logistics professionals are questioned in the survey and provide feedback on the logistics friendliness of the countries in which they operate and trade. The LPI is a combination of qualitative and quantitative data resulting from the in-depth knowledge and experience of logistics professionals who assess the countries in which they operate [World Bank Group, 2015b].
site maps and urbanism certificates. This process also includes hiring external third-party supervisors, engineers or inspectors. All the necessary clearances and licenses, the necessary inspection and the submission of all required notifications are evaluated within the construction permit process. The procedures for obtaining connections to water and sewerage mains and the procedures necessary for registering a warehouse so that it can be used as collateral or transferred to another entity are also assessed. First and foremost, the time and financial costs of building a new warehouse are included and measured in the evaluation process.
The indicator Dealing with Construction Permits consists of four variables: procedures, time, costs and building quality control.
A procedure means any interaction between the company and external parties such as government agencies, notaries, the land registry, the cadastre, utility companies and public inspectors.
Time is measured in days. The median duration to complete a procedure in practice is measured.
Costs include obtaining land use approvals and preconstruction design clearances; receiving inspections before, during and after construction; obtaining utility connections, and registering the warehouse property.
The building quality control variable consists of the following six indices: the quality of building regulations, quality control before construction, quality control during construction, quality control after construction, liability and insurance regimes, and professional certification indices.
The ranking of countries in terms of the ease of Dealing with Construction Permits is determined by classifying their distance to frontier scores (DTF) for Dealing with Construction Permits. These outputs are the average of the distance to frontier scores for each of the component indicators. This distance is reflected on a scale from 0 to 100, where 0 means the lowest performance and 100 indicates the highest performance. For instance, a score of 70 in 2014 means that the given economy was 30 percentage points away from the frontier established from the best performances across all economies and across time [World Bank Group, 2015a].
2. Methods and purpose
This paper focuses on the classification of market attractiveness for enterprises that are intending to set up new logistics centres in selected countries within the European Union. The attractiveness of EU countries for these logistics centres is defined by two dimensions: the Logistic Performance Index and the indicator Dealing with Construction Permits. It is important to emphasise that there are other important dimensions that can be used for clustering, such as the differing costs of human labour. However, the selected dimensions LPI and Dealing with Construction Permits themselves include many factors such as costs, time, procedures, controls, quality of building regulations and constructions, insurance regimes and others that are relevant to the construction of new logistics centres. In this article, the attractiveness of the market is understood primarily from the procedural point of view.
points for enterprises that are willing to open new logistics centres in Europe. For instance, German retailer Lidl is expanding its logistics centre in Romania near Lugoj [EuropaProperty.com, 2016] and Amazon wants to expand its complaints centre near Horní Počernice in the Czech Republic [CTK, 2015].
2.1 Cluster analysis
Cluster analysis is a statistical method used for dividing a set of elements into clusters. Each group is homogeneous with respect to certain characteristics based on either a similarity or dissimilarity metric. Cluster analysis is widely used as a suitable tool for marketing segmentation [Liu & Ong, 2008; Mentzer, Myers & Cheung, 2004; Raaij, Vernooij & Triest, 2003]. Clustering differs from simple ordering in the following terms: simple ordering would be possible if the data were one-dimensional, though this procedure would still not classify the data samples into classes. Nevertheless, multi-dimensional cases cannot be simply ordered because the decision-maker would have to choose the pivotal dimension and omit the rest. If all the dimensions are to be taken into account, then some kind of aggregate function has to be employed. Such a function could be arbitrary, for instance linear, i.e.:
1
1
, , ,
n
i i in j ij
j
f d d d
where the coefficient j is chosen by the user or by the character of j-th dimension data
range. Such a function is, however, included in Ward’s clustering method.
2.2 Hierarchical agglomerative clustering algorithms
Hierarchical clustering algorithms were developed to avoid a number of the disadvantages of flat or partition-based clustering approaches. Partial methods in general require a user-predefined parameter K to achieve a clustering solution, for which reason they are nondeterministic. Hierarchical algorithms have been developed to create a more deterministic and flexible attitude to data clustering [Jain et al., 1999].
A cluster hierarchy uses standard binary tree terminology. The roots include all the sets of data objects for clustering, thereby forming the apex of hierarchy. The entries in each cluster can be defined by traversing the tree from the current cluster to the base singleton data points. Every level in the hierarchy equals a certain amount of clusters. The hierarchical base contains all singleton points, which create the leaves of the tree. This hierarchy of clusters is called a dendrogram. The greatest advantage of the hierarchical clustering method is the fact that it is possible to cut the hierarchy at any given level and to obtain a number of clusters correspondingly [Aggarwal & Reddy, 2013]. There are two general proposals for hierarchical clustering:
Agglomerative: this is a bottom-up approach in which each observation begins in its own cluster, and pairs of clusters are merged until the final maximal cluster is obtained.
One of the basic marketing concepts is the concept of segmentation, i.e., classification of segmented subjects into groups according to their similarity of attributes. This concept does not, however, possess any particular mathematical representation. On the other hand, there is the well elaborated concept of clustering, which is analogical to segmentation. When the problem of classification is tackled, having only a raw dataset of n dimensions (n ≥ 1), there have to be metrics (or a criterion) that determine the size and composition of classes (or clusters). The metrics decide whether various data samples within the dataset are close enough to each other, in respect of n dimensions, to be classified as members of the same class. Such metrics are included in Ward’s method.
Ward’s criterion was chosen for use in this paper. The advantage of Ward’s criterion is that it produces a cluster tree that is compact and monotonic. This is the result of its incremental design in the definition of distance and it means (in contrast to a non-monotonic tree) that the sections of the dendrogram do not change direction [Alikhanian et al., 2013]. Ward’s criterion was proposed to calculate the distance between two clusters within the agglomerative hierarchy clustering method. The K-means sum of squared error criterion is used to determine the distance. The sum of the squared error criterion for any two clusters Ca and Cb is computed by measuring the increase in the value of Ward’s criterion for the clustering obtained by merging them into CaCb[Ward, 1963]. There are certain implementations of Ward’s criterion which differ in terms of the distance metric .
The distance metric used in this paper is defined as the squared Euclidean distance between the two centroids of the merged clusters Ca and Cbweighted by a proportional
factor to the product of cardinalities of the merged clusters [Aggarwal & Reddy, 2013] and is defined as follows:
2
1
, , ,
M
a b a b
a b av bv a b
v
a b a b
N N N N
C C c c d c c
N N N N
(1)where:
Na and Nb are the cardinalities of the clusters Ca and Cb,
ca and cb are elements of Ca and Cb respectively,
υ iterates up to the total number of elements in the cluster union M, and
d is the squared Euclidean distance between the two centroids.
3. Discussion
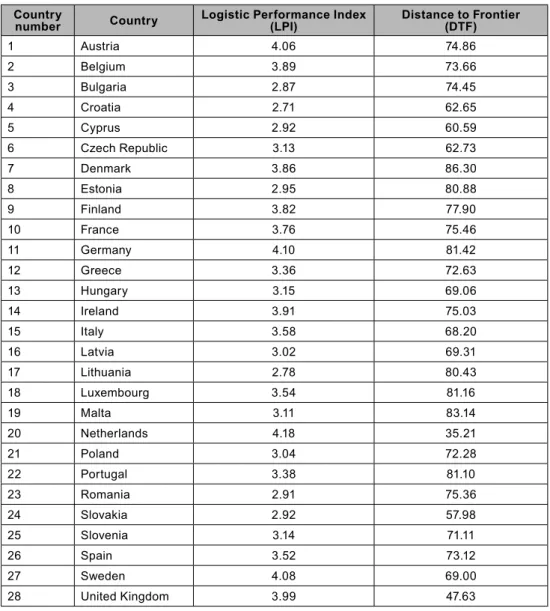
Table 1 | The Logistic Performance Index and the criterion Dealing with Construction Permits in EU countries
Country
number Country
Logistic Performance Index (LPI)
Distance to Frontier (DTF)
1 Austria 4.06 74.86
2 Belgium 3.89 73.66
3 Bulgaria 2.87 74.45
4 Croatia 2.71 62.65
5 Cyprus 2.92 60.59
6 Czech Republic 3.13 62.73
7 Denmark 3.86 86.30
8 Estonia 2.95 80.88
9 Finland 3.82 77.90
10 France 3.76 75.46
11 Germany 4.10 81.42
12 Greece 3.36 72.63
13 Hungary 3.15 69.06
14 Ireland 3.91 75.03
15 Italy 3.58 68.20
16 Latvia 3.02 69.31
17 Lithuania 2.78 80.43
18 Luxembourg 3.54 81.16
19 Malta 3.11 83.14
20 Netherlands 4.18 35.21
21 Poland 3.04 72.28
22 Portugal 3.38 81.10
23 Romania 2.91 75.36
24 Slovakia 2.92 57.98
25 Slovenia 3.14 71.11
26 Spain 3.52 73.12
27 Sweden 4.08 69.00
28 United Kingdom 3.99 47.63
Source: WORLD BANK GROUP, 2015b. Logistics Performance Index [online]. [accessed December 13, 2015]. Available at: http://lpi.worldbank.org/about; adjusted by authors
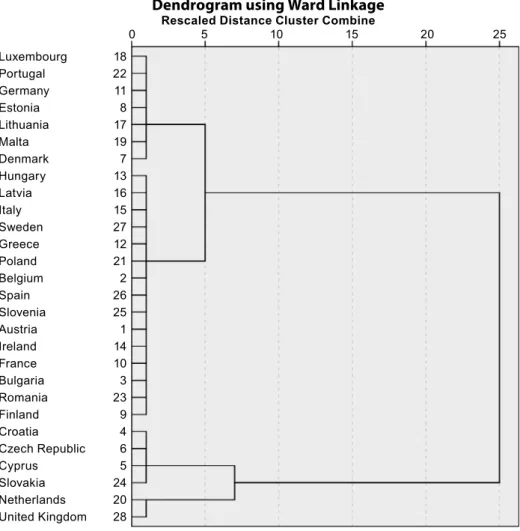
The data presented in Table 1 were used for a hierarchical clustering by applying Ward’s criterion. The dendrogram in Figure 1 is the output of the data processing. Both variables of the data set were standardised to a range of [0,1].
known as linkage criteria to determine distances between data samples. Mutual linkages are measured in the normalised distances represented in the dendrogram. The general idea is to choose the most appropriate number of clusters according to the graphical representation in the dendrogram. It can be seen that the possible number of clusters is 28, 4, 3, 2 or 1. The cases of 28 and 1 can be omitted immediately, as both single-element classes and a single all-inclusive class are meaningless. Then one has to decide whether to use 2, 3 or 4 clusters. It is obvious from the dendrogram that the first possible number of clusters is 4. As the process of linkage continues, two clusters are merged at the rescaled distance 5 and the other two are merged immediately afterwards at distance 7. Then a large “gap” occurs and finally the two clusters are merged into one at distance 25. Therefore, a reasonable number of clusters would be 4 or 2, because 3 clusters are not particularly stable in terms of the linkage process. It is also possible to select only 2 clusters, but their elements would be more heterogeneous than in the case of 4 clusters. In view of this, the optimal number of clusters has been set at 4.
Figure 1 | Dendrogram of clustered EU countries using Ward’s criterion
Source: Authors’ own elaboration Luxembourg 18
Portugal 22 Germany 11 Estonia 8 Lithuania 17 Malta 19 Denmark 7 Hungary 13 Latvia 16 Italy 15 Sweden 27 Greece 12 Poland 21 Belgium 2 Spain 26 Slovenia 25 Austria 1 Ireland 14 France 10 Bulgaria 3 Romania 23 Finland 9 Croatia 4 Czech Republic 6 Cyprus 5 Slovakia 24 Netherlands 20 United Kingdom 28
Dendrogram using Ward Linkage
Rescaled Distance Cluster Combine
Each cluster is comprised of a group of countries which have similar characteristics depending on the value of the two selected dimensions – LPI and DTF. The identified clusters can be described as follows.
● Cluster 1 contains the following countries: Luxembourg, Portugal,
Germany, Estonia, Lithuania, Malta and Denmark. These countries are characterised by high DTF which means smooth procedures for obtaining construction permits. If an enterprise wishes to build a logistics centre in these countries, it can count on a smooth handling process. This cluster has a high value of both metrics, for which reason investors can consider these countries the most attractive for commencing the development of logistics centres.
● Cluster 2 includes the following countries: Hungary, Latvia, Italy, Sweden,
Greece, Poland, Belgium, Spain, Slovenia, Austria, Ireland, France, Bulgaria, Romania and Finland. This is the largest cluster and its countries are characterised by average values for both metrics. These countries have a higher DTF than those in cluster 3, though the LPI is very similar. Investors should regard the infrastructure and bureaucracy policies of the members of this cluster as mainstream. However, when comparing their DTF with its referential value 100, it is clear that there are still small obstacles in the process of obtaining construction permits.
● Cluster 3 comprises Croatia, the Czech Republic, Cyprus and Slovakia.
These countries have a lower Logistic Performance Index and Dealing with Construction Permits is also problematic. These markets are less attractive from the point of view of investors. Although these countries do not have the worst values of LPI and DTF, their combination is not particularly advantageous. Potential investors cannot expect a smooth procedure associated with the construction of logistics centres.
● Cluster 4 is comprised of the Netherlands and the United Kingdom. These
two countries are characterised by very low DTF and very high LPI. These markets are attractive for potential investors, but they must reckon with many obstacles in the approval process. Enterprises can eventually expect high-quality trade and transport infrastructure, but a diffi cult process of obtaining construction permits.
Conclusion
clustered into groups according to market attractiveness, and the fundamental starting points for enterprises that are interested in opening new logistics centres in Europe were formulated. Four groups at the value 5 of rescaled distance cluster were identified to obtain countries with a high level of homogeneity. The following starting points were formulated for enterprises interested in establishing new logistics centres in Europe on the basis of the given output.
Countries within cluster 1 were identified as the most attractive markets. Luxembourg, Portugal, Germany, Estonia, Lithuania, Malta and Denmark are the countries that belong to cluster 1. These markets are characterised by a high Logistic Performance Index and rating of Dealing with Construction Permits and offer great opportunities for establishing new logistics centres. Investors can rely on smooth procedural negotiations with authorities such as government agencies, notaries, the land registry and public inspectors. The great advantages for investors are the high quality of trade and transport infrastructure and the ease of arranging competitively priced shipments. Enterprises can also expect that the procedures connected with the construction of new logistics centres will not be time-consuming.
Cluster 2 comprises Hungary, Latvia, Italy, Sweden, Greece, Poland, Belgium, Spain, Slovenia, Austria, Ireland, France, Bulgaria, Romania and Finland. These countries have quite a high Logistic Performance Index and even though potential investors can expect the process of Dealing with Construction Permits to be a little more complicated, these markets offer quite good conditions, first and foremost the extremely high standard of trade and transport infrastructure as well as the quality of logistics services being extremely attractive factors for potential investors.
Croatia, the Czech Republic, Cyprus and Slovakia belong to cluster 3. These countries have a lower LPI and enterprises also have to reckon with problematic procedures connected with construction permits. The big disadvantage for potential investors can be seen in the lower level of both indexes. All procedures will be more time-consuming. It is very probable that assistance of third parties such as inspectors or engineers will be needed, meaning that the costs of construction will be higher. Investors will have to count on the given disadvantages if they intend to build a logistics centre in, for example, the Czech Republic or Slovakia because of the good location of these countries.
The Netherlands and the United Kingdom are the countries that belong to cluster 4. On the one hand they are characterised by a high level of LPI, while on the other hand these countries has a very low DTF. For potential investors it is necessary to emphasise the complication of the procedures connected with the extremely difficult process of obtaining construction permits. It is necessary to count on hiring external supervisors, engineers and inspectors. It is, therefore, necessary to count on higher costs. A high LPI cannot compensate for all these inconveniencies, and potential investors should try to find a more suitable country in Europe.
References
AGGARWAL, C. C. & REDDY, C. K. (eds.), 2013. Data clustering: algorithms and applications.
Chapman and Hall/CRC. ISBN 978-1466558212.
ALIKHANIAN, H., CRAWFORD, J., DESOUZA, J., CHEYNE, D. & BLOHM, G., 2013. Adaptive cluster analysis approach for functional localization using magnetoencephalography. Frontiers in Neuroscience, 7.
DOI: http://dx.doi.org/10.3389/fnins.2013.00073.
ANDERSON, C. H. & VINCZE, J. V., 2003. Strategic marketing management (2nd Edition). New York: Houghton Mifflin Harcourt. ISBN 978-0618338078.
CTK (Czech News Agency), 2015. Amazon otevře v pražských Horních Počernicích další halu. Zaměstná až tři tisíce lidí [online]. [accessed December 15, 2015]. Hospodářské noviny
14. 12. 2015. Available at: http://byznys.ihned.cz/c1-64978570-amazon-otevre-v-prazskych-hornich-pocernicich-dalsi-halu-zamestna-az-tri-tisice-lidi
DIBB, S. & SIMKIN, L., 1995. The market segmentation workbook: target marketing for marketing managers. London: Routledge. ISBN 9780415118927.
EUROPA PROPERTY, 2016. German retailer Lidl invests in logistics centre in western Romania [online]. [accessed January 28, 2016]. EuropaProperty.com. Available at:
http://europaproperty.com/news/2016/01/german-retailer-lidl-invests-in-logistics-centre-in-western-romania-2231
CHILD, P., DIEDERICHS, R., SANDERS, F. H. & WISNIOWSKI, S., 1991. SMR Forum: ‘the management of complexity’. Sloan Management Review, 33(1), 73–80.
HUANG, J., TZENG, G. & ONG, C., 2007. Marketing segmentation using support vector clustering. Expert Systems with Applications, 32(2), 313–317.
DOI: http://dx.doi.org/10.1016/j.eswa.2005.11.028.
JAIN, A. K., MURTY, M. N. & FLYNN, P. J., 1999.Data clustering: a review. ACM Computing Surveys
31(3), 264–323. DOI: http://dx.doi.org/10.1145/331499.331504.
KOTLER, P. & ARMSTRONG, G., 2014. Principles of marketing. Prentice Hall International. ISBN 978-0133084047.
KOTLER, P. & KELLER, K., 2008. Marketing management (13th Edition). Pearson Prentice Hall. ISBN 978-0136009986.
LIAUTAUD, B. & HAMMOND, M., 2001. e-Business intelligence: turning information into knowledge into profit. New York: McGraw-Hill, Inc. ISBN 9780071364782.
LIU, H. & ONG, C., 2008. Variable selection in clustering for marketing segmentation using genetic algorithms. Expert Systems with Applications, 34(1), 502–510,
DOI: http://dx.doi.org/10.1016/j.eswa.2006.09.039.
MAIMON, O. & ROKACH, L., 2005. Data mining and knowledge discovery handbook. New York: Springer. ISBN 9780387244358.
MCDONALD, M. & DUNBAR, I., 2004. Determining the attractiveness of market segments. In
Market segmentation how to do it, how to profit from it (3rd Edition). Amsterdam: Elsevier/ Butterworth-Heinemann. ISBN 9780750659819.
MORGAN, N., KALEKA, A. & KATSIKEAS, C., 2004. Antecedents of export venture performance: a theoretical model and empirical assessment. Journal of Marketing, 68(1), 90–108. DOI: http://dx.doi.org/10.1509/jmkg.68.1.90.24028.
RAAIJ, E. M., VERNOOIJ, M. J. A. & TRIEST, S., 2003. The implementation of customer profitability analysis: a case study. Industrial Marketing Management, 32(7), 573–583.
DOI: http://dx.doi.org/10.1016/S0019-8501(03)00006-3.
WARD, J. R. & JOE, H., 1963. Hierarchical grouping to optimize an objective function. Journal of the American Statistical Association, 58(301), 236–244.
DOI: http://dx.doi.org/10.1080/01621459.1963.10500845.
WEDEL M. & KAMAKURA, W. A., 2000. Market segmentation: conceptual and methodological foundations. Springer. ISBN 978-0-7923-8635-3.
WORLD BANK GROUP, 2015a. Dealing with construction permits methodology [online]. [accessed January 2, 2016]. World Bank. Available at:
http://www.doingbusiness.org/methodology/dealing-with-construction-permits WORLD BANK GROUP, 2015b. Logistics performance index [online]. [accessed December 13,