Submitted2 November 2015
Accepted 24 February 2016
Published21 March 2016
Corresponding authors
Jonathan H. Chan, [email protected] Wanwipa Vongsangnak, [email protected], [email protected] Academic editor Terry Furey
Additional Information and Declarations can be found on page 19
DOI10.7717/peerj.1811 Copyright
2016 Patumcharoenpol et al.
Distributed under
Creative Commons CC-BY 4.0
OPEN ACCESS
An integrated text mining framework
for metabolic interaction network
reconstruction
Preecha Patumcharoenpol1,2,*, Narumol Doungpan3, Asawin Meechai1,4, Bairong Shen2, Jonathan H. Chan1,3and Wanwipa Vongsangnak2,5,*
1Systems Biology and Bioinformatics Laboratory, King Mongkut’s University of Technology Thonburi,
Bangkok, Thailand
2Center for Systems Biology, Soochow University, Suzhou, China
3School of Information Technology, King Mongkut’s University of Technology Thonburi, Bangkok, Thailand
4Department of Chemical Engineering, Faculty of Engineering, King Mongkut’s University of Technology
Thonburi, Bangkok, Thailand
5Department of Zoology, Faculty of Science, Kasetsart University, Bangkok, Thailand
*These authors contributed equally to this work.
ABSTRACT
Text mining (TM) in the field of biology is fast becoming a routine analysis for the extraction and curation of biological entities (e.g., genes, proteins, simple chemicals) as well as their relationships. Due to the wide applicability of TM in situations involving complex relationships, it is valuable to apply TM to the extraction of metabolic interactions (i.e., enzyme and metabolite interactions) through metabolic events. Here we present an integrated TM framework containing two modules for the extraction of metabolic events (Metabolic Event Extraction module—MEE) and for the construction of a metabolic interaction network (Metabolic Interaction Network Reconstruction module—MINR). The proposed integrated TM framework performed well based on standard measures of recall, precision and F-score. Evaluation of the MEE module using the constructed Metabolic Entities (ME) corpus yielded F-scores of 59.15% and 48.59% for the detection of metabolic events for production and consumption, respectively. As for the testing of the entity tagger for Gene and Protein (GP) and metabolite with the test corpus, the obtained F-score was greater than 80% for the Superpathway of leucine, valine, and isoleucine biosynthesis. Mapping of enzyme and metabolite interactions through network reconstruction showed a fair performance for the MINR module on the test corpus with F-score >70%. Finally, an application of our integrated TM framework on a big-scale data (i.e., EcoCyc extraction data) for reconstructing a metabolic interaction network showed reasonable precisions at 69.93%, 70.63% and 46.71% for enzyme, metabolite and enzyme–metabolite interaction, respectively. This study presents the first open-source integrated TM framework for reconstructing a metabolic interaction network. This framework can be a powerful tool that helps biol-ogists to extract metabolic events for further reconstruction of a metabolic interaction network. The ME corpus, test corpus, source code, and virtual machine image with pre-configured software are available atwww.sbi.kmutt.ac.th/~preecha/metrecon.
SubjectsBioinformatics, Computational Biology
INTRODUCTION
Biological literature is vast and quickly growing. Text mining (TM) has become a routine analysis tool for rapidly scanning the entire literature with an essential goal to extract the relationships between named biological entities and concepts. Different examples of TM applications to network construction have been reported, such as protein–protein in-teractions (Saetre et al., 2010;Kabiljo, Clegg & Shepherd, 2009;Airola et al., 2008;Srihari & Leong, 2013), gene–gene relationships in co-expression and regulatory networks (Rodríguez-Penagos et al., 2007;Song & Chen, 2009;Van Landeghem et al., 2013), and gene–disease re-lationships (Bell et al., 2011;Ozgür et al., 2008). In addition to a wide range of applications, TM is currently adapted for assisting in compiling relationships of biological data from free texts in biological literature and databases (Hirschman et al., 2012;Neves et al., 2013). In order to face the challenges due to biological complexity, TM tasks have recently advanced from performing simple interaction extraction towards obtaining a better understanding of the semantics behind biological interactions by analyzing associated events. This task is known as event extraction. This development was presented in the form of the BioNLP Shared Task (BioNLP-ST) (Kim et al., 2011), which is a biological community-wide effort to advance the development of natural language processing (NLP). Recently, BioNLP-ST’13 (Kim, Wang & Yasunori, 2013) focused on complex relationships, especially related to the topic of biomolecular reactions, pathways and regulatory networks (Van Landeghem & Ginter, 2011;McClosky et al., 2012;Gerner et al., 2012;Bossy, Bessières & Nédellec, 2013; Ohta et al., 2013). Focusing on metabolic relationships, the Pathway Curation (PC) Task— BioNLP-ST’13 presented byOhta et al. (2013)introduced an event extraction task setting to account for metabolic pathways.
Despite the great interest in the use of TM tools for the extraction and annotation of biological entities of genes, proteins, or simple chemicals through the curation of events and pathways, there have been limited studies to date at a biological system scale (e.g., events with interaction network).
freely available thus far. Moreover, PathText (Kemper et al., 2010) is a pathway curating environment which integrates pathway visualizers, TM systems, and annotation tools into one unified environment. However, PathText (Kemper et al., 2010) is not openly available. Recently,Czarnecki et al. (2012)developed a rule-based approach to reconstruct Escherichia colimetabolic pathways from literature cited in EcoCyc database (Keseler et al., 2013). Czarnecki et al. achieved recall and precision of 29–70% and 14–41%, respectively for metabolic reaction extraction method on evaluated pathways. Their results suggest the possibility of automating the process of extracting metabolic interactions from free texts.
Despite these efforts, many TM tools remain restricted, such as not being freely available (e.g., GeneWays and Pathtext) or working with merely provided input data (e.g., Pathbinder). Regarding on machine learning (ML) components of TM tools, their primary difference depends on text mining objective and task. These restrictions reduce a tool’s ability to integrate a TM framework for automated extracting metabolic interactions from literature. This is a prevalent problem because metabolic studies rely on biological literature. Considering the process of reconstruction of a metabolic interaction network under normal circumstances, biologists depend on the literature and biological databases for annotation and assignment of genes, enzymes, proteins, and metabolites relationships (Bordbar & Palsson, 2012;Feist et al., 2009;Heavner et al., 2012;Poolman et al., 2009;Liu et al., 2013). Unless an integrated tool for assisting annotation is available, biologists need to perform gene and functional assignments towards metabolic interaction network using manual curation, which can be both a labor intensive and time consuming task (Andersen, Nielsen & Nielsen, 2008;Baumgartner et al., 2007).
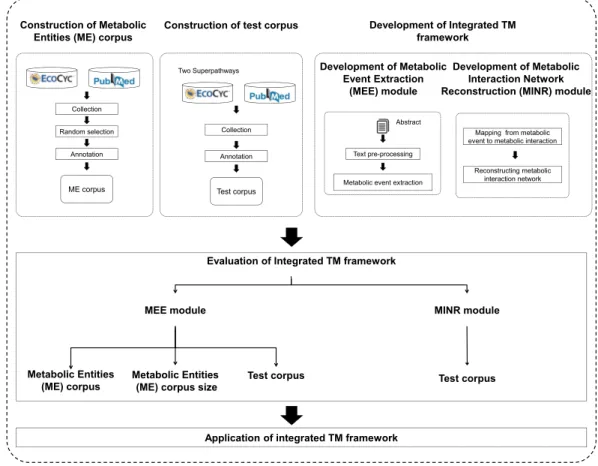
With the current state of TM research in a metabolic context, we developed an integrated TM framework to meet the above mentioned challenges. The objective of this study is to perform integration of various TM tools to develop a framework to extract metabolic events and further use the framework for reconstructing a metabolic interaction network. To achieve this task, we initially constructed a Metabolic Entities (ME) corpus composed of a representative set of the metabolic events (i.e., events with a mechanical description of the metabolic interaction). We thereafter took the constructed corpus for further use in the development of a TM framework. The TM framework contains two developed modules. The first module, Metabolic Event Extraction (MEE) module, is used for extracting metabolic events from the constructed corpus. The second module, Metabolic Interaction Network Reconstruction (MINR) module, is used for reconstructing metabolic interaction networks. For overall evaluation of the integrated TM framework, the predicted entities and pathways were compared to the manually-curated metabolic entities and pathways in the EcoCyc database and the genome-scale metabolic network ofEscherichia coli. The integrated TM framework generates metabolic interaction networks in forms of a bipartite metabolic graph and of an enzyme–metabolite interaction pair. The results can be visualized using several types of tools for the task of reconstruction of a metabolic interaction network.
MATERIALS & METHODS
Figure 1 A schematic diagram outlining the development steps for the proposed integrated TM frame-work.Note: Metabolic entities corpus size means the effect of different corpus sizes on performance of MEE module within the integrated TM framework.
(iii) development of MEE module; (iv) development of MINR module; (v) evaluation of integrated TM framework; and (vi) application of integrated TM framework.
Construction of Metabolic Entities (ME) corpus
Table 1 Description of entity types.
Entity type Reference Ontology ID
Gene or Protein (GP) Ecocyc SBO:0000246
Metabolite ChEBI SBO:0000247
Table 2 Description of metabolic event types.
Event type Argument Description Ontology ID
Metabolic production Theme: Metabolite,
Cause: Enzyme
Metabolic event that results in formation of metabolite. SBO:0000176
Metabolic consumption Theme: Metabolite,
Cause: Enzyme
Metabolic event that results in consumption of metabolite. SBO:0000176
Metabolic reaction Theme: Metabolite,
Cause: Enzyme
Metabolic event that results in conversion of metabolite. SBO:0000176
Positive regulation Theme: Event,
Cause: Enzyme
Enzyme related to a process that positively regulates a metabolic event. GO:0048518,
GO:0044093
entities according to our annotation guideline (www.sbi.kmutt.ac.th/~preecha/metrecon). Table 1 presents annotated entity types along with reference databases i.e., EcoCyc and ChEBI and Systems Biology Ontology (SBO) ID. Afterwards, manual correction using BRAT (Stenetorp, Pyysalo & Topic, 2012) by individual domain experts was performed. The metabolic events in the abstracts and titles were annotated according to four types of the metabolic events (i.e., metabolic production, metabolic consumption, metabolic reaction, and positive regulation). Eventually, these annotations were merged to create a final annotation set. For the definition and scope of the metabolic event annotation, the Systems Biology Ontology (SBO) and the Gene Ontology (GO) are considered. Table 2presents the annotated metabolic event types, arguments and their Ontology ID. A hierarchical representation of the metabolic entities and events is illustrated inFig. 2A. Also, an example of annotation for metabolic entities and events can be seen inFig. 2B. For metabolic entities, the annotation identifies phosphoglucosamine mutase and GlmM as GP entities and glucosamine-1-phosphate and glucosamine-6-phosphate as metabolite entities. For metabolic events, the annotation identifies event words of catalyzes and formation as event types of positive regulation and metabolic reaction, respectively. Note that this ME corpus focuses only on metabolic interactions (i.e., enzyme–metabolite interactions) throughout metabolic events at the end. Other types of data, e.g., substrates, products, co-enzymes and co-factors, were considered as metabolites. For discussion of the relation between these entities and event types and the other representations applied in ME corpus, Ohta et al. (2013)was used as a reference.
To measure an inter-annotation agreement, 20 abstracts and titles were randomly selected as an example case. The two annotators annotated these abstracts and titles according to the annotation guidelines (www.sbi.kmutt.ac.th/~preecha/metrecon). These annotated abstracts and titles were then used to manually construct consensus annotation.
Figure 2 A schematic annotation of metabolic entities and events.(A) Hierarchical representation of metabolic entities and events. (B) An example of metabolic entities and events annotation.
Table 3 Inter-annotator agreement of constructed ME corpus.
Data Annotator A Annotator B Annotator A/Annotator B F-score (%) F-score (%) Cohen’s kappa coefficient Entities
GP 96.17 96.03 0.96
Metabolite 93.58 91.72 0.92
Events
Metabolic production 90.24 83.33 0.72
Metabolic consumption 96.88 85.71 0.74
Metabolic reaction 74.07 75.47 0.90
Positive regulation 85.71 94.44 0.77
entities, metabolite entities and events. Additionally, the Cohen’s kappa coefficient (Cohen, 1960) was also considered as a statistical measure of inter-annotator agreement for GP entities, metabolite entities and events. The overall performance difference between annotators A and B is not significant when compared to consensus annotation (F-scores range from 74.07% to 96.88%) (see Table 3). Also, the agreement between the two annotators were high across all categories (kappa coefficients range from 0.72 to 0.96). It is worth noting that multiple interpretations of numerous entities and events between the two annotators may cause high variability of the inter-annotator agreement level.
Construction of test corpus
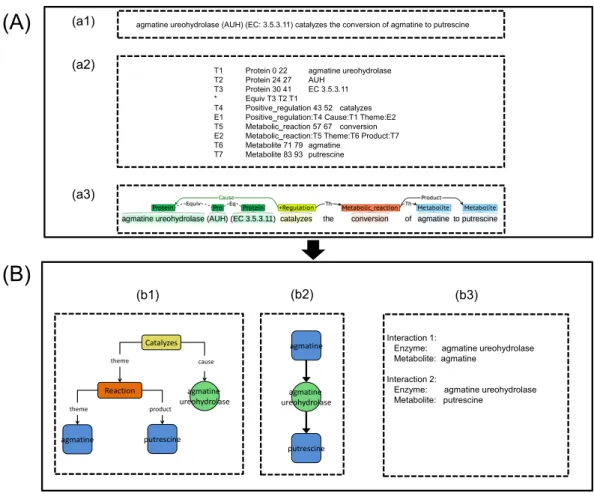
Figure 3 An illustration showing the process implementation of the proposed integrated TM frame-work.(A) Metabolic Event Extraction (MEE) module; (a1) Input text for MEE module, (a2) Output text
from MEE module, (a3) Text output visualization using BRAT (Stenetorp, Pyysalo & Topic, 2012). (B)
Metabolic Interaction Network Reconstruction (MINR) module; (b1) Intermediate graphical output from MINR module, (b2) Graphical output from MINR module, (b3) enzyme–metabolite interactions pair from MINR module.
the EcoCyc and PubMed databases, i.e., the Superpathway of leucine, valine, and isoleucine biosynthesis (18 articles) and the Superpathway of pyridoxal 5′-phosphate biosynthesis and salvage (9 articles). The abstract, introduction and title sections of an article were used because they provide a major summary of the research article, supporting statement and theoretical context. It is also noted that these two selected Superpathways were relatively large compared to others and therefore a considerable number of abstracts, titles and introductions could be collected for test corpus construction. Regarding the annotation process, it was performed as described in the earlier section about the construction of a ME corpus.
Development of Metabolic Event Extraction (MEE) module
Text pre-processing
The input text (e.g., abstract) as seen inFig. 3A-a1was split into sentences using the GENIA Sentence Splitter (Sætre, Yoshida & Yakushiji, 2007). Each sentence was then parsed using the McClosky–Charniak–Johnson re-ranking parser (McClosky, Charniak & Johnson, 2006). All sentences with more than 100 tokens were skipped and the parser produced a n-best list of thenmost likely parses of the sentence (n=50 was set as the default parameters
in this study). Afterwards, the sentence was converted into collapsed dependency parse using the Stanford parser (Marneffe, Maccartney & Manning, 2006). Next, BANNER (Leaman & Gonzalez, 2008) was used for detecting all possible GP entities in the sentence. To carry out the subsequent MINR module development work on the metabolic interaction network, we selected only enzyme entities out of all possible GP entities throughout metabolic events by using event word, EcoCyc enzyme name and manual curation. For metabolite entities detection, BANNER trained on the yeast metabolite corpus (Nobata et al., 2011) was chosen based on our previous performance evaluation (Patumcharoenpol et al., 2012).
Metabolic event extraction
We retrofitted the Turku Event Extraction System (TEES) by reconfiguration of the entities and the event types as well as retraining TEES in order to support metabolites and metabolic event extraction. Notably, we selected TEES because of its overall performance and ability to handle large-scale datasets (Gerner et al., 2012;Björne, Van Landeghem & Pyysalo, 2012). TEES is an event classification tool, which utilizes various features from syntax analysis, such as tokens and dependency graphs to identify the probability of metabolic interaction between two entities (Björne & Salakoski, 2011). The TEES parameter was estimated from its internal Support Vector Machine while training using a grid search. The retrofitted TEES can be found in the virtual machine image available at www.sbi.kmutt.ac.th/~preecha/ metrecon.
Development of Metabolic Interaction Network Reconstruction (MINR) module
Once MEE module was developed, we further developed a MINR module. We divided the MINR module into two sub-sections: the mapping from metabolic event to metabolic interaction and reconstructing the metabolic interaction network by combinations of individual metabolic interactions.
Mapping from metabolic event to metabolic interaction
interaction graph, as illustrated inFigs. 3B-b1–3B-b2. The extracted enzyme–metabolite interaction pair could then be eventually obtained, as shown inFig. 3B-b3
Reconstructing metabolic interaction network
After mapping from the metabolic event to metabolic interaction, all possible extracted enzyme–metabolite interaction pairs were pooled together. Subsequently, all unique enzyme–metabolite interaction pairs were merged together and then mapped onto a metabolic interaction network. Metabolites were connected through shared enzymes. The resulting metabolic interaction network was enforced to be a bipartite metabolic graph (i.e., enzymes and metabolites). In the case of an incomplete metabolic interaction (e.g., no enzyme for the connecting metabolites), a missing node was filled with a proxy node in order to conform to a bipartite metabolic structure.
Evaluation of integrated TM framework
To evaluate the integrated TM framework, we assessed the MEE module and the MINR module, separately as described below. MEE module evaluation on three critical sub-parts: ME corpus, ME corpus size and test corpus was performed. In each sub-part, we calculated performance based on standard precision, recall, and F-score as performance measures (Van Rijsbergen, 1979).
To compare the obtained results with manually curated entities, we applied thesloppy span matching criterion to entities, which means that entities must match the types, but are not required to exactly match the entities boundaries (Czarnecki et al., 2012). For metabolic events, the comparison criterion that is termedapproximated boundary matching (Kim et al., 1979) was used. In particular, the three criteria used were: (i) identical metabolic event type, (ii) sloppy span matching between metabolic event trigger span, and (iii) at least one matching or all matching of arguments. We used these criteria in this study due to strong supporting evidence that they are better in terms of information retrieval than the alternative exact matching criterion, where boundaries between two entities are required to match exactly (Kabiljo, Clegg & Shepherd, 2009;Shepherd & Kabiljo, 2008).
MEE module evaluation on ME corpus
We performed five-fold cross-validation on the abstracts and titles for error estimation of MEE module. The total number (D) of the abstracts and the titles within ME corpus was randomly partitioned into five approximately equal numbers (D1,D2. . . ,D5). An individual fold was iteratively left out and used as the testing dataset while the remaining data were used as the training dataset.
MEE module evaluation on ME corpus size
MEE module evaluation on test corpus
We evaluated the entities prediction performance of the MEE module using the test corpus as a reference. That is, we ran entities prediction using the MEE module on the test corpus. The predicted results of GP and metabolite entities were then compared to the manually-curated entities in test corpus.
MINR module evaluation on test corpus
A list of manually-curated metabolic interactions was initially prepared for the MINR module evaluation on the test corpus as provided inFile S2. After applying the MINR module on the test corpus for further metabolic interaction network reconstruction, the predicted results were then compared to the manually-curated metabolic interactions list (File S2) for evaluation throughout calculation of the recall, the precision, and the F-score.
Application of integrated TM framework
To demonstrate the application of the integrated TM framework, we presented two case studies. The first case study showed a comparative analysis of our integrated TM framework with another TM system developed byCzarnecki et al. (2012)on the test corpus for reconstruction of the Superpathway of leucine, valine, and isoleucine biosynthesis. To elaborate, we ran our integrated TM framework on the test corpus to extract the metabolic events and mapped them to metabolic interactions for the Superpathway reconstruction. Once completed, we then performed a comparative analysis of the reconstructed network with the other results achieved by the TM system developed byCzarnecki et al. (2012).
For the second case study, the integrated TM framework with EcoCyc extraction was applied to reconstruct a metabolic interaction network. EcoCyc extraction is a collection list of references from the EcoCyc database (2,373 abstracts and titles). In brief, we first ran the integrated TM framework on EcoCyc extraction in order to extract a list of enzyme, metabolite, and enzyme–metabolite interactions association with metabolic events. Also, we ran the integrated TM framework on the ME corpus for performance comparison. To evaluate the performance, the predicted entities in terms of enzymes, metabolites, and enzyme–metabolite interactions were compared to the manually-curated metabolic entities in the EcoCyc database for calculating the precision. A published genome-scale metabolic network ofE. coliK-12 MG1665 (iJO1366) (Orth et al., 2011) was also used as the manually-curated metabolic pathways for metabolic interaction network reconstruction.
The integrated TM framework could be run using the virtual machine image on one of Mac, Windows, or Linux system with the pre-configured software available at www.sbi.kmutt.ac.th/~preecha/metrecon. The source code in the virtual machine is licensed under Apache License 2.0.
RESULTS AND DISCUSSION
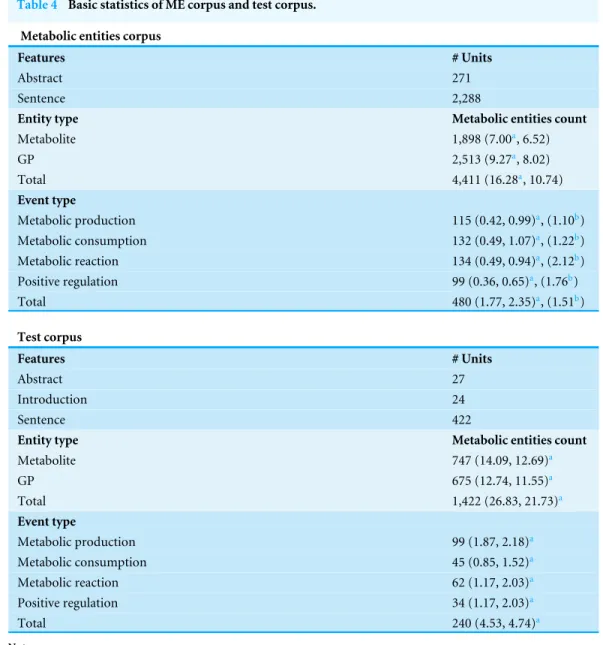
Table 4 Basic statistics of ME corpus and test corpus.
Metabolic entities corpus
Features # Units
Abstract 271
Sentence 2,288
Entity type Metabolic entities count
Metabolite 1,898 (7.00a, 6.52)
GP 2,513 (9.27a, 8.02)
Total 4,411 (16.28a, 10.74)
Event type
Metabolic production 115 (0.42, 0.99)a, (1.10b)
Metabolic consumption 132 (0.49, 1.07)a, (1.22b)
Metabolic reaction 134 (0.49, 0.94)a, (2.12b)
Positive regulation 99 (0.36, 0.65)a, (1.76b)
Total 480 (1.77, 2.35)a, (1.51b)
Test corpus
Features # Units
Abstract 27
Introduction 24
Sentence 422
Entity type Metabolic entities count
Metabolite 747 (14.09, 12.69)a
GP 675 (12.74, 11.55)a
Total 1,422 (26.83, 21.73)a
Event type
Metabolic production 99 (1.87, 2.18)a
Metabolic consumption 45 (0.85, 1.52)a
Metabolic reaction 62 (1.17, 2.03)a
Positive regulation 34 (1.17, 2.03)a
Total 240 (4.53, 4.74)a
Notes.
aThe average number of units and per abstract and Standard Deviation (SD).
bThe average number of arguments per metabolic event.
ME corpus statistics
Our constructed ME corpus consists of annotated GP, metabolite entities, and metabolic events.Table 4shows the basic statistics for the constructed ME corpus. Of the 271 abstracts and titles selected from the PubMed database (see ‘Methods’), we found a total number of 2,513 entities for GP and 1,898 entities for metabolite, corresponding to 9.27 and 7.00 entities per abstract for GP and metabolite, respectively.
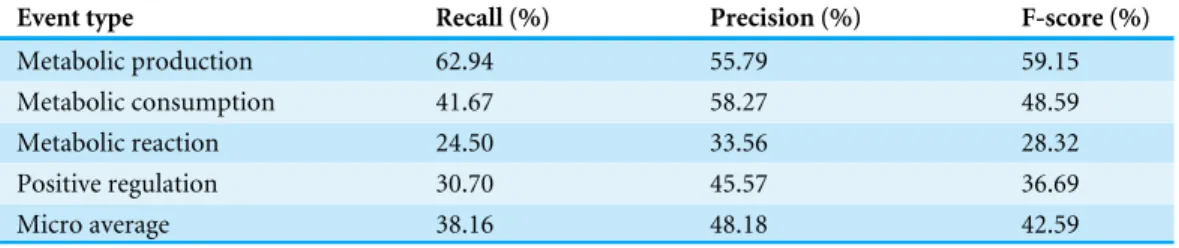
Table 5 Performance of MEE module on metabolic entities corpus using five-fold cross-validation.
Event type Recall (%) Precision (%) F-score (%)
Metabolic production 62.94 55.79 59.15
Metabolic consumption 41.67 58.27 48.59
Metabolic reaction 24.50 33.56 28.32
Positive regulation 30.70 45.57 36.69
Micro average 38.16 48.18 42.59
(1.22). In order to further express the word preference in the metabolic event, we inspected common words in the ME corpus. The top ten list of event words identified in the ME corpus is presented inFile S3. Interestingly, we found that a major portion of these common words (45.84% of total metabolic events) are involved in the generic description of biological processes (e.g., Catalyzes, Biosynthesis, Synthesis, Formation, Conversion, Utilization, Catalyzed, Catalyze, and Metabolism). These results showed that most of the event words in the metabolic event were centred around a small set of general keywords. However, it is possible to deduce the types of enzymatic reactions using name of substrate and product in some cases, e.g., the formation of glucosamine-1-phosphate (product name) from glucosamine-6-phosphate (substrate name) (Fig. 2B) suggests a phosphorylation reaction.
Performance of MEE module on ME corpus
Using five-fold cross-validation on the ME corpus, the recall, the precision, and the F-score were calculated for each metabolic event type as measures for the overall performance evaluation.Table 5shows these measures for each metabolic event type as well as for the total event type which indicates the sum of all metabolic event types. That is, the measures of total event type were calculated by summation of the individual true positives, false positives, and false negatives for each metabolic event type.
The F-scores of the events of metabolic production (59.15%) and metabolic consumption (48.59%) turned out to be higher than both of the events of metabolic reaction (28.32%) and positive regulation (36.69%). It is intuitive to think that complex events (i.e., two or more arguments) as found in metabolic reaction and positive regulation are harder to be classified than simple events (i.e., one argument) as found in metabolic production and metabolic consumption. In such a case, when the average number of arguments per metabolic event is high, a low F-score is clearly shown (seeTables 4and6) as in the example of the metabolic reaction and the positive regulation. These above-mentioned results are strongly supported by earlier works in Pathway Curation (PC) task—BioNLP-ST’13 and BioNLPST’11 (Ohta et al., 2013;Kim et al., 2011). In particular, the F-scores achieved from positive regulation event between PC task—BioNLP-ST’13 (Ohta et al., 2013) and our study were compared. Consequently, the F-scores were similar with values of 39.23 and 36.69, respectively.
Performance of MEE module on different ME corpus sizes
Table 6 Performance of MEE module on test corpus for tagging GP and metabolite.
GP entities Metabolite entities
Superpathway of leucine, valine, and isoleucine biosynthesis
Recall (%) 81.79 (274/335)a 85.51 (301/352)a
Precision (%) 92.88 (274/295)b 91.77 (301/328)b
F-score (%) 86.98 88.53
Superpathway of pyridoxal 5′-phosphate biosynthesis and salvage
Recall (%) 84.62 (297/351)a 65.16 (245/356)a
Precision (%) 83.90 (297/354)b 87.81 (245/279)b
F-score (%) 84.26 74.81
Notes.
aThe number in parenthesis indicates correctly predicted entities/number of total correct entities. bThe number in parenthesis indicates correctly predicted entities/number of total predicted entities.
Performance of MEE module on test corpus for tagging GP and metabolite used the trained model from five fold cross-validation (seeTable 5).
(Fig. 4). The corresponding recall, precision and F-score were compared in the form of learning curves inFig. 4using five-fold cross-validation. Expectedly, the performance of MEE module with the largest corpus size was better than that of the smaller corpus sizes in all possible cases. Clearly, the best recall and F-score were obtained with the whole corpus size of 271 abstracts and titles (Figs. 4Aand4C). In general, the trend was improved performance with a larger corpus size for these two measures. A similar trend was observed for the precision measure, except for the case of metabolic production which showed no dependence on corpus size (Fig. 4B). From the overall results, we suggest that a minimum of 150 abstracts and titles should be used for development of a ME corpus. Note that the regularity of the metabolic event description is applied for development of ME corpus for easier event extraction.
Performance of MEE module on test corpus
As a further assessment of the proposed integrated TM framework, a constructed test corpus was used for performance evaluation of the MEE module. Basic statistics of test corpus can be seen inTable 4. It contained 27 articles related to two Superpathways from the EcoCyc database (see ‘Methods’). At first, we evaluated MEE module on the test corpus using GP and metabolite entity tagging. As shown in Table 6, the precision, recall, and F-score of the entity tagger for GP and metabolite were very high for more than 80% of GP and metabolite entities identified for the Superpathway of leucine, valine, and isoleucine biosynthesis. However, the recall and F-score of the entity tagger for metabolite was lower than our expectations for the Superpathway of pyridoxal 5′-phosphate biosynthesis and salvage. The recall showed less than 70%, and the F-score showed less than 80%. These results seem to indicate that the entity tagger (i.e., BANNER) has a weakness in detecting metabolite entities in an abbreviated form (e.g., Pyridoxine (PN), Pyridoxal (PL), and 4-hydroxy-l-threonine phosphate (HTP)).
Performance of the MINR module on test corpus
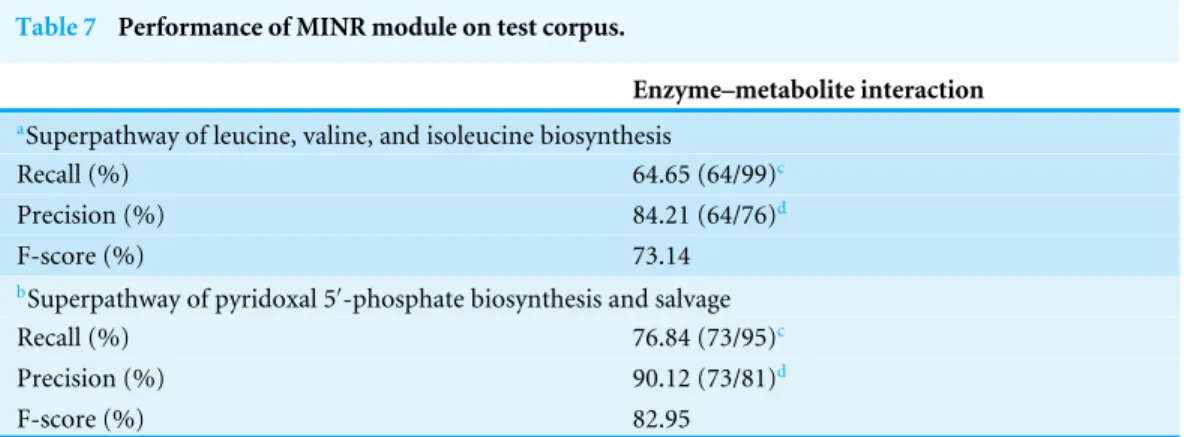
Table 7 Performance of MINR module on test corpus.
Enzyme–metabolite interaction
aSuperpathway of leucine, valine, and isoleucine biosynthesis
Recall (%) 64.65 (64/99)c
Precision (%) 84.21 (64/76)d
F-score (%) 73.14
bSuperpathway of pyridoxal 5′-phosphate biosynthesis and salvage
Recall (%) 76.84 (73/95)c
Precision (%) 90.12 (73/81)d
F-score (%) 82.95
Notes.
aUnder the superpathway of leucine, valine, and isoleucine biosynthesis, 88 identified enzyme–metabolite interactions were
found by manual curation and used as a reference for performance evaluation.
bUnder the superpathway of pyridoxal 5′-phosphate biosynthesis and salvage, 87 identified enzyme–metabolite interactions
were found by manual curation and used as a reference for performance evaluation.
cThe number in parenthesis indicates correctly predicted entities/number of total correct entities. dThe number in parenthesis indicates correctly predicted entities/number of total predicted entities.
Performance of MINR module on test corpus used the trained model from five fold cross-validation (seeTable 5).
as presented in Table 7. The reconstructed results from the MINR module were then compared with manually curated metabolic interactions list (see File S2). As shown in Table 7, for the two Superpathways, the precisions were 80–90%, the F-scores were 70–80%, and the recalls were 60–70%. These results suggest that the MINR module performed well for the mapping of enzyme–metabolite interactions and can be further used for reconstruction of metabolic interaction networks. Nonetheless, there were still missing interactions which could not be identified by the MINR module. These could be because MINR module was unable to capture the metabolic events that were implicit in the text as seen in the example of PMID-13405870 (seeFile S4). Moreover, it was also unable to extract exact precedence relationships among metabolic events as seen in the example of PMID-13727223 (seeFile S4). Further improvements are planned for MINR module after taking into account these limitations.
The integrated TM framework for reconstructed metabolic interaction network
As mentioned in the ‘Methods,’ two case studies were used to evaluate the integrated TM framework. For the first case study, as shown inFig. 5, our integrated TM framework on the test corpus successfully extracted 11 entities of enzymes and metabolites as well as 10 enzyme–metabolite interactions for reconstruction of the Superpathway of leucine, valine, and isoleucine biosynthesis.
To elaborate how a biologist can apply our integrated TM framework for reconstruction of the Superpathway of leucine, valine, and isoleucine biosynthesis, we show two example sentences extracted from PMID-1646790 that were obtained from MEE and MINR modules. The examples are described below.
Figure 5 Comparative analysis of two TM systems on test corpus for the Superpathway reconstruc-tion of leucine, valine, and isoleucine biosynthesis.(A) Our integrated TM framework (MEE and MINR
modules), (B) TM system developed byCzarnecki et al. (2012). The extracted interactions were overlaid to
the reference metabolic pathway from the EcoCyc database. A grey node means correct extraction. A white node means incorrect extraction. An edge with an arrow means correct extraction. An edge with a dash ar-row means incorrect extraction. This bipartite metabolic graph is created using Cytoscape version 3.0.1.
∗The extracted enzyme–metabolite interaction indicates the number of binary interaction; #The number
in parenthesis is a percentage of extracted mentions/events in comparison to the reference metabolic path-way from the EcoCyc database.
Example 2: ‘‘2-KIC amination by the tyrB-encoded transaminase and also by the aspC-and avtA-encoded transaminases.’’
For explanation of example 1, the MEE module identifies enzyme (tyrosine-repressible transaminase) and metabolite (leucine) throughout metabolic production event. Considering example 2, the MEE module identifies enzyme (tyrB-encoded transaminase) and metabolite (2-KIC) throughout metabolic consumption event. To the end, the MINR module obtains enzyme–metabolite interactions by combining the metabolic production and consumption events from examples 1 and 2, respectively. As a result, 2-KIC can be converted to leucine by tyrB-encoded transaminase (tyrosine-repressible transaminase). Full details of enzymes, metabolites, and enzyme–metabolite interactions can be seen in File S5.
Table 8 The reconstructed metabolic interaction network using ME corpus and EcoCyc extraction applications.
Entities EcoCyc extraction (2,373 abstracts and titles) ME corpus (271 abstracts and titles) # Correctly
predicted
# Total predicted
Precision (%) # Correctly predicted
# Total predicted
Precision (%)
Enzyme 193 293 69.93 58 74 78.38
Metabolite 190 260 70.63 80 113 70.80
Enzyme–metabolite interaction 234 501 46.71 76 137 55.47
Notes.
ME corpus and EcoCyc extraction was done using the same training dataset (i.e., ME corpus for 271 abstracts and titles). To reconstruct the metabolic interaction network,
E. coliK-12 MG1665 (iJO1366) genome-scale metabolic network (Orth et al., 2011) was used as an interaction reference.
metabolites and enzyme–metabolite interactions were obtained (Fig. 5). As can be seen, the results achieved from both systems are able to extract a different part of network suggesting that the combination of the results and biological intepretation would be an interesting option for a biologist who searches for an alternative way for reconstructing a network.
For the second case study involving large-scale data extraction from EcoCyc, the results are shown inTable 8. We found the precisions for this EcoCyc extraction data in terms of enzymes (69.93%), metabolites (70.63%), and enzyme–metabolite interactions (46.71%). After comparing these precisions to the similar results gained from constructed ME corpus (271 abstracts and titles), we found that the EcoCyc extraction data showed a higher number of false positives. Based on our manual inspection, one source of false positives came from mentions of enzymes, metabolites, or enzyme–metabolite interactions in other species that were not fromE. colidespite the fact that our framework was trained usingE. coliabstracts and titles. However, this is favorable for the real-world usage since it shows the generality of our method can capture all generic mentioned reactions in text. Another note is that we did not deploy a normalization method in our evaluation, and this might not correctly reflect the performance of the real-world large-scale extraction where the normalization method is critical. Nevertheless, these results illustrate that our constructed ME corpus within the integrated TM framework is solid and can be used as a representative dataset for large-scale data extraction with applications for building metabolic interaction databases and networks as well as for knowledge discovery tasks. The proposed integrated TM framework application is summarized inFig. 6.
CONCLUSIONS
This study reports the first open-source integrated TM framework for reconstructing a metabolic interaction network. Here, we constructed a ME corpus, a MEE module and a MINR module within an integrated TM framework. Expectedly, the ME corpus has been successfully used for simplified detection of GP, metabolites entities throughout metabolic events. In addition, we have shown that our proposed framework successfully extracted a metabolic interaction, and it can be used as a scaffold for futher reconstruction of a large-scale metabolic interaction network.
Input text Metabolic event information
Metabolic interaction database and network
Knowledge discovery Large scale extraction
Metabolic event extraction Parsing
Preproce ssing
Integrated TM framework
T1 Protein 0 22 agmatine ureohydrolase T2 Protein 24 27 AUH T3 Protein 30 41 EC 3.5.3.11 * Equiv T3 T2 T1 T4 Positive_regulation 43 52 catalyzes E1 Positive_regulation:T4 Cause:T1 Theme:E2 T5 Metabolic_reaction 57 67 conversion E2 Metabolic_reaction:T5 Theme:T6 Product:T7 T6 Metabolite 71 79 agmatine T7 Metabolite 83 93 putrescine (A)
(B)
Figure 6 The integrated TM framework application.
ME corpus, F-scores of 59.15% and 48.59% were obtained for metabolic production and consumption, respectively. This indicates practical performance of the MEE module in the detection of metabolic entities. In the comparative study of corpus sizes, the MEE module showed a high F-score and a high recall when the size increased. The correlation of its overall performance implied the extensibility of the integrated TM framework which could be achieved by increasing the size of the corpus.
of corpus. Due to the limitation of the current tool (e.g., BANNER) used in this study, the NLP-based approach should be further investigated and implemented for increasing the overall performance of the integrated TM framework. An API for implementation of user-defined algorithms will also be provided, including a user interface and a web-service for event annotation.
Abbreviations
TM Text Mining
PN Pyridoxine
PL Pyridoxal
HTP 4-hydroxy-l-threoninephosphate
TEES Turku Event Extraction System
GP Gene and Protein
SD Standard deviation
GREC Gene Regulation Event Corpus
BioNLP-ST BioNLP Shared Task
NLP Natural Language Processing
ME Metabolic Entities
MEE module Metabolic Event Extraction module
MINR module Metabolic Interaction Network Reconstruction module
ACKNOWLEDGEMENTS
We would like to thank Mr. Yutthanattee Tohreh for assisting in the manual annotation process and Mr. Sean Kortschot for proofreading the draft version of the manuscript. We also would like to thank Mr. David H. Cook for proofreading the revised version of manuscript.
ADDITIONAL INFORMATION AND DECLARATIONS
Funding
Financial support was provided by Soochow University (grant no. Q410700111), the National Natural Science Foundation of China (NSFC) (grant no. 31200989), King Mongkut’s University of Technology Thonburi (KMUTT), Preproposal Research Fund (grant no. PRF 4/2558), Faculty of Science, Kasetsart University, and the Thailand Research Fund (grant no. TRG5880245). The funders had no role in study design, data collection and analysis, decision to publish, or preparation of the manuscript.
Grant Disclosures
The following grant information was disclosed by the authors: Soochow University: Q410700111.
National Natural Science Foundation of China (NSFC): 31200989. King Mongkut’s University of Technology Thonburi (KMUTT). Preproposal Research Fund: PRF 4/2558.
Competing Interests
The authors declare there are no competing interests.
Author Contributions
• Preecha Patumcharoenpol performed the experiments, analyzed the data, wrote the
paper, prepared figures and/or tables, reviewed drafts of the paper.
• Narumol Doungpan and Asawin Meechai analyzed the data, reviewed drafts of the
paper.
• Bairong Shen contributed reagents/materials/analysis tools, reviewed drafts of the paper. • Jonathan H. Chan conceived and designed the experiments, reviewed drafts of the paper. • Wanwipa Vongsangnak conceived and designed the experiments, contributed
reagents/materials/analysis tools, wrote the paper, reviewed drafts of the paper.
Data Availability
The following information was supplied regarding data availability:
Supplement: an integrated text mining framework for metabolic interaction network reconstruction:www.sbi.kmutt.ac.th/~preecha/metrecon.
Supplemental Information
Supplemental information for this article can be found online athttp://dx.doi.org/10.7717/ peerj.1811#supplemental-information.
REFERENCES
Airola A, Pyysalo S, Björne J, Pahikkala T, Ginter F, Salakoski T. 2008.All-paths graph
kernel for protein–protein interaction extraction with evaluation of cross-corpus learning.BMC Bioinformatics9(Suppl 11):S2DOI 10.1186/1471-2105-9-S11-S2.
Andersen MR, Nielsen ML, Nielsen J. 2008.Metabolic model integration of the
bib-liome, genome, metabolome and reactome ofAspergillus niger.Molecular Systems Biology4:178DOI 10.1038/msb.2008.12.
Baumgartner WA, Cohen KB, Fox LM, Acquaah-Mensah G, Hunter L. 2007.Manual
curation is not sufficient for annotation of genomic databases.Bioinformatics
23:i41–i48DOI 10.1093/bioinformatics/btm229.
Bell L, Chowdhary R, Liu JS, Niu X, Zhang J. 2011.Integrated bio-entity
net-work: a system for biological knowledge discovery.PLoS ONE6:e21474 DOI 10.1371/journal.pone.0021474.
Björne J, Salakoski T. 2011.Generalizing biomedical event extraction. In:Proceedings of
the BioNLP 2011 workshop. Stroudsburg: Association for Computational Linguistics, 183–191.
Björne J, Van Landeghem S, Pyysalo S. 2012.PubMed-scale event extraction for
Bordbar A, Palsson BØ. 2012.Using the reconstructed genome-scale human
metabolic network to study physiology and pathology.Journal of Internal Medicine
271:131–141DOI 10.1111/j.1365-2796.2011.02494.x.
Bossy R, Bessières P, Nédellec C. 2013.BioNLP shared task 2013—an overview of the
genic regulation network task. In:Proceedings of BioNLP shared task 2013 workshop. Stroudsburg: Association for Computational Linguistics.
Cohen J. 1960.A coefficient of agreement for nominal scales.Educational and
Psychologi-cal Measurement 20:37–46DOI 10.1177/001316446002000104.
Czarnecki J, Nobeli I, Smith AM, Shepherd AJ. 2012.A text-mining system for
ex-tracting metabolic reactions from full-text articles.BMC Bioinformatics13:172 DOI 10.1186/1471-2105-13-172.
Feist AM, Herrgård MJ, Thiele I, Reed JL, Palsson BØ. 2009.Reconstruction of
biochemical networks in microorganisms.Nature Reviews Microbiology7:129–143 DOI 10.1038/nrmicro1949.
Gerner M, Sarafraz F, Bergman CM, Nenadic G. 2012.BioContext: an integrated text
mining system for large-scale extraction and contextualization of biomolecular events.Bioinformatics28:2154–2161DOI 10.1093/bioinformatics/bts332.
Heavner BD, Smallbone K, Barker B, Mendes P, Walker LP. 2012.Yeast 5—an
expanded reconstruction of theSaccharomyces cerevisiaemetabolic network.BMC Systems Biology6:55DOI 10.1186/1752-0509-6-55.
Hirschman L, Burns GAPC, Krallinger M, Arighi C, Cohen KB, Valencia A, Wu CH, Chatr-Aryamontri A, Dowell KG, Huala E, Lourenco A, Nash R, Veuthey A-L,
Wiegers T, Winter AG. 2012.Text mining for the biocuration workflow.Database
2012:bas020DOI 10.1093/database/bas020.
Humphreys K, Demetriou G, Gaizauskas R. 2000.Two applications of information
extraction to biological science journal articles: enzyme interactions and protein structures.Pacific Symposium on Biocomputing 513:505–516.
Kabiljo R, Clegg AB, Shepherd AJ. 2009.A realistic assessment of methods for
ex-tracting gene/protein interactions from free text.BMC Bioinformatics10:233 DOI 10.1186/1471-2105-10-233.
Kemper B, Matsuzaki T, Matsuoka Y, Tsuruoka Y, Kitano H, Ananiadou S, Tsujii
J. 2010.PathText: a text mining integrator for biological pathway visualizations.
Bioinformatics26:i374–i381DOI 10.1093/bioinformatics/btq221.
Keseler IM, Mackie A, Peralta-Gil M, Santos-Zavaleta A, Gama-Castro S, Bonavides-Martínez C, Fulcher C, Huerta AM, Kothari A, Krummenacker M, Latendresse M, Muñiz-Rascado L, Ong Q, Paley S, Schröder I, Shearer AG, Subhraveti P, Travers M, Weerasinghe D, Weiss V, Collado-Vides J, Gunsalus RP, Paulsen I, Karp PD.
2013.EcoCyc: fusing model organism databases with systems biology.Nucleic Acids
Research41:D605–D612DOI 10.1093/nar/gks1027.
Kim J-D, Ohta T, Pyysalo S, Kano Y, Tsujii J. 2009. Overview of BioNLP’09 shared task
Kim J-D, Pyysalo S, Ohta T, Bossy R, Nguyen N, Tsujii J. 2011a.Overview of BioNLP shared task 2011. In:Proceedings of BioNLP shared task 2011 workshop. Stroudsburg: Association for Computational Linguistics, 1–6.
Kim JD, Wang Y, Takagi T, Yonezawa A. 2011b.Overview of Genia event task in
BioNLP shared task 2011. In:Proceedings of BioNLP shared task 2011 workshop, 7–15.
Kim J-D, Wang Y, Yasunori Y. 2013.The Genia event extraction shared task, 2013
edition—overview. In:Proceedings of BioNLP shared task 2013 workshop. Strouds-burg: Association for Computational Linguistics.
Leaman R, Gonzalez G. 2008.BANNER: an executable survey of advances in biomedical
named entity recognition. In:Pacific symposium on biocomputing Pacific symposium on biocomputing, 652–663.
Liu J, Gao Q, Xu N, Liu L. 2013.Genome-scale reconstruction and in silico
anal-ysis ofAspergillus terreusmetabolism.Molecular BioSystems9:1939–1948 DOI 10.1039/c3mb70090a.
Marneffe M, Maccartney B, Manning C. 2006.Generating typed dependency parses
from phrase structure parses. In:Proceedings of LREC-06, 449–454.
McClosky D, Charniak E, Johnson M. 2006.Effective self-training for parsing. In:
Proceedings of the main conference on human language technology conference of the North American Chapter of the association of computational linguistics, 152–159.
McClosky D, Riedel S, Surdeanu M, McCallum A, Manning CD. 2012.Combining
joint models for biomedical event extraction.BMC Bioinformatics13(Suppl 11):S9 DOI 10.1186/1471-2105-13-S11-S9.
Neves M, Damaschun A, Mah N, Lekschas F, Seltmann S, Stachelscheid H, Fontaine
J-F, Kurtz A, Leser U. 2013.Preliminary evaluation of the CellFinder literature
curation pipeline for gene expression in kidney cells and anatomical parts.Database
2013:bat020DOI 10.1093/database/bat020.
Nobata C, Dobson PD, Iqbal SA, Mendes P, Tsujii J, Kell DB, Ananiadou S. 2011.
Min-ing metabolites: extractMin-ing the yeast metabolome from the literature.Metabolomics
7:94–101 DOI 10.1007/s11306-010-0251-6.
Ohta T, Pyysalo S, Rak R, Rowley A, Chun H-W, Jung S-J, Choi S-P, Ananiadou S.
2013.Overview of the pathway curation (PC) task of BioNLP shared task 2013.
In:Proceedings of BioNLP shared task 2013 workshop. Stroudsburg: Association for Computational Linguistics.
Orth JD, Conrad TM, Na J, Lerman JA, Nam H, Feist AM, Palsson BØ. 2011.A
com-prehensive genome-scale reconstruction ofEscherichia colimetabolism.Molecular Systems Biology7:535DOI 10.1038/msb.2011.65.
Ozgür A, Vu T, Erkan G, Radev DR. 2008.Identifying gene–disease associations
using centrality on a literature mined gene-interaction network.Bioinformatics
24:i277–i285DOI 10.1093/bioinformatics/btn182.
Patumcharoenpol P, Chan J, Meechai A, Shen B, Vongsangnak W. 2012.Bibliome
Poolman MG, Miguet L, Sweetlove LJ, Fell DA. 2009.A genome-scale metabolic model ofArabidopsisand some of its properties.Plant Physiology151:1570–1581 DOI 10.1104/pp.109.141267.
Rodríguez-Penagos C, Salgado H, Martínez-Flores I, Collado-Vides J. 2007.Automatic
reconstruction of a bacterial regulatory network using natural language processing. BMC Bioinformatics8:293DOI 10.1186/1471-2105-8-293.
Rzhetsky A, Iossifov I, Koike T, Krauthammer M, Kra P, Morris M, Yu H, Duboué
PA, Weng W, Wilbur WJ, Hatzivassiloglou V, Friedman C. 2004.GeneWays: a
system for extracting, analyzing, visualizing, and integrating molecular pathway data. Journal of Biomedical Informatics37:43–53DOI 10.1016/j.jbi.2003.10.001.
Saetre R, Yoshida K, Miwa M, Matsuzaki T, Kano Y, Tsujii J. 2010.Extracting
pro-tein interactions from text with the unified AkaneRE event extraction system. IEEE/ACM Transactions on Computational Biology and Bioinformatics7:442–453 DOI 10.1109/TCBB.2010.46.
Sætre R, Yoshida K, Yakushiji A. 2007.AKANE system: protein–protein interaction
pairs in BioCreAtIvE2 challenge, PPI-IPS subtask. In:Proceedings of the second biocreative challenge workshop, 209–212.
Shepherd A, Kabiljo R. 2008.Protein name tagging in the immunological domain. In:
Proceedings of the third symposium on semantic mining in biomedicine, 141–144.
Song Y-L, Chen S-S. 2009.Text mining biomedical literature for constructing gene
reg-ulatory networks.Interdisciplinary Sciences: Computational Life Sciences1:179–186 DOI 10.1007/s12539-009-0028-7.
Srihari S, Leong HW. 2013.A survey of computational methods for protein complex
prediction from protein interaction networks.Journal of Bioinformatics and Com-putational Biology 11(2):1230002DOI 10.1142/S021972001230002X.
Stenetorp P, Pyysalo S, Topi G, Ohta T, Ananiadou S, Tsujii J. 2012.BRAT: a
web-based tool for NLP-assisted text annotation. In:Proceedings of the Demonstrations at the 13th Conference of the European Chapter of the Association for Computational Linguistics, 102–107.
Van Landeghem S, Björne J, Wei C-H, Hakala K, Pyysalo S, Ananiadou S, Kao
H-Y, Lu Z, Salakoski T, Van de Peer H-Y, Ginter F. 2013.Large-scale event
extrac-tion from literature with multi-level gene normalizaextrac-tion.PLoS ONE8:e55814 DOI 10.1371/journal.pone.0055814.
Van Landeghem S, Ginter F. 2011.EVEX: a PubMed-scale resource for homology-based
generalization of text mining predictions. In:Proceedings of BioNLP 2011 workshop. Stroudsburg: Association for Computational Linguistics.
Van Rijsbergen C. 1979.Information retrieval. 2nd edition. London: Butterworth.
Zhang L, Berleant D, Ding J, Cao T, Syrkin Wurtele E. 2009.PathBinder–text empirics
and automatic extraction of biomolecular interactions.BMC Bioinformatics