Obesity and Cardio-Metabolic Risk Factors in
an Urban and Rural Population in the Ashanti
Region-Ghana: A Comparative
Cross-Sectional Study
Christian Obirikorang1, Derick Nii Mensah Osakunor1*, Enoch Odame Anto1, Samuel Opoku Amponsah2, Opei Kwafo Adarkwa3
1Department of Molecular Medicine, School of Medical Sciences, College of Health Sciences, Kwame Nkrumah University of Science and Technology, Kumasi, Ghana,2Department of Medical Laboratory Technology, Faculty of Allied Health Sciences, College of Health Sciences, Kwame Nkrumah University of Science and Technology, Kumasi, Ghana,3Department of Obstetrics and Gynaecology, Komfo Anokye Teaching Hospital, Kumasi, Ghana
*osakunor@gmail.com
Abstract
There is a surge in chronic diseases in the developing world, driven by a high prevalence of cardio-metabolic risk factors. This study described differences in prevalence of obesity and cardio-metabolic risk factors between urban and rural settlements in the Ashanti Region of Ghana. This comparative cross-sectional study included 672 participants (median age 50 years), of which 312 were from Kumasi (urban) and 360 from Jachie-Pramso (rural). Demo-graphic, anthropometric and other cardio-metabolic risk factors were gathered and venous blood samples were drawn for biochemical assays. Results suggested significant differ-ences in diastolic blood pressure (80.0 mmHg vs 79.5 mmHg; p = 0.0078), and fasting blood sugar (5.0 mmo/l vs 4.5 mmol/l; p<0.0001) between the two groups. Further differ-ences in anthropometric measures suggested greater adiposity amongst participants in the urban area. Participants in the urban area were more likely than rural participants, to have high total cholesterol and LDL-c (p<0.0001 respectively). Risk factors including BMI25 (p<0.0001), BMI30 (p<0.0001), high waist circumference (p<0.0001), high waist-to-height ratio (p<0.0001) and alcohol consumption (p = 0.0186) were more prevalent amongst participants in the urban area. Markers of adiposity were higher amongst females than males in both areas (p<0.05). In the urban area, hypertension, diabetes and lifestyle risk factors were more prevalent amongst males than females. Differences in risk factors by urban / rural residence remained significant after adjusting for gender and age. Obesity and cardio-metabolic risk factors are more prevalent amongst urban settlers, highlighting an ur-gent need to avert the rise of diet and lifestyle-related chronic diseases.
a11111
OPEN ACCESS
Citation:Obirikorang C, Osakunor DNM, Anto EO, Amponsah SO, Adarkwa OK (2015) Obesity and Cardio-Metabolic Risk Factors in an Urban and Rural Population in the Ashanti Region-Ghana: A Comparative Cross-Sectional Study. PLoS ONE 10(6): e0129494. doi:10.1371/journal.pone.0129494
Academic Editor:Barbara Fuhrman, University of Arkansas for Medical Sciences, UNITED STATES
Received:August 31, 2014
Accepted:May 8, 2015
Published:June 5, 2015
Copyright:© 2015 Obirikorang et al. This is an open access article distributed under the terms of the Creative Commons Attribution License, which permits unrestricted use, distribution, and reproduction in any medium, provided the original author and source are credited.
Data Availability Statement:All relevant data are within the paper.
Funding:The authors have no support or funding to report.
Introduction
The increase in non-communicable and chronic diseases in the developing world is an issue of major concern and can lead to reduced quality of life and premature deaths [1]. The prevalence of diabetes amongst adults in Africa as at 2010 was 3.8% and this is estimated to increase to 4.6% by the year 2030 [2]. Furthermore, the 1.2 million death toll attributed to cardiovascular diseases in Africa is expected to double by the year 2030 [3].
Prevalence of cardiovascular disease and diabetes is largely driven by cardio-metabolic risk factors such as smoking, lack of physical activity, low fruit and vegetable intake, high fat and salt intake, hypertension, abdominal obesity, dyslipidaemia, and excess alcohol intake [4]. The upward trend of cardio-metabolic diseases in Africa is likely to be due to an increase in these identifiable risk factors amongst the populace.
Overweight and obesity (abnormal or excessive fat accumulation that presents a risk to health) are strong risk factors for cardio-metabolic and other chronic medical conditions [5– 7], including hypertension [8] and dyslipidaemia [9,10]. The Body Mass Index (BMI), is the crude method of measure of overweight and obesity [11] but there are other popular but simple measures of obesity employed in recent times, which include the waist-to hip ratio (WHR), waist-to-height ratio (WHtR) and the percentage body fat (BF%) [5,12], whose validity has been supported [13,14].
Estimates from the World Health Organization (WHO) in 2008 showed that more than 1.4 billion adults, 20 years and older, were overweight with an overall 10% of the world’s popula-tion being obese [11]. There are reports on the prevalence of obesity across countries in and outside Africa [15,16] and in Ghana [17–19], suggesting that obesity is increasing in preva-lence [20]. It is reported that the prevalence of overweight and obesity in developing countries like Ghana is more rapid than in the developed world [21] and that by 2025 three-quarters of the obese population worldwide will be in non-industrialized countries [22].
The prevalence of overweight and obesity has risen steadily in Ghana over the years [17] and is reportedly more common in the capital city, Accra where urbanization is highest [18,
23]. Ghana has 10 administrative regions and data on other regions is limited. The Ashanti Re-gion is the third largest with rapid urbanization, hence calls for urgent attention.
In Ghana, there is little available data on the prevalence of cardio-metabolic risk factors and its variations across compared populations. The current study therefore sought to describe the differences in prevalence of obesity and cardio-metabolic risk factors in Ghanaian adults drawn from urban and rural settlements.
Materials and Methods
Study Design and Site
This comparative cross-sectional study was conducted in two locations, Kumasi and Jachie-Pramso, both located in the Ashanti Region of Ghana, from January to July 2013.
Kumasi was classified as urban and Jachie-Pramso was classified as rural, based on popula-tion, settlement, location and way of life of the people. Kumasi is amongst the largest metropol-itan areas of Ghana and the second most populous [24]. It is the commercial, industrial and cultural capital of the Ashanti Region. Jachie-Pramso is a village with a clustered human settle-ment, located in the Bosomtwe district [24] of the Ashanti region.
Study Population
were selected at random and 16 households selected at random from each neighbourhood. We selected at least one (1) eligible participant from each household. Due to the relatively smaller size of Jachie-Pramso, we visited about 80 households at random and eligible participants in each household were recruited. The sample size from each community was deemed representa-tive of the apparently healthy population in both communities.
An interview-based questionnaire was designed in the English language but translated into the local dialects (mainly Twi), where appropriate. The questionnaire gathered information on socio-demographic and cardio-metabolic risk factors. Sample questionnaires were pre-tested before commencement of the study.
Participants with prior history of hypertension, diabetes or coronary heart disease were ex-cluded. Documented evidence of treatment related to such conditions in previously diagnosed persons, also constituted exclusion from the study. We excluded pregnant and lactating women as well as physically and mentally disabled individuals.
Biochemical Assays
After observing an overnight fast (12–14 hours), about 6 ml venous blood sample was taken from each participant into fluoride oxalate and serum separator tubes (about 3 ml each). Blood samples were centrifuged within 2 hours at 500 g for 15 min.
Plasma glucose levels were determined using the glucose oxidase method. Serum lipid levels; total cholesterol (TC), triglycerides (TG) and HDL-cholesterol (HDL-c) were determined by enzymatic methods on the Selectra Pro“S”System (Elitech Clinical Systems Elitech Group). LDL-cholesterol (LDL-c) was calculated using the Friedwald’s formula [25].
Dyslipidemia was defined as TC5.20 mmol/l, HDL-c<1.04 mmol/l, LDL-c3.38 mmol/l TG1.71 mmol/l and TC/HDL-c ratio5 as per the United States National Choles-terol Education Program, Adult Treatment Panel (NCEP-ATP) III guidelines [26]. Diabetes was defined as fasting blood sugar (FBS) of7.0 mmol/l [27].
Anthropometric measurements
Body weight (to the nearest 0.1 Kg) in light clothing was measured with a mechanical scale (Hospibrand ZT-120, England). Height (to the nearest 0.1 cm) without shoes was measured with a commercial stadiometer (SECA, Germany).
The body mass index (BMI) was calculated using the formula; weight (Kg) / height (m2). Waist circumference (WC) (to the nearest 0.1 cm) was measured using a measuring tape (Gay Mills, WI), midpoint between the last palpable rib and the suprailiac crest, with the subjects standing and breathing normally [28]. The hip circumference (HC) was measured at the outer-most points of the greater trochanters [29]. The waist and hip circumferences were measured with the tape parallel to the floor. The waist-to-hip ratio (WHR) was calculated using the for-mula; WC (cm) / HC (cm). The waist-to-height ratio (WHtR) was calculated using the formu-la; WC (cm) / height (cm).
Blood pressure
Trained personnel measured the blood pressure of participants in accordance with recommen-dations of the American Heart Association [34]. The measurements were repeated after a mini-mum of 20 minutes [28] and mean values of duplicate measurements were recorded as the blood pressure. Hypertension was defined as a systolic blood pressure of140 mmHg and/or diastolic blood pressure was90 mmHg on two occasions, after initial screening (also with newly detected cases) [28,35].
Occupation
Occupational data gathered included a vast majority of jobs and these were classified as formal and informal based on set criteria.“Formal”jobs were defined as that which encompasses all jobs with normal hours, regular wages and are recognized as income sources on which income taxes must be paid. Any such contrary to this was classified as“informal”.
Type of family
Participants who lived alone in their homes were categorized as“individual”, whiles those who lived with their immediate nuclear family (mother, father and children) were categorized as
“nuclear”and those who lived with other family dependents (uncles, grandparents and in-laws) were categorized as living with“extended”families.
Statistical methods
Data was analysed using MedCalc, version 12.7 and GraphPad Prism version 5.0. Continuous variables were expressed as medians and interquartile ranges (IQR). Categorical variables were expressed as frequencies and proportions. As continuous variables were not normally distribut-ed, a non-parametric tests, the Mann-Whitney test (Rank sum test) was used to compare medi-ans. The Chi-square or Fisher’s test was used to compare categorical variables as appropriate. Multivariate logistic regression was used to calculate the odds ratio describing the association of cardio-metabolic risk factors with urban residence, adjusted for age and gender. Spearman’s rho (Rank) correlation was used to determine the associations between various variables within each population group. Findings were considered statistically significant when p<0.05.
Ethical consideration
The study was approved by the Committee on Human Research, Publication and Ethics of the School of Medical Sciences (SMS), Kwame Nkrumah University of Science and Technology (KNUST);Ref-CHRPE/RC/093/13. Participation was voluntary and written informed consent
was obtained from each participant.
Results
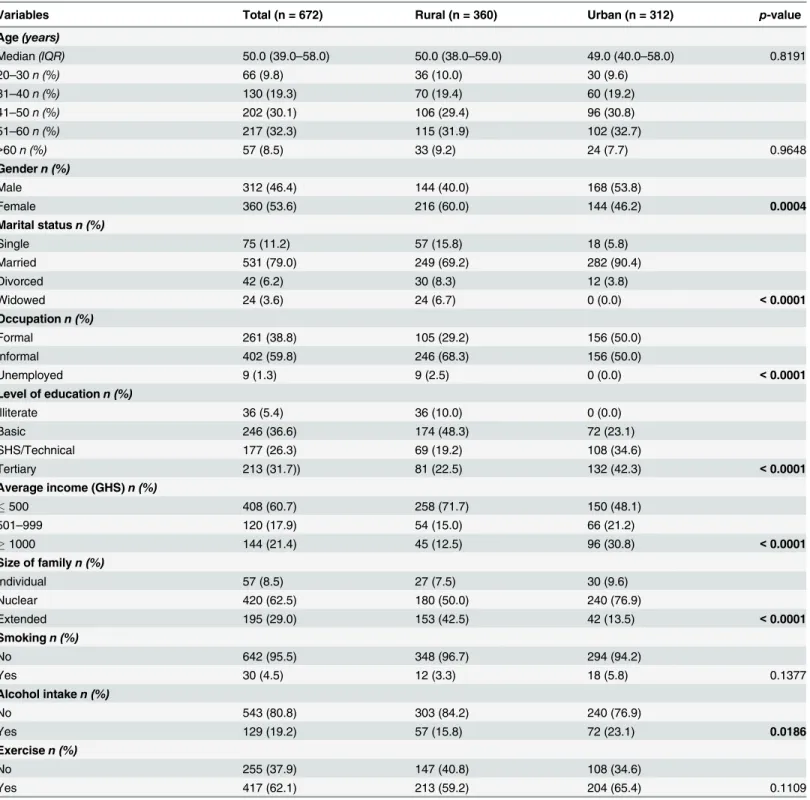
Table 1shows the socio-demographic characteristics of the study population. Median age was
50 years and there was no significant difference in age distributions between participants in the urban and rural areas. The majority (62.5%) of families lived in the nuclear family system with a majority average income of GHS500 (60.7%). There were significant differences between urban and rural participants with respect to gender distribution (p = 0.0004), marital status (p<0.0001), employment (p<0.0001), education (p<0.0001), average income (p<0.0001), type of family (p<0.0001), and alcohol intake (p = 0.0186).
Table 1. Socio-demographic characteristics of the study population.
Variables Total (n = 672) Rural (n = 360) Urban (n = 312) p-value
Age(years)
Median(IQR) 50.0 (39.0–58.0) 50.0 (38.0–59.0) 49.0 (40.0–58.0) 0.8191
20–30n (%) 66 (9.8) 36 (10.0) 30 (9.6)
31–40n (%) 130 (19.3) 70 (19.4) 60 (19.2)
41–50n (%) 202 (30.1) 106 (29.4) 96 (30.8)
51–60n (%) 217 (32.3) 115 (31.9) 102 (32.7)
>60n (%) 57 (8.5) 33 (9.2) 24 (7.7) 0.9648
Gendern (%)
Male 312 (46.4) 144 (40.0) 168 (53.8)
Female 360 (53.6) 216 (60.0) 144 (46.2) 0.0004
Marital statusn (%)
Single 75 (11.2) 57 (15.8) 18 (5.8)
Married 531 (79.0) 249 (69.2) 282 (90.4)
Divorced 42 (6.2) 30 (8.3) 12 (3.8)
Widowed 24 (3.6) 24 (6.7) 0 (0.0) <0.0001
Occupationn (%)
Formal 261 (38.8) 105 (29.2) 156 (50.0)
Informal 402 (59.8) 246 (68.3) 156 (50.0)
Unemployed 9 (1.3) 9 (2.5) 0 (0.0) <0.0001
Level of educationn (%)
Illiterate 36 (5.4) 36 (10.0) 0 (0.0)
Basic 246 (36.6) 174 (48.3) 72 (23.1)
SHS/Technical 177 (26.3) 69 (19.2) 108 (34.6)
Tertiary 213 (31.7)) 81 (22.5) 132 (42.3) <0.0001
Average income (GHS)n (%)
500 408 (60.7) 258 (71.7) 150 (48.1)
501–999 120 (17.9) 54 (15.0) 66 (21.2)
1000 144 (21.4) 45 (12.5) 96 (30.8) <0.0001
Size of familyn (%)
Individual 57 (8.5) 27 (7.5) 30 (9.6)
Nuclear 420 (62.5) 180 (50.0) 240 (76.9)
Extended 195 (29.0) 153 (42.5) 42 (13.5) <0.0001
Smokingn (%)
No 642 (95.5) 348 (96.7) 294 (94.2)
Yes 30 (4.5) 12 (3.3) 18 (5.8) 0.1377
Alcohol intaken (%)
No 543 (80.8) 303 (84.2) 240 (76.9)
Yes 129 (19.2) 57 (15.8) 72 (23.1) 0.0186
Exercisen (%)
No 255 (37.9) 147 (40.8) 108 (34.6)
Yes 417 (62.1) 213 (59.2) 204 (65.4) 0.1109
Data is presented as median (IQR); Mann-Whitney test or n (%); Chi-square or Fisher’s test. p<0.05 was considered significant for rural vs urban. n:
number, IQR: Interquartile range. GHS: Ghana Cedi.
Participants in the urban area had significantly higher levels of serum cholesterol and LDL-c than that observed amongst partiLDL-cipants in the rural area (p<0.0001 respectively). This was however not true for serum triglyceride levels, as that of the urban participants was lower than that observed in rural participants (p<0.0001). [Table 3]
InTable 4, we compare selected cardio-metabolic risk factors by settlement (rural or
urban). Participants in the urban area were more likely than rural residents, to have a high total cholesterol and LDL-c (p<0.0001 respectively). There were more participants in the urban area with BMI25 (p<0.0001) and BMI30 (p<0.0001), high WC (p<0.0001), high WHtR (p<0.0001) and who consumed alcohol (p = 0.0186) than there was in the rural area, suggesting differences in adiposity between the two areas.
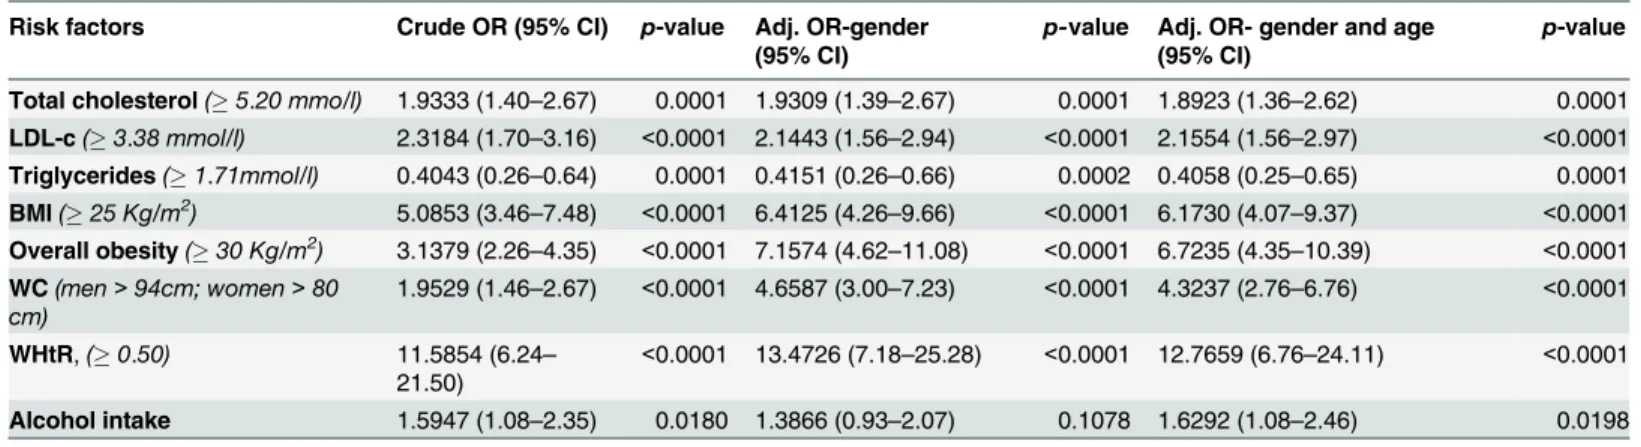
After adjusting for gender and age, differences in cardio-metabolic risk factors between par-ticipants in the two areas remained significant, with parpar-ticipants in the urban area more likely to have cardio-metabolic risk factors. [Table 5]
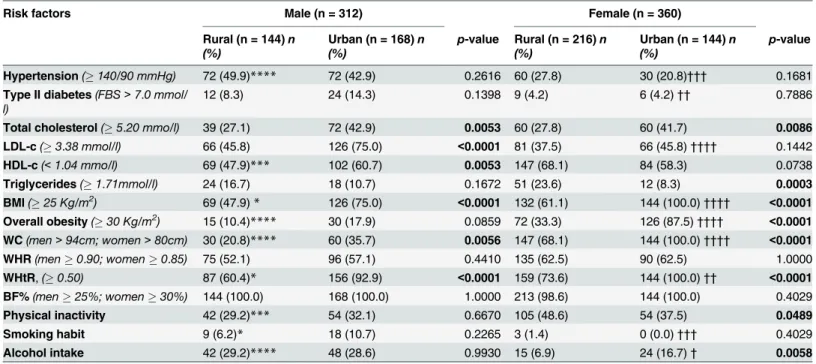
The selected cardio-metabolic risk factors are further stratified by gender inTable 6, Male participants in the urban area were significantly more likely to have cardio-metabolic risk fac-tors (total cholesterol, LDL-c, HDL-c, BMI25, WC, WHtR) than male participants in the rural area. Similarly, there were significantly more female participants in the urban area with high cholesterol, BMI25, BMI30, high waist circumference and high WHtR than there was in the rural area.
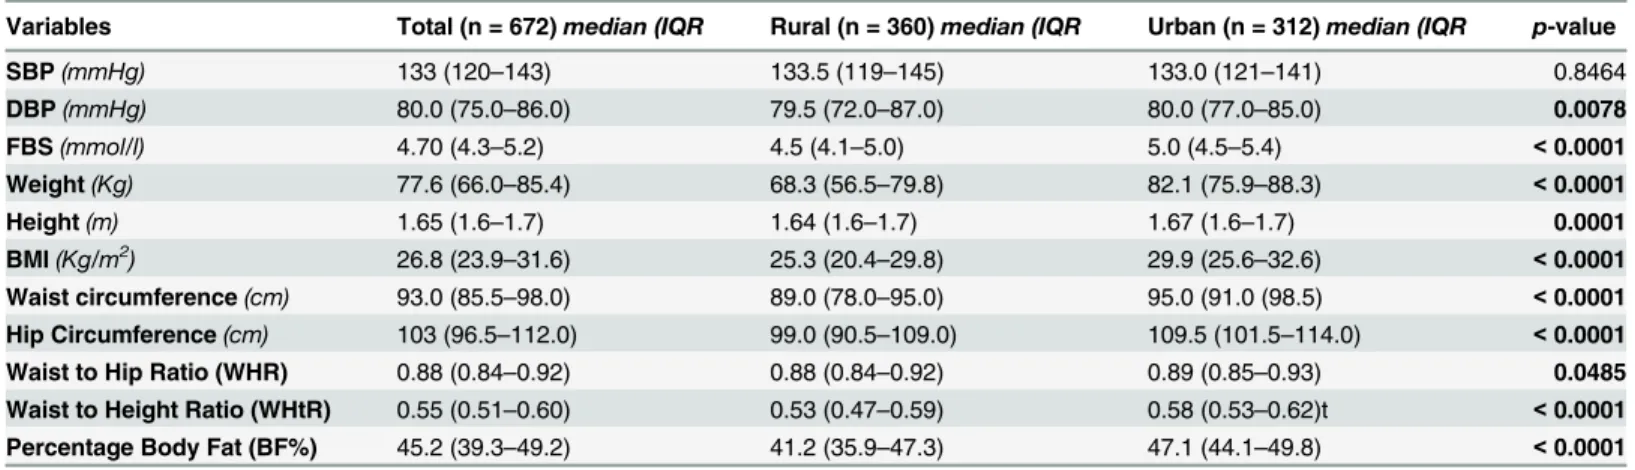
Table 2. Blood pressure and anthropometric variables of the study population.
Variables Total (n = 672)median (IQR Rural (n = 360)median (IQR Urban (n = 312)median (IQR p-value
SBP(mmHg) 133 (120–143) 133.5 (119–145) 133.0 (121–141) 0.8464
DBP(mmHg) 80.0 (75.0–86.0) 79.5 (72.0–87.0) 80.0 (77.0–85.0) 0.0078
FBS(mmol/l) 4.70 (4.3–5.2) 4.5 (4.1–5.0) 5.0 (4.5–5.4) <0.0001
Weight(Kg) 77.6 (66.0–85.4) 68.3 (56.5–79.8) 82.1 (75.9–88.3) <0.0001
Height(m) 1.65 (1.6–1.7) 1.64 (1.6–1.7) 1.67 (1.6–1.7) 0.0001
BMI(Kg/m2) 26.8 (23.9–31.6) 25.3 (20.4–29.8) 29.9 (25.6–32.6) <0.0001
Waist circumference(cm) 93.0 (85.5–98.0) 89.0 (78.0–95.0) 95.0 (91.0 (98.5) <0.0001 Hip Circumference(cm) 103 (96.5–112.0) 99.0 (90.5–109.0) 109.5 (101.5–114.0) <0.0001
Waist to Hip Ratio (WHR) 0.88 (0.84–0.92) 0.88 (0.84–0.92) 0.89 (0.85–0.93) 0.0485
Waist to Height Ratio (WHtR) 0.55 (0.51–0.60) 0.53 (0.47–0.59) 0.58 (0.53–0.62)t <0.0001 Percentage Body Fat (BF%) 45.2 (39.3–49.2) 41.2 (35.9–47.3) 47.1 (44.1–49.8) <0.0001
Data is presented as median (IQR); compared using Mann-Whitney test. p<0.05 was considered significant for rural vs urban. n: number. IQR: Interquartile range. SBP: Systolic blood pressure. DBP: Diastolic blood pressure. FBS: Fasting blood sugar. BMI: Body mass index.
doi:10.1371/journal.pone.0129494.t002
Table 3. Serum lipid levels of the study population.
Variable Total (n = 672)median (IQR Rural (n = 360)median (IQR Urban (n = 312)median (IQR p-value Total Cholesterol(mmol/l) 4.90 (4.55–5.40) 4.80 (4.55–5.20) 5.00 (4.65–5.50) <0.0001
Triglycerides(mmol/l) 1.30 (1.00–1.60) 1.35 (1.10–1.70) 1.20 (0.80–1.40) <0.0001
HDL-c(mmol/l) 1.00 (0.80–1.20) 1.00 (0.80–1.20) 1.00 (0.80–1.20) 0.8995
LDL-c(mmol/l) 3.40 (2.90–3.65) 3.10 (2.70–3.60) 3.40 (3.05–3.80) <0.0001
Coronary risk 4.9 (4.09–5.89) 4.89 (4.00–5.75) 4.95 (4.14–6.01) 0.0947
Data is presented as median (IQR); compared using Mann-Whitney test. p<0.05 was considered significant for rural vs urban. n: number. IQR: Interquartile range. HDL-c: High Density Lipoprotein cholesterol. LDL-c: Low Density Lipoprotein Cholesterol. Coronary Risk: Total Cholesterol/HDL-c.
In the rural area, low HDL-c (p<0.001), BMI25 (p<0.05), BMI30 (p<0.0001), high WC (p<0.0001) high WHtR (p<0.05) and physical inactivity (p<0.001) were more prevalent amongst females than their corresponding males. [Table 6]
Of those in the urban area, there were more females than males with a BMI25
(p<0.0001), overall obesity (p<0.0001), high WC (p<0.0001) and high WHtR (p<0.01). There were however more males than females with hypertension (p<0.001), type II diabetes (p<0.01), LDL-c (p<0.0001), a smoking habit (p<0.001) and who consumed alcohol (p<0.05). [Table 6]
For participants in both the urban and rural areas, there was a significant positive correla-tion between SBP and DBP, between blood pressure (SBP and DBP) and BF% and so was BMI
Table 4. Cardio-metabolic risk factors amongst study population stratified by type of community.
Risk factors Total (n = 672)n (%) Rural (n = 360)n (%) Urban (n = 312)n (%) p-value
Hypertension(140/90 mmHg) 234 (34.8) 132 (36.7) 102 (32.7) 0.2921
Type II diabetes(FBS>7.0 mmol/l) 51 (7.6) 21 (5.8) 30 (9.6) 0.0792
Total cholesterol(5.20 mmo/l) 231 (34.4) 99 (27.5) 132 (42.3) <0.0001
LDL-c(3.38 mmol/l) 339 (50.4) 147 (40.8) 192 (61.5) <0.0001
HDL-c(<1.04 mmo/l) 402 (59.8) 216 (60.0) 186 (59.6) 0.9372
Triglycerides(1.71mmol/l) 105 (15.6) 75 (20.8) 30 (9.6) <0.0001
BMI(25 Kg/m2) 471 (70.1) 201 (55.8) 270 (86.5) <0.0001
Overall obesity(30 Kg/m2) 243 (36.2) 87 (24.2) 156 (50.0)
<0.0001
WC(men>94 cm; women>80 cm) 381 (56.7) 177 (49.2) 204 (65.4) <0.0001
WHR(men0.90; women0.85) 396 (58.9) 210 (58.3) 186 (59.6) 0.7536
WHtR,(0.50) 546 (81.2) 246 (68.3) 300 (96.2) <0.0001
BF%(men25%; women30%) 669 (99.6) 357 (99.2) 312 (100.0) 0.2527
Physical inactivity 255 (37.9) 147 (40.8) 108 (34.6) 0.1109
Smoking habit 30 (4.5) 12 (3.3) 18 (5.8) 0.1377
Alcohol intake 129 (19.2) 57 (15.8) 72 (23.1) 0.0186
Data is presented as n (%); compared using Fischer’s test. p<0.05 was considered significant for rural vs urban. BMI: Body mass index. WC: Waist Circumference. WHR: Waist-to hip Ratio. WHtR: Waist-to height Ratio. BF%: Percentage body fat. HDL-c: High Density Lipoprotein cholesterol. LDL-c: Low Density Lipoprotein Cholesterol.
doi:10.1371/journal.pone.0129494.t004
Table 5. Odds Ratios associated with selected cardio-metabolic factors amongst the urban population (reference: rural population).
Risk factors Crude OR (95% CI) p-value Adj. OR-gender (95% CI)
p-value Adj. OR- gender and age (95% CI)
p-value
Total cholesterol(5.20 mmo/l) 1.9333 (1.40–2.67) 0.0001 1.9309 (1.39–2.67) 0.0001 1.8923 (1.36–2.62) 0.0001
LDL-c(3.38 mmol/l) 2.3184 (1.70–3.16) <0.0001 2.1443 (1.56–2.94) <0.0001 2.1554 (1.56–2.97) <0.0001
Triglycerides(1.71mmol/l) 0.4043 (0.26–0.64) 0.0001 0.4151 (0.26–0.66) 0.0002 0.4058 (0.25–0.65) 0.0001
BMI(25 Kg/m2) 5.0853 (3.46–7.48) <0.0001 6.4125 (4.26–9.66) <0.0001 6.1730 (4.07–9.37) <0.0001
Overall obesity(30 Kg/m2) 3.1379 (2.26–4.35) <0.0001 7.1574 (4.62–11.08) <0.0001 6.7235 (4.35–10.39) <0.0001
WC(men>94cm; women>80 cm)
1.9529 (1.46–2.67) <0.0001 4.6587 (3.00–7.23) <0.0001 4.3237 (2.76–6.76) <0.0001
WHtR,(0.50) 11.5854 (6.24– 21.50)
<0.0001 13.4726 (7.18–25.28) <0.0001 12.7659 (6.76–24.11) <0.0001
Alcohol intake 1.5947 (1.08–2.35) 0.0180 1.3866 (0.93–2.07) 0.1078 1.6292 (1.08–2.46) 0.0198
OR: Odds ratio. Adj: adjusted. Compared using Multivariate logistic regression. p<0.05 was considered significant.
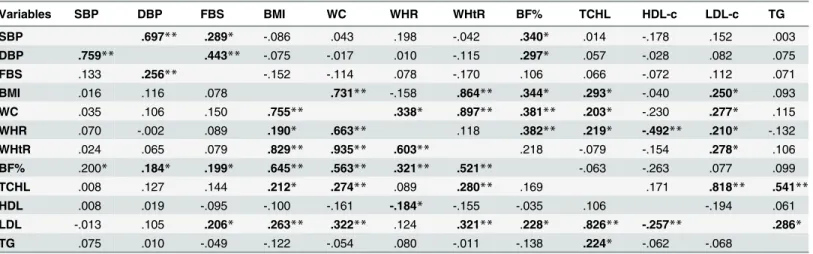
with WC, WHR, BF%, cholesterol and LDL-c. Similarly, waist circumference correlated posi-tively with WHR, WHtR, BF%, cholesterol and LDL-c and so was cholesterol with triglycerides and LDL-c, in both areas. WHR showed a significant positive association with BF% in both areas but with WHtR only in the rural community and with cholesterol and LDL-c in the urban community. A positive association was observed between FBS and blood pressure (SBP and DBP) in the urban area but with only DBP in the rural area. LDL-c showed a significant positive association with triglycerides and BF%, amongst participants in the urban area.
[Table 7]
Discussion
As urbanization continues to reach many communities in Ghana, there is a possible risk of a change in lifestyle. This may result in changes cardio-metabolic risk factors, which may reduce the quality of life and increase the rates of premature deaths. In this study, we described the dif-ferences in prevalence of obesity and cardio-metabolic risk factors, in study participants resid-ing in urban and rural settlements. Results showed that indices of obesity (BMI, WC, HC, WHR, WHtR, and BF%) were higher in urban residents. Similarly, other cardio-metabolic markers (DBP, FBS, total cholesterol and LDL-c) and unhealthy lifestyle practices like alcohol consumption were higher amongst urban residents. Cardio-metabolic risk factors were
Table 6. Cardio-metabolic risk factors amongst study population stratified by gender and type of community.
Risk factors Male (n = 312) Female (n = 360)
Rural (n = 144)n (%)
Urban (n = 168)n (%)
p-value Rural (n = 216)n (%)
Urban (n = 144)n (%)
p-value
Hypertension(140/90 mmHg) 72 (49.9)**** 72 (42.9) 0.2616 60 (27.8) 30 (20.8)††† 0.1681
Type II diabetes(FBS>7.0 mmol/ l)
12 (8.3) 24 (14.3) 0.1398 9 (4.2) 6 (4.2)†† 0.7886
Total cholesterol(5.20 mmo/l) 39 (27.1) 72 (42.9) 0.0053 60 (27.8) 60 (41.7) 0.0086 LDL-c(3.38 mmol/l) 66 (45.8) 126 (75.0) <0.0001 81 (37.5) 66 (45.8)†††† 0.1442
HDL-c(<1.04 mmo/l) 69 (47.9)*** 102 (60.7) 0.0053 147 (68.1) 84 (58.3) 0.0738
Triglycerides(1.71mmol/l) 24 (16.7) 18 (10.7) 0.1672 51 (23.6) 12 (8.3) 0.0003
BMI(25 Kg/m2) 69 (47.9)* 126 (75.0) <0.0001 132 (61.1) 144 (100.0)†††† <0.0001
Overall obesity(30 Kg/m2) 15 (10.4)**** 30 (17.9) 0.0859 72 (33.3) 126 (87.5)†††† <0.0001 WC(men>94cm; women>80cm) 30 (20.8)**** 60 (35.7) 0.0056 147 (68.1) 144 (100.0)†††† <0.0001
WHR(men0.90; women0.85) 75 (52.1) 96 (57.1) 0.4410 135 (62.5) 90 (62.5) 1.0000
WHtR,(0.50) 87 (60.4)* 156 (92.9) <0.0001 159 (73.6) 144 (100.0)†† <0.0001
BF%(men25%; women30%) 144 (100.0) 168 (100.0) 1.0000 213 (98.6) 144 (100.0) 0.4029
Physical inactivity 42 (29.2)*** 54 (32.1) 0.6670 105 (48.6) 54 (37.5) 0.0489
Smoking habit 9 (6.2)* 18 (10.7) 0.2265 3 (1.4) 0 (0.0)††† 0.4029
Alcohol intake 42 (29.2)**** 48 (28.6) 0.9930 15 (6.9) 24 (16.7)† 0.0058
Data is presented as n (%); compared using Fisher’s test. p<0.05 was considered significant for rural vs urban in each gender category.
*Indicate significance for comparison between rural males and rural females. †Indicate significance for comparison between urban males and urban females.
*/†Significant at the p<0.05 level.
**/††Significant at the p<0.01 level.
***/†††Significant at the p<0.001 level.
****/††††Significant at the p<0.0001 level. n: number BMI: Body mass index. WC: Waist Circumference. WHR: Waist-to hip Ratio. WHtR: Waist-to height Ratio. BF%: Percentage body fat. HDL-c: High Density Lipoprotein cholesterol. LDL-c: Low Density Lipoprotein Cholesterol
observed to be more prevalent in female participants, as compared to males, after adjusting for age.
Participants were observed to have high rates of literacy and employment; rural residents were more likely than urban residents to work in the informal sector. The informal sector usu-ally comprises of jobs mostly classified as“non-white collar”and involves activity that is more vigorous and requires less number of years of education, compared to jobs in the formal sector. The high rate of informal sector employment amongst the rural participants may therefore be due to the low level of education in this area. Occupational physical activity may contribute to the lower prevalence of cardio-metabolic risk factors in rural, compared to urban residents, as observed in this study. A study conducted in 2007 reported that residency per se does not con-tribute solely to the differences in cardio-metabolic risk factors observed between urban and rural areas in Guatemalan adults; rather, occupation is a more important factor [36]. Gregory and colleagues reported a similarly lower prevalence of cardio-metabolic risk factors amongst people with jobs that involved less sedentary lifestyles (rural) compared to those in the urban areas. Therefore, residency, education and occupation interact and may have implications on lifestyle factors, which affect the observed rate of cardio-metabolic risk factors amongst a population.
Many similar studies have shown strong evidence of associations between increasing urban-ization and cardio-metabolic risk factors like high BMI, diabetes mellitus, or hypertension [3,
37–40]. Theories propose that as areas adopt urban characteristics, energy consumption and
expenditure patterns change through a rise in energy-rich diets and sedentary lifestyles [41,
42]. These changes in effect result in an increase in adiposity and thus an increase in cardio-metabolic risks. A cross-sectional study in Cameroon similarly reported that urban living was associated with a higher fasting blood sugar, a higher BMI, and a higher blood pressure com-pared to rural residents with less than 2 years of exposure to urban environments [43]. The present study however could not determine the effect of time on the change in lifestyle and car-dio-metabolic risk factors. The findings we report here are still important for public health as
Table 7. Spearman’s rho correlation coefficients between selected cardio-metabolic variables for rural (Lower Left-Hand Side) and urban (Upper Right-Hand Side).
Variables SBP DBP FBS BMI WC WHR WHtR BF% TCHL HDL-c LDL-c TG
SBP .697** .289* -.086 .043 .198 -.042 .340* .014 -.178 .152 .003
DBP .759** .443** -.075 -.017 .010 -.115 .297* .057 -.028 .082 .075
FBS .133 .256** -.152 -.114 .078 -.170 .106 .066 -.072 .112 .071
BMI .016 .116 .078 .731** -.158 .864** .344* .293* -.040 .250* .093
WC .035 .106 .150 .755** .338* .897** .381** .203* -.230 .277* .115
WHR .070 -.002 .089 .190* .663** .118 .382** .219* -.492** .210* -.132
WHtR .024 .065 .079 .829** .935** .603** .218 -.079 -.154 .278* .106
BF% .200* .184* .199* .645** .563** .321** .521** -.063 -.263 .077 .099
TCHL .008 .127 .144 .212* .274** .089 .280** .169 .171 .818** .541**
HDL .008 .019 -.095 -.100 -.161 -.184* -.155 -.035 .106 -.194 .061
LDL -.013 .105 .206* .263** .322** .124 .321** .228* .826** -.257** .286*
TG .075 .010 -.049 -.122 -.054 .080 -.011 -.138 .224* -.062 -.068
**Correlation is significant at the 0.01 level (2-tailed).
*Correlation is significant at the 0.05 level (2-tailed). SBP: Systolic Blood Pressure. DBP: Diastolic blood Pressure. FBS: Fasting Blood Sugar. WC: Waist circumference. WHR: Waist-to-hip ratio. WHtR: Waist-to-height ratio. BF%: percentage Body Fat. TCHL: Total Cholesterol. HDL-c: High Density
Lipoprotein cholesterol. LDL-c: Low Density Lipoprotein Cholesterol. TG: triglycerides.
they suggest that people living in urban areas have increased risk factors to cardio-metabolic diseases.
It is however noteworthy that along with the observed differences in prevalence of cardio-metabolic risk factors, we recorded more females in the urban community and more males in the rural community. Furthermore, cardio-metabolic risk factors were observed to be more prevalent in female participants, Research in Ghana has shown that cardio-metabolic risk fac-tors are more prevalent amongst women than in men [18,19]. Amoah and colleagues found that at all ages, more females (32.9%) than males (12.0%) had BMI’s within the 4th quartile (>or = 27.3 Kg/m2) [18]. Gregoryet al., in a similar study showed that sedentary lifestyle is more common amongst women than in men [36] and this may have contributed to the ob-served higher prevalence of cardio-metabolic risk factors in the urban area. High class or urban females have also been shown to have higher BMI than females in lower class suburbs [18]. When stratified by gender, the differences in cardio-metabolic risk factors were seen in each strata. When adjusted for sex, the differences between urban and rural participants remained statistically significant. This suggests that the urban / rural differences observed are not driven by the prevalence of women in these settings, but by the interaction of both gender and setting.
Overweight and obesity are important risk factors for cardio-metabolic and diverse chronic medical conditions [5–7], including hypertension [8] and dyslipidaemia [9,10]. This is sup-ported by our observed positive correlation between anthropometric variables, serum lipids (total cholesterol and LDL-c) and blood pressure in both areas studied.
The current study is however limited by its cross-sectional nature. As such, we were unable to determine the changes in lifestyle that occur over time in both urban and rural areas. The current study also did not take into account residential history of participants before recruit-ment. Percentage body fat calculation using BMI has not been validated in the African popula-tion. Furthermore, Deurenberget al., [32] showed that BF% in obese subjects (BMI>30 Kg/ m2) was slightly overestimated by the prediction formula used in the present study. This differ-ence however became statistically significant only in obese subjects with a BMI33 Kg/m2. In the present study however, median BMI for the total population, and for both areas were less than 30 Kg/m2 and the proportion of individuals with a BMI>30, was 36.2%. The addition of other anthropometric variables further improves findings from the present study.
Conclusion
Obesity and cardio-metabolic risk factors are prevalent amongst adults in both urban and rural communities in Ghana. These risk factors are more prevalent in urban residents and in women., There is an urgent need to avert the rise of diet and lifestyle related chronic diseases in Ghana as it undergoes increasing urbanization. It would be prudent for health workers to in-corporate measures of adiposity into routine vital checks to enhance evaluation of health status of individuals.
Acknowledgments
The authors would like to acknowledge all participants who voluntarily contributed to the suc-cess of this study.
Author Contributions
References
1. Lopez AD, Mathers CD, Ezzati M, Jamison DT, Murray CJ. Global and regional burden of disease and risk factors, 2001: systematic analysis of population health data. Lancet. 2006; 367(9524):1747–57. doi:10.1016/S0140-6736(06)68770-9PMID:16731270.
2. Shaw JE, Sicree RA, Zimmet PZ. Global estimates of the prevalence of diabetes for 2010 and 2030. Di-abetes research and clinical practice. 2010; 87(1):4–14. doi:10.1016/j.diabres.2009.10.007PMID: 19896746.
3. Riha J, Karabarinde A, Ssenyomo G, Allender S, Asiki G, Kamali A, et al. Urbanicity and lifestyle risk factors for cardiometabolic diseases in rural Uganda: a cross-sectional study. PLoS medicine. 2014; 11 (7):e1001683. doi:10.1371/journal.pmed.1001683PMID:25072243; PubMed Central PMCID: PMC4114555.
4. Thomas AG, Michael JG. Harrison’s Principles of internal medicine. Philadelphia: Elsevier Saunders; 2012.
5. Iloh GUP, Amadi AN, Njoku PU, Ofoedu JN, Awa-Madu J. The magnitude of abdominal adiposity and atherogenic dyslipidaemia among geriatric Nigerians with arterial hypertension in a rural hospital in south-eastern Nigeria. Niger J Clin Pract. 2012; 15:462–8. doi:10.4103/1119-3077.104528PMID: 23238199
6. Okosun IS, Choi S, Dent MM, Jobin T, Dever GE. Abdominal obesity defined as a larger than expected waist girth is associated with racial/ethnic differences in risk of hypertension. Journal of human hyper-tension. 2001; 15(5):307–12. doi:10.1038/sj.jhh.1001179PMID:11378832.
7. Okosun IS, Prewitt TE, Cooper RS. Abdominal obesity in the United States: prevalence and attributable risk of hypertension. Journal of human hypertension. 1999; 13(7):425–30. PMID:10449204.
8. Barrett-Connor E, Khaw KT. Is hypertension more benign when associated with obesity? Circulation. 1985; 72(1):53–60. PMID:4006136.
9. Barrett-Connor EL. Obesity, atherosclerosis, and coronary artery disease. Annals of internal medicine. 1985; 103(6 (Pt 2)):1010–9. PMID:3904565.
10. Walker AR. World pandemic of obesity–any hope of its being controlled? South African medical journal = Suid-Afrikaanse tydskrif vir geneeskunde. 2003; 93(8):598–600. PMID:14531118.
11. Obesity and overweight [Internet]. World Health Organization. 2014. Available:http://www.who.int/ mediacentre/factsheets/fs311/en/.
12. Siminnialayi IM, Emem-Chioma PC, Dapper DV. The prevalence of obesity as indicated by BMI and waist circumference among Nigerian adult attending Family Medicine clinics as outpatients in Rivers state. Nigerian journal of medicine: journal of the National Association of Resident Doctors of Nigeria. 2008; 17:340–5.
13. Doll S, Paccaud F, Bovet P, Burnier M, Wietlisbach V. Body mass index, abdominal adiposity and blood pressure: consistency of their association across developing and developed countries. Interna-tional journal of obesity and related metabolic disorders: journal of the InternaInterna-tional Association for the Study of Obesity. 2002; 26(1):48–57. doi:10.1038/sj.ijo.0801854PMID:11791146.
14. Wahrenberg H, Hertel K, Leijonhufvud BM, Persson LG, Toft E, Arner P. Use of waist circumference to predict insulin resistance: retrospective study. BMJ. 2005; 330(7504):1363–4. doi:10.1136/bmj.38429. 473310.AEPMID:15833749; PubMed Central PMCID: PMC558285.
15. Ziraba AK, Fotso JC, Ochako R. Overweight and obesity in urban Africa: A problem of the rich or the poor? BMC public health. 2009; 9:465. doi:10.1186/1471-2458-9-465PMID:20003478; PubMed Cen-tral PMCID: PMC2803188.
16. Agyemang C, Owusu-Dabo E, de Jonge A, Martins D, Ogedegbe G, Stronks K. Overweight and obesity among Ghanaian residents in The Netherlands: how do they weigh against their urban and rural coun-terparts in Ghana? Public health nutrition. 2009; 12(7):909–16. doi:10.1017/S1368980008003510 PMID:18761759.
17. Amoah AG. Sociodemographic variations in obesity among Ghanaian adults. Public health nutrition. 2003; 6(8):751–7. PMID:14641945.
18. Amoah AG. Obesity in adult residents of Accra, Ghana. Ethnicity & disease. 2003; 13(2 Suppl 2):S97– 101. PMID:13677422.
19. Owiredu WKBA, Adamu MS, Amidu N, Woode E, Bam V, Planger-Rhule J, et al. Obesity and Cardio-vascular Risk Factors in a Pentecostal Population in Kumasi-Ghana. Journal of Medical Sciences. 2008; 8(8).
21. WHO. Obesity And Overweight Geneva, Switzerland: World Health Organization; 2006 [accessed 2014 April 8]. Available:http://www.who.int/mediacentre/factsheets/fs311/en/.
22. WHO. Preventing Chronic Diseases, A Vital Investment. Geneva, Switzerland: World Health Organi-zation, 2005. PMID:16312060
23. Dake FA, Tawiah EO, Badasu DM. Sociodemographic correlates of obesity among Ghanaian women. Public health nutrition. 2011; 14(7):1285–91. doi:10.1017/S1368980010002879PMID:21029510.
24. Population and Housing Census [Internet]. Ghana Statistical Service. 2010.
25. Friedewald WT, Levy RI, Fredrickson DS. Estimation of the concentration of low-density lipoprotein cholesterol in plasma, without use of the preparative ultracentrifuge. Clinical chemistry. 1972; 18 (6):499–502. PMID:4337382
26. National Cholesterol Education Program Expert Panel on Detection E, Treatment of High Blood Cho-lesterol in A. Third Report of the National ChoCho-lesterol Education Program (NCEP) Expert Panel on De-tection, Evaluation, and Treatment of High Blood Cholesterol in Adults (Adult Treatment Panel III) final report. Circulation. 2002; 106(25):3143–421. PMID:12485966.
27. WHO. Definition and diagnosis of diabetes mellitus and intermediate hyperglycemia: Report of a WHO/ IDF consultation. Geneva, Switzerland: World Health organization, 2006.
28. Sodjinou R, Agueh V, Fayomi B, Delisle H. Obesity and cardio-metabolic risk factors in urban adults of Benin: relationship with socio-economic status, urbanisation, and lifestyle patterns. BMC public health. 2008; 8:84. doi:10.1186/1471-2458-8-84PMID:18318907; PubMed Central PMCID: PMC2315643.
29. Despres JP, Lemieux I, Prud'homme D. Treatment of obesity: need to focus on high risk abdominally obese patients. BMJ. 2001; 322(7288):716–20. PMID:11264213; PubMed Central PMCID: PMC1119905.
30. WHO. Waist Circumference and Waist–Hip Ratio: Report of a WHO Expert Consultation Geneva, Swit-zerland: World Health organization, 2008.
31. Lee CMY, Huxley RR, Wildman RP, Woodward M. Indices of abdominal obesity are better discrimina-tors of cardiovascular risk facdiscrimina-tors than BMI: a meta-analysis. Journal of clinical epidemiology. 2008; 61 (7):646–53. doi:10.1016/j.jclinepi.2007.08.012PMID:18359190
32. Deurenberg P, Weststrate JA, Seidell JC. Body mass index as a measure of body fatness: age- and sex-specific prediction formulas. The British journal of nutrition. 1991; 65(2):105–14. PMID:2043597.
33. Hortobagyi T, Israel RG, O'Brien KF. Sensitivity and specificity of the Quetelet index to assess obesity in men and women. European journal of clinical nutrition. 1994; 48(5):369–75. PMID:8055853
34. Kirkendall WM, Burton AC, Epstein FH, Freis ED. Recommendations for human blood pressure deter-mination by sphygmomanometers. Circulation. 1967; 36(6):980–8. Epub 1967/12/01. PMID:6061343.
35. Chalmers J, MacMahon S, Mancia G, Whitworth J, Beilin L, Hansson L, et al. 1999 World Health Orga-nization-International Society of Hypertension Guidelines for the management of hypertension. Guide-lines sub-committee of the World Health Organization. Clinical and experimental hypertension. 1999; 21(5–6):1009–60. doi:10.3109/10641969909061028PMID:10423121.
36. Gregory CO, Dai J, Ramirez-Zea M, Stein AD. Occupation is more important than rural or urban resi-dence in explaining the prevalence of metabolic and cardiovascular disease risk in Guatemalan adults. The Journal of nutrition. 2007; 137(5):1314–9. PMID:17449598; PubMed Central PMCID:
PMC1904431.
37. Allender S, Lacey B, Webster P, Rayner M, Deepa M, Scarborough P, et al. Level of urbanization and noncommunicable disease risk factors in Tamil Nadu, India. Bulletin of the World Health Organization. 2010; 88(4):297–304. doi:10.2471/BLT.09.065847PMID:20431794; PubMed Central PMCID: PMC2855597.
38. Monda KL, Gordon-Larsen P, Stevens J, Popkin BM. China's transition: the effect of rapid urbanization on adult occupational physical activity. Soc Sci Med. 2007; 64(4):858–70. doi:10.1016/j.socscimed. 2006.10.019PMID:17125897; PubMed Central PMCID: PMC2753984.
39. Dahly DL, Adair LS. Quantifying the urban environment: a scale measure of urbanicity outperforms the urban-rural dichotomy. Soc Sci Med. 2007; 64(7):1407–19. doi:10.1016/j.socscimed.2006.11.019 PMID:17196724; PubMed Central PMCID: PMC2001275.
40. Novak NL, Allender S, Scarborough P, West D. The development and validation of an urbanicity scale in a multi-country study. BMC public health. 2012; 12:530. doi:10.1186/1471-2458-12-530PMID: 22818019; PubMed Central PMCID: PMC3554435.
41. Kinra S, Andersen E, Ben-Shlomo Y, Bowen L, Lyngdoh T, Prabhakaran D, et al. Association between urban life-years and cardiometabolic risk: the Indian migration study. American journal of epidemiology. 2011; 174(2):154–64. doi:10.1093/aje/kwr053PMID:21622949; PubMed Central PMCID:
42. Antecol H, Bedard K. Unhealthy assimilation: why do immigrants converge to American health status levels? Demography. 2006; 43(2):337–60. PMID:16889132.