Tissues
Benedicte Mengel Pers1, Sandeep Krishna2, Sagar Chakraborty1, Simone Pigolotti1, Vedran Sekara1, Szabolcs Semsey1, Mogens H. Jensen1*
1Center for Models of Life, Niels Bohr Institute, University of Copenhagen, Copenhagen, Denmark,2National Centre for Biological Sciences, Tata Institute of Fundamental Research, Bangalore, India
Abstract
In many developing tissues, neighboring cells enter different developmental pathways, resulting in a fine-grained pattern of different cell states. The most common mechanism that generates such patterns is lateral inhibition, for example through Delta-Notch coupling. In this work, we simulate growth of tissues consisting of a hexagonal arrangement of cells laterally inhibiting their neighbors. We find that tissue growth by cell division and cell migration tends to produce ordered patterns, whereas lateral growth leads to disordered, patchy patterns. Ordered patterns are very robust to mutations (gene silencing or activation) in single cells. In contrast, mutation in a cell of a disordered tissue can produce a larger and more widespread perturbation of the pattern. In tissues where ordered and disordered patches coexist, the perturbations spread mostly at boundaries between patches. If cell division occurs on time scales faster than the degradation time, disordered patches will appear. Our work suggests that careful experimental characterization of the disorder in tissues could pinpoint where and how the tissue is susceptible to large-scale damage even from single cell mutations.
Citation:Mengel Pers B, Krishna S, Chakraborty S, Pigolotti S, Sekara V, et al. (2012) Effects of Growth and Mutation on Pattern Formation in Tissues. PLoS ONE 7(11): e48772. doi:10.1371/journal.pone.0048772
Editor:Henrik Jo¨nsson, Lund University, Sweden
ReceivedApril 30, 2012;AcceptedOctober 5, 2012;PublishedNovember 7, 2012
Copyright:ß2012 Mengel Pers et al. This is an open-access article distributed under the terms of the Creative Commons Attribution License, which permits unrestricted use, distribution, and reproduction in any medium, provided the original author and source are credited.
Funding:This study was funded by The Danish National Research Foundation. The funders had no role in study design, data collection and analysis, decision to publish, or preparation of the manuscript.
Competing Interests:The authors have declared that no competing interests exist.
* E-mail: [email protected]
Introduction
Tissues and organs of eukaryotic organisms develop by cell division and cellular differentiation. While organs exhibit a great variety in their morphology, tissues can often be approximated by a two-dimensional layered structure. Such tissues can be modeled on a hexagonal 2D lattice [1–3].
Cellular differentiation involves switching between patterns of gene expression, and is often controlled by signals produced by other cells of the organism. In general, cells can receive signals over large distances (endocrine signaling) [4], short distances (paracrine signaling) [5], or via direct contact of neighboring (juxtacrine signaling) or distant cells (e.g. through tunneling nanotubes) [6]. Direct contact allows for very precise control of cell differentiation because it does not require diffusion of a chemical signal in the intercellular space.
Juxtacrine signalling pathways are present in many multicellular organisms, and can be implemented by different mechanisms [7– 10]. Using juxtacrine signaling, cells expressing a signal can influence the gene expression pattern of their neighboring cells. Such mechanisms may result in two distinct differentiation pathways in the initially equivalent cells, allowing formation of fine-grained patterns in larger structures [1,11].
The example of juxtacrine signaling inspired the study of patterns in lateral inhibition models [11–15]. These models can be viewed as simplified versions of juxtacrine signaling, in which the circuit inside each cell is reduced to a single protein concentration, whose effect is to inhibit the production of the same protein in
neighboring cells. Such models can be pictorially represented on a hexagonal 2D lattice. It has been shown [11] how these models generically lead to regular patterns where the expression activity in each cell can be either in a high or low state, and on each row a repeated high-low-low pattern is found, so that each cell with a high activity is surrounded by silenced cells.
In this paper, we show that the aforementioned pattern is not always achievable and the pattern obtained depends on how the tissue is formed. We consider two mechanisms of tissue growth: (i) through cell division where a mother cell gives birth to a daughter cell in each time step of the growth; and (ii) through cell migration where cells migrate towards the tissue and attach to its boundaries. The main objective of this paper is to address the following general points: 1) Whether it is possible to obtain a regular pattern in a dynamically growing tissue; 2) Whether it is possible to obtain a regular pattern in a large group of non-differentiated cells; 3) The requirements of regular pattern formation, including the role of growth speed; 4) Robustness of the patterns to mutations; 5) Sensitivity of the pattern to mutations during tissue formation.
Results
Tissue Formation
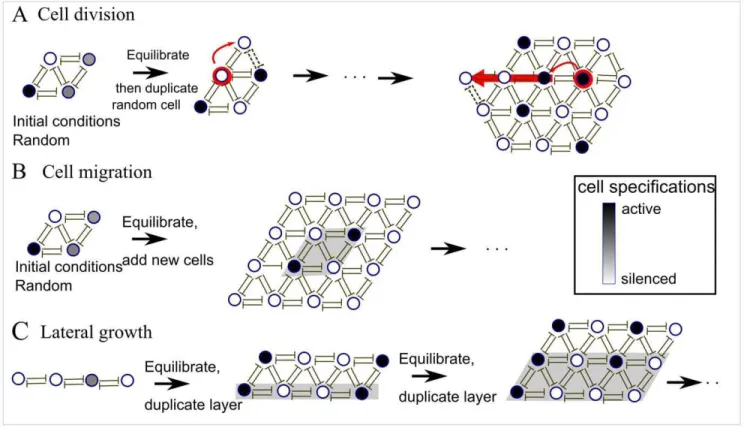
random, is doubled. The new daughter cell has the same activity as the mother cell. The new cell is placed in a randomly chosen site that is adjacent to the mother cell, and the row of existing cells in that direction is pushed outwards. The tissue with one new cell is now equilibrated after which a new cell is doubled, and so on (Figure 1).
B. Throughcell migration: In each step, a new layer of silenced/ inactive cells is added adjacent to all existing tissue cells after which the tissue is dynamically equilibrated by the dynamical equations, Figure 1.
C. Throughlateral growth: New cells are added layer by layer in one direction only, starting with one row of cells. The new row of daughter cells is obtained through cell division from the existing mother cells of the previous row, Figure 1C. After the growth of a new layer, the tissue is equilibrated. D. Through arandom configuration of cells in silenced and active
states: In this case, all cells are present in the tissue from the beginning of the simulation and the tissue does not grow. Each cell is initiated in a random state taken from a broad range of values from low (silenced) to high (active). After initiation, the entire tissue is equilibrated into the final state.
Patterns of Cell States Depend on How the Tissue is Generated
The four ways of building the tissue produce different patterns of silenced and active cells. Figure 2 shows a tissue grown by the cell division method A), where one cell is doubled in each time step. After 291 divisions (Figure 2C), the center of the tissue is completely ordered with every active cell (black) surrounded by six silenced cells (light gray). Conversely, each silenced cell is surrounded by three active and three silenced neighbors. As the tissue expands, the pattern becomes ordered apart from slight irregularities in proximity of the boundary. This regular pattern is a general feature of this system, as shown in [11].
Generation of the tissue by the different methods described in Figure 2 lead to ordered and disordered patterns of cell activity. Cell division and migration, method A) and B) produces an ordered pattern (Figure 3A), both when the new cells are in an active or silenced state. In contrast, lateral growth results in random patches of disordered and ordered patterns in the tissue (Figure 3B). The boundary between ordered and disordered patterns (denoted default lines) are defined by the cells being in the high state which are not neighbored by two silent cells in any of the six directions of the hexagonal lattice. The positions of the default lines are not static, but tend to move during tissue growth. The disordered pattern has been observed to be defined vertical areas in the tissue, independent of the size of the tissue, and not the very disordered pattern produced by random initial conditions (Figure 3C).
silenced, depending of the initial state of the cell.
The recording of the effects of a mutation is performed in two ways, measuring:
N
The total change in cell activities in the entire tissue after the mutation of a single cell,N
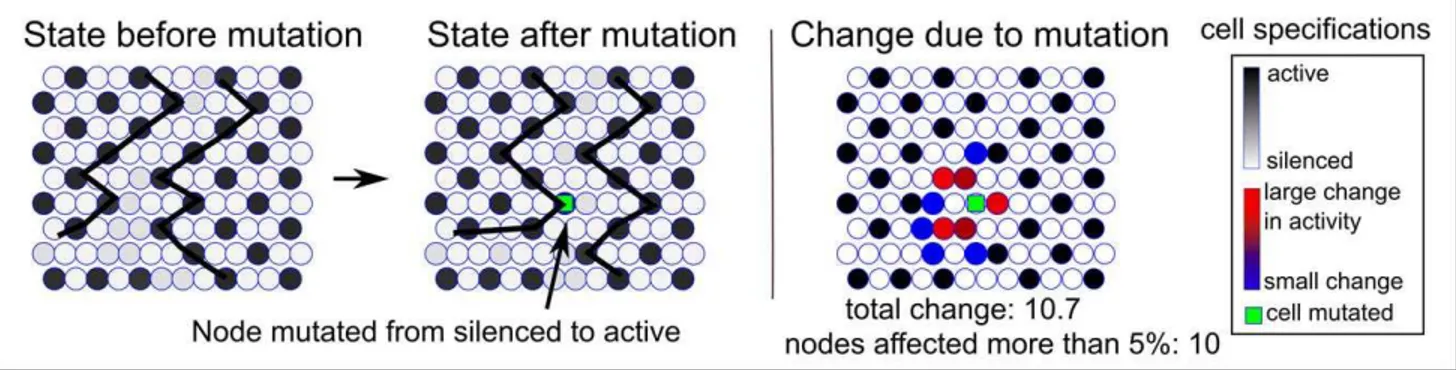
The number of cells whose activity is affected more than 5% after a mutationFigure 4 shows an example of a mutation of one cell performed on an equilibrated tissue with a band of disorder at the center (Figure 4, left panel). On the boundary of the disordered patch (indicated by the ragged line) a cell is mutated from a silenced to an active state (middle panel). Figure 4 (right panel) shows the total distortion due to the mutation where the activity of 10 cells are affected more than 5% (the total distortion is estimated as the sum of the absolute values of activity changes). The color indicates which cells are affected the most (red) and which are affected the least (blue). This procedure is performed for each cell of the tissue.
Ordered Patterns are More Robust Against Mutation of Cells than Disordered Patterns
The two lower rows (D–I) of Figure 3 shows the results of mutations in the three different tissues we consider: tissues grown by cell division or cell migration (Figure 3A), by lateral growth (Figure 3B) and a tissue spanned by cells having random initial conditions (Figure 3C). We conclude that.
N
Ordered cell patterns are more robust against mutations than the disordered patternsN
Effects of mutations are more pronounced at the boundaries between the ordered and disordered patches.The tissue in Figure 3A is ordered before mutations. In this case, the effect of mutations is very small and the only detectable effect is observed for the few cells close to the boundaries (Figure 3D,G) where the cells are not stabilized from all sides.
effects) where the top most row shows measurements for all cells that were silenced before the mutations and the second row shows measurements for all cells that were active before mutations. The ordered tissue grown by cell migration is the most robust to mutations. In particular, it is extremely robust to the class of mutations turning active cells silenced. Making a silenced cell active destabilizes other active cells close by, causing a rearrange-ment of the active and the silenced cells in the surroundings.
However, mutating and keeping an active cell silenced, releases the repression of the neighboring cells and allows for a slight increase in protein activity. This latter effect is not as fatal for the pattern structure as introducing another active cell in the pattern. The effect of mutating a cell from silenced to active is statistically larger (pv2:2:10{16) than when a cells mutated from
active to silenced, in all tissues.
Figure 1. Three different growth mechanisms of tissues on hexagonal lattices.A). Cell division: A random cell in the tissue is doubled in each time step. The daughter cell is born in the same state as the mother cell and existing cells are pushed outwards (in a random direction) by the newly born cell. After each cell cycle the entire tissue is equilibrated by the dynamical equations (eq. 2). B). Cell migration: Cells are in each time step migrated onto the entire boundary of the tissue. All newly arriving cells are in the silenced state. The tissue is equilibrated between each growth step. C). Lateral growth: the tissue is grown only along one side through cell divisions, where each daughter cell is born in the same state as the mother. Between each addition of a new layer, the entire tissue is equilibrated. The parameter values were:c~0:1,c~1,a~2,h~3,K~1.
doi:10.1371/journal.pone.0048772.g001
Figure 2. Tissue growth under cell division where in each cell cycle, a random cell is chosen and multiplied such that the daughter cell is born in the same state as the mother cell.The new cell pushes existing states in a random direction. The cells are graded from black (active cell) down to light gray (silenced cell). Note that the center of the tissue becomes completely ordered, i.e. each active cell is surrounded by six silenced cells.
Effects of Mutations are More Pronounced at the Boundaries Between the Ordered and Disordered Patches
For the tissues with disordered patches, we observe that the most pronounced effect of mutations occurs in cells located close to a default line (see Figure 3 E,F,H,I). With the aim of capturing this effect we separated the cells into two groups: those located within two cells from a default line and those beyond two cells (Table 1 lower rows), considering cells in both ordered and disordered areas of the tissue and measuring the shortest distance from the cell to the default lines in the tissue. We see that the effect of a mutation is significantly higher when performed within two cells of a default line in a tissue built by lateral growth, both when cells are mutated from silenced to active (pv2:2:10{16) and when they are mutated
from active to silenced (pv2:2:10{16). The effect of a mutation
performed in the random tissue within two cells of the default line is additionally statistically higher than when the mutation is performed more than two cells away from the default line, both for cells mutated from silenced to active (pv3:84:10{14) and cells
mutated from active to silenced (pv2:2:10{16).
Mutation of cells have a larger effects on the surrounding tissue in the completely random tissue, where defects dominate, than observed in the tissue built by lateral growth. This effect is due to the less organized boundary between the disordered and ordered patches in the random tissue (see Figure 3).
Generally, we can conclude that mutating a silenced cell to become active does always have an effect but the active cell must be close to the default line to have an effect on the state of the cells.
Figure 3. Total effect of mutations of single cells in the tissue.Starting from three different equilibrated tissues formed by cell division and migration (A), lateral growth (B) and random initial conditions (C), respectively, each cell of the tissue is mutated by the following rule:silenced? activeoractive?silenced. The mutated cell is kept in the state it is set to after mutation. Panel (D–F): the color scheme indicates the sum of the activity changes over the entire tissue due to the mutation of one single cell. The lower panels (G–I) display the number of nodes affected by the mutation of the given cell. We note that the effects of mutations in the ordered tissue (A,D,G) are small. The tissues with disordered patches are very sensitive to mutations on the default lines separating these two phases. This is also apparent in the preformed tissue starting with cells being in random initial conditions where a larger effect occurs all along the default boundaries.
Also the effect of the silenced cell mutated active is larger at the boundary of a default line.
Dependence of Pattern Formation on Growth Speed
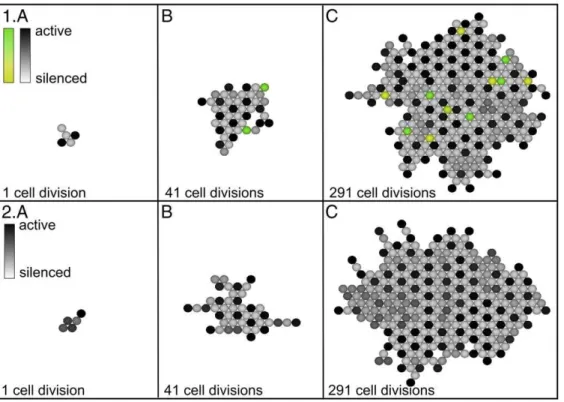
Figure 5(1A–C) shows a growth series, similar to the one in Figure 2, with the difference that mutations are now made during growth. In 5% of the cell divisions, the mother cell is mutated (and kept) into either a silenced (yellow) or active state (green), which creates a tissue with strongly disordered patches. As the tissue expands, such mutations lead to a disordered tissue.
During growth via cell divisions, the tissue is equilibrated through the dynamical equations (2) after each cell cycle.
Equilibrium is reached in a timescale mostly determined by the degradation time of the regulatory proteintd~1=cmin. When the
time between consecutive cell additions, T (typical time of cell duplication or cell migration), is much larger than the degradation time, the tissue can equilibrate faster than it grows, resulting in an ordered pattern.
The effect of variations in equilibration time on the tissue patterns is shown in Figure 5(2A–C), indicating three stages of the growth with a speed such thatT^td. This relatively fast growth
leads to a pattern that is disordered with patches where the cells equilibrate at an intermediate state.
Discussion
In this paper we studied the possible causes of ordered and disordered patterns in the formation of tissues, and the stability of tissue patterns with respect to mutations. We have modeled various mechanisms for tissue formation during development with an underlying hexagonal symmetry. This is a natural ordering of cells that are closely packed in a single layer (see Figure 1) and we have assumed that all neighboring cells repress each other. Seen from a biological viewpoint, the most natural way to grow a tissue is through cell division. We find that this invariably leads to ordered patterns when cells are allowed to equilibrate before further cell division. Cell migration defines an alternative way of growth which also leads to ordered patterns in the bulk. In both cases, some disorder is observed close to the tissue boundaries. Lateral growth, where an entire row of cells is integrated into the tissue in each cell cycle, on the other hand, leads to disordered patterns with default lines penetrating the tissue.
We observe that the ordered patterns are much more robust and stable against mutations than the disordered ones. Mutations in ordered tissues only lead to localized disorder with almost no large scale effect. On the contrary, mutations have more pronounced effects in the disordered patterns, in particular when mutations are performed very close to the boundary lines. These observations have fundamental biological implications: tissues which exhibit patches of disordered cell patterns might be much more affected by mutations, leading to possible developmental malfunctions. We have furthermore observed that disordered patterns in the tissue also appear during enforced speed of cell divisions. This indicates that in order to achieve biologically healthy stasis for a tissue, the growth speed has a physical lower bound which is set by the degradation rates of regulators involved. This observation suggests that (i) systems of natural lateral
Figure 4. The mutation of a single cell in a tissue grown through cell division.On the default boundary between the ordered and disordered tissue (left panel), a silenced state is mutated into an active state (middle panel). The rightmost panel shows the effect of the mutation, where red symbolizes the largest effect and blue the smallest. The total number of cells that are affected more than 5% by the mutation is 10 (all colored).
doi:10.1371/journal.pone.0048772.g004
Table 1.Average number of cells which are affected by more than 5%due to a single cell mutation of either a silenced to active cell, or an active to silenced cell, mean (standard deviation) in lattices with dimensions of 90690 cells.
Tissue growth Migration Lateral Random
Silenced to active, mean (std) 3 (0) 4 (1.8) 6.7 (2.8)
Active to silenced, mean (std) 0 (0) 0.7 (1.2) 2.8 (2)
Cells mutated from silenced to active
less than 2 cells from a default line, mean (std)
– 5.2 (2.1) 6.8 (2.8)
2 or more cells from a default line, mean (std)
– 3.1 (0.5) 5.7 (2.0)
Cells mutated from active to silenced
less than 2 cells from a default line, mean (std)
– 1.8 (1.5) 3.1 (1.9)
2 or more cells from a default line, mean (std)
– 0.02 (0.2) 0.7 (1.1)
The upper two rows are for the entire tissue. The middle two rows display silenced cells mutated active, separated into two groups; cells located within two cells of a default line, and those two cells or more from the default line. The lower two rows are likewise for cells that are mutated from active to silenced. Only cells within a distance of 3 cells from the outer boundary of the tissue are included in these counts, to avoid boundary effects. A tissue built by migration has no defects and thus no counts in the 4 lower rows. The average number of cells is taken over all cells and does thus include cells that cause less than5% change (contributing as zero and thereby lowering the average).
inhibition should have actively degraded components and (ii) a faster degradation rate of the slowest degraded component allows a faster growth of the tissue without introducing errors in the pattern.
Materials and Methods
The Model
In our phenomenological model, the tissue is idealized, which means that as opposed to real tissues it is made up of cells occupying sites on a hexagonal lattice, not containing any cells with less or more sides. A cell located on a specific site on the lattice is labeled by its coordinates (m,n). We consider the activity of a regulatory protein in each cell, denotedxm,n, and assume that
this activity can be repressed by signals received from the six neighboring cells. Cells with a low or zero cell activity are considered to be silenced and cells with a high cell activity are consideredactive. The dynamics of the protein activity of cell (m,n) is then given by the equation:
dxm,n
dt ~c{cxm,nzaFint ð1Þ
Herecis the background level of protein production,cis the
protein degradation rate, Fint is the repression term from the
neighboring cells and a is the strength of this repression. We assume that repression can be modeled via a Michaelis-Menten term and that repression from different cells act multiplicatively, where a signal received from one neighboring cell is sufficient to trigger the repression of the protein level in a given cell. We prefer
multiplicative coupling because in case of the additive coupling each neighbor cell would only contribute 1/6 of the repression and a threshold level would be needed. Additive repression does additionally require integration of signals received from the six neighboring cells [19]. The multiplicative function F can be written as:
Fint~ 1
1z(xmz1,K n)h
: 1
1z(xm{1,Knz1)h
: 1
1z(xm,Kn{1)h
: 1
1z(xm,nz1 K )
h: 1
1z(xmz1,n{1 K )
h: 1
1z(xm{1,n K )
h:
ð2Þ
Here,Kis the dissociation constant of the binding complex and his the Hill coefficient measuring cooperativity. We assign the same parameters to all cell-to-cell interactions in the lattice. A typical set of parameter values for the simulations presented in the paper is: c~0:1mMmin{1, c~1min{1, a~2mMmin{1, h~3, K~1mM.
In contrast to previous studies [20] where periodic boundary conditions were imposed, in all simulations presented in this paper we apply open boundary conditions meaning thatxm,n~0if node m,nis not occupied by a cell.
Model simulations were performed in MatLab (version 7.11.0). Statistical analysis were performed in R [21] using a two-sided Wilcoxon rank sum test.
Figure 5. Disordered patches appear when cells are mutated during tissue growth and when grown with accelerated speed.(1A–C) Mutations during growth. In 5% of the cell divisions, the mother cell is mutated (and kept) in either a silenced (yellow) or active state (green) state. This creates a tissue with strongly disordered patches. (2A–C) Effect of growth speed on the activity pattern. The equilibration timeTebetween each cell cycle is now of the size of the degradation timetd~1=cand is thus much shorter than the equilibration time used in Figure 2. Both disordered and ordered patches now appear side by side in the tissue.
Author Contributions
Conceived and designed the experiments: BMP SK SC SP SS MHJ. Performed the experiments: BPM MHJ VS. Analyzed the data: BMP SK SP SC VS SS MHJ. Wrote the paper: BMP MHJ SS SK.
References
1. Sprinzak D, Lakhanpal A, LeBon L, Santat LA, Fontes ME, et al. (2010) Cis-interactions between Notch and Delta generate mutually exclusive signalling states. Nature 465: 86–90.
2. Pyshnov MB (1980) Topological solution for cell proliferation in intestinal crypt. i. elastic growth without cell loss. J Theor Biol 1: 189–200.
3. Lecuit T, Lenne PF (2007) Cell surface mechanics and the control of cell shape, tissue patterns and morphogenesis. Nature Reviews Molecular Cell Biology 8: 633–644.
4. Tatar M, Bartke A, Antebi A (2003) The endocrine regulation of aging by insulin-like signals. Science 299: 1346–1351.
5. Duester G (2008) Retinoic acid synthesis and signaling during early organogenesis. Cell 134: 921–31.
6. Wang X, Veruki ML, Bukoreshtliev NV, Hartveit E, Gerdes HH (2010) Animal cells connected by nanotubes can be electrically coupled through interposed gap-junction channels. Proc Natl Acad Sci USA 107: 17194–17199.
7. Yaron A, Sprinzak D (2012) The cis side og juxtacrine signaling: a new role in the development of the nervous system. Trends in Neurosciences 45: 230–239. 8. Anklesaria P, Teixido J, Laiho M, Pierce J, Greenberger J, et al. (1990) The cis side og juxtacrine signaling: a new role in the development of the nervous system. Proc Natl Acad Sci USA 87: 3289–93.
9. Gilbert SF (200) Developmental Biology, 6th edition. Sunderland, MA: Sinauer Associates.
10. Barad O, Rosin D, Hornstein E, Barkai N (2010) Error minimization in lateral inhibition circuits. Science Signaling 129: 1–8.
11. Collier JR, Monk NAM, Mainia PK, Lewis JH (1996) Pattern formation by lateral inhibition with feedback: a mathematical model of delta-notch intercellular signalling. Journal of Theoretical Biology 183: 429–446. 12. Tanemura M, Honda H, Yoshida A (1991) Distribution of differentiated cells in
a cell sheet under the lateral inhibition rule of differentiation. J Theor Biol 153: 287–300.
13. Honda H, Tanemura M, Imayama S (1996) Spontaneous architectural organization of mam-malian epidermis from random cell packing. Journal of Investigative Dermatology 106: 312–315.
14. Eglen SJ, Willshaw DJ (2002) Inuence of cell fate mechanisms upon retinal mosaic formation: a modelling study. Development 129: 5399–5408. 15. Honda H, Mochizuki A (2002) Formation and maintenance of distinctive cell
patterns by coexpres-sion of membrane-bound ligands and their receptors. Developmental Dynamics 223: 180–192.
16. Cowin S (2004) Tissue growth and remodeling. Annu Rev Biomed Eng 6: 77– 107.
17. Plahte E (2001) Pattern formation in discrete cell lattices. J Math Biol 43: 411– 445.
18. Martens H, Veingstad S, Plahte E, Martens M, Bertrand D, et al. (2009) BMC Syst Biol 3: 87.
19. Hunziker A, Tuboly C, Horvth P, Krishna S, Semsey S (2010) Genetic exibility of regulatory networks. Proc Natl Acad Sci USA 107: 12998–3003. 20. Jensen M, Krishna S, Pigolotti S (2009) The repressor-lattice: Feedback,
commensurability, and dynamical frustration. Phys Rev Lett 103: 118101. 21. Ihaka R, Gentleman R (1996) R: A language for data analysis and graphics.