Vol.49, n. 2 : pp. 219-224, March 2006
ISSN 1516-8913 Printed in Brazil BRAZILIAN ARCHIVES OF
BIOLOGY AND TECHNOLOGY
A N I N T E R N A T I O N A L J O U R N A L
Stochastic Modeling for a Better Approach of the
in vitro
Observed Growth of Colon Adenocarcinoma Cells
Miguel J. Ruiz-Gómez, Antonio Ruiz-Gómez and Manuel Martínez Morillo∗
Department of Radiology and Physical Medicine; Faculty of Medicine; University of Malaga; Teatinos s/n, 29071; Malaga - Spain
ABSTRACT
The definition of a stochastic model that reflects the cell growth and the use of computer software could be very useful in modelling the cell behaviour due to the possibility to introduce alterations in biology parameters to obtain different growth patterns without the use of laboratory material. Human colon adenocarcinoma cells were cultured and a growth curve was made by daily count of the cell number. Pielou modelling was applied for stochastic simulation of deterministic growth, making stochastic the cell division, the death rates and the transition time between division and death, by using different probabilities. A greater growth was produced when the cell division rate increased, considering the density dependence constant. In contrast, a lower growth was observed when density dependence increased, with a constant value of cell division rate. This type of modelling could be useful to simulate the cell response under different environmental conditions.
Key words: Colon carcinoma; cell growth; stochastic; deterministic; simulation
∗ Author for correspondence
INTRODUCTION
Tumour cells have a finite and predictable proliferative potential in vitro. This limited growth is mainly due to nutrient exhaustion and the limitation of space, which conduce to a gradually increasing fraction of death cells (Rubelj et al., 2000). In addition, the proliferative rate of a cell line cultured in vitro decreases when the population is closed to the plateau phase and the cell number depends on the carrying capacity of the system. The continuous sigmoidal functions such as the empirical Gompertz equation are generally used to obtain the kinetic parameters, specific growth rate and lag phase duration from growth curves (McKellar and Knight, 2000). This continuous observed growth does not reflect what is really happening in the culture along a
continuous time, due to a discrete and punctual observation of the cell culture. Along the time of the culture, from the lag phase to the plateau phase, coexist dividing cells, non dividing cells and death cells that play together an important role in the whole system at each time interval.
gradually conduce to a stable value along the time (Margalef, 1989).
The definition of a stochastic model that reflects the cell growth and the use of computer software could be very useful in teaching cell biology due to the possibility of introducing alterations in biology parameters to obtain different growth patterns without the use of laboratory material. The aim of this work was to apply a stochastic model to the in vitro observed growth of a human colon adenocarcinoma cell line to predict the behaviour of this cell line taking into account all parameters that could alter the growth, considering all of them stochastic.
MATERIALS AND METHODS
Cell culture
Human colon adenocarcinoma cells (HCA) (Morales et al., 1995) were cultured in Dulbecco’s modified Eagle’s medium nutrient mixture F12-HAM (DME/F12-F12-HAM) (with L-glutamine and hepes), supplemented with sodium bicarbonate 7.5 % (28 ml/L), 10 % fetal calf serum and 1 % antibiotic-antimycotic solution 100 X (PSF, Gibco) at 37 °C in a 5 % CO2 gas phase. These cells were subcultured with trypsin (0.05 %) and EDTA (0.02 %) in Dulbecco’s phosphate-buffered saline (PBS) (Hein et al., 1992).
Growth curve
The in vitro growth curve was carried out by daily count of the cell number in 6-multiwell dishes. The number of cells seeded in each well was 25000. The cells count were performed under microscope light by mean of a CCD video camera and automated image analysis software (UTHSCSA Image Tool, version 1.27) in 10 different microscope fields at 100 X magnifications (six replicates each day).
Deterministic modelling
Carrying capacity (K) was calculated from the experimental growth curve and specific growth rate (r) was obtained by linear regression of the logistic deterministic model,
K rN rN dt
dN = − 2
and t r c N N K
Ln − = −
where N = number of cells, t = time and c = constant, Ln = Natural logarithm.
Stochastic modelling
The Pielou modelling (Margalef, 1989) was applied to the stochastic simulation of the in vitro observed growth. Stochastic cell division and cell death rates were considered by the definition of different probabilities of cell surviving and thus cell division or cell death, both density-dependent in the population dynamics.
The mathematical modelling applied was:
) (
)
(a1 b1N N a2 b2N N dt dN + − − =
where r=a1−a2
and
K r b
b1+ 2 = ;
where a1 = cell division rate; a2 = cell death rate and b1; b2 = density dependences.
The probability that the cell population was incremented by one cell division was defined as
2 2 1 2 1 2 1 1 1
)
(
)
(
)
(
Pr
N
b
b
N
a
a
N
b
N
a
N
N
−
−
+
−
=
→
+and in the same way probability was defined that the cell population was decreased in one cell (one cell death): 2 2 1 2 1 2 2 2 1
)
(
)
(
)
(
Pr
N
b
b
N
a
a
N
b
N
a
N
N
−
−
+
+
=
→
−The transition time between events (cell division / cell death) was modelled in a stochastic way by the definition of a new probability factor and the introduction of a random parameter:
where:
Sn
=
(
a
1+
a
2)
N
−
(
b
1−
b
2)
N
2R = random number and Sn = probability that whatever events could be produced.
Developed software
The above-mentioned mathematical models were implemented by computer software. The software assigned name was SimCel 1.0 and was developed for Windows 9x/Me in Borland Delphi 3.0. It was programmed with ActiveX components using the
Multi-Document Interface (MDI) capacity, permitting multiple charts (2D, 3D, lines and bars).
RESULTS AND DISCUSSION
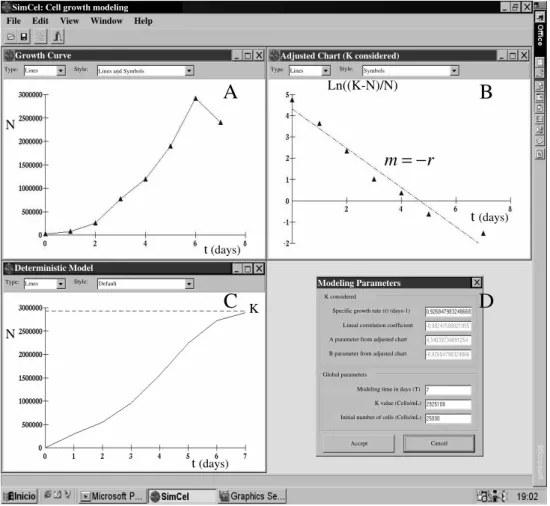
The deterministic model showed an exponential growth similar to that obtained in the experimental growth curve, reaching the carrying capacity (K) without oscillations. The K value obtained was 2,925,108 cells/ml. The specific growth rate (r) was 0.927 days-1, being the correlation coefficient –0.98 (Fig. 1).
Figure 1 - Growth curve, adjusted chart, deterministic model and modeling parameters. A:
Experimental growth curve obtained for colon adenocarcinoma cells. B: The growth curve was made lineal by the expression Ln((K-N)/N) to calculate the specific growth rate (r). C: Deterministic growth curve obtained by the application of the deterministic model. The deterministic model showed a continuous cell growth reaching the carrying capacity (K) without oscillations. D: Information about the values of the parameters used in the deterministic modeling.
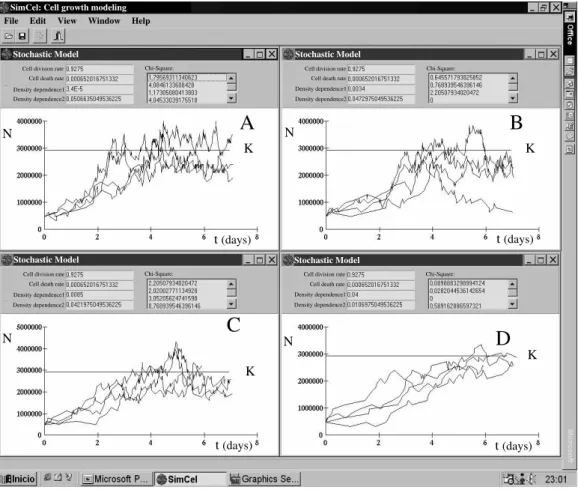
The stochastic model showed different growth curves depending on the values assigned to the cell division rate and the density dependence. Fig. 2
shows different stochastic simulations with different values of cell division rate maintaining the density dependence constant. A higher growth was obtained
t (days) N
t (days)
N
t (days)
Ln((K-N)/N)
K
r
m
=
−
SimCel: Cell growth modelingFile Edit View Window Help
Growth Curve Adjusted Chart (K considered)
Deterministic Model
Modeling Parameters
Type: Lines Style: Lines and Symbols Type: Lines Style: Symbols
Type: Lines Style: Default
Specific growth rate (r) (days-1)
Lineal correlation coefficient
A parameter from adjusted chart
B parameter from adjusted chart K considered
Global parameters
Modeling time in days (T)
K value (Cells/mL)
Initial number of cells (Cells/mL)
Accept Cancel
A
B
when the cell division rate increased. K value reached in less time and the oscillations around it were more. The stochastic simulations became different when the cell division rate was maintained constant, adopting the density dependence different values. A lower growth was obtained when density dependence increased. K value reached at a higher time and the oscillations around it were lower (Fig. 3).
The stochastic simulation makes a better prediction of the behaviour of population dynamics. It takes into account a number of parameters that can contribute to the model in a random manner reflecting the real development of growth,
extinction, senescence, tumour control, apoptosis, etc.
The growth pattern of human colon adenocarcinoma cell line was estimated and modelled considering alterations in cell division rate and density dependence compared to the reference growth curves: the in vitro observed growth curve and the deterministic modelling. The different simulations performed showed growth patterns similar to the reference models. All of them reached the carrying capacity of the system at the K value obtained in vitro and stayed oscillating around it. The different values of cell division rate and density dependence caused alterations in the time of growth and in the oscillation levels.
Figure 2 - Stochastic modeling obtained with different values of cell division rate. In these simulations, the cell division rate adopted different values maintaining the density dependence constant. A: Cell division rate = 0.9275; B: Cell division rate = 0.99; C:
Cell division rate = 1.9; D: Cell division rate = 2.35. A greater growth was obtained when the cell division rate increased. The growth in C and D was higher than the growth in A and B. Carrying capacity (K) was reached at a lower time in C and D and the oscillations around it were greater.
SimCel: Cell growth modeling
File Edit View Window Help
Stochastic Model
Cell division rate
Cell death rate
Density dependence1
Density dependence2
Chi-Square:
N
K
t (days)
Stochastic Model
Cell division rate
Cell death rate
Density dependence1
Density dependence2
K N
Chi-Square:
t (days)
Stochastic Model
Cell division rate
Cell death rate
Density dependence1
Density dependence2
K N
Chi-Square:
t (days)
Stochastic Model
Cell division rate
Cell death rate
Density dependence1
Density dependence2
K N
Chi-Square:
t (days)
A
B
Figure 3 - Stochastic modeling obtained with different values of density dependence. In these simulations, the density dependence adopted different values maintaining the cell division rate constant. A: Density dependence = 0.000034; B: Density dependence = 0.0034; C: Density dependence = 0.0085; D: Density dependence = 0.04. A lower growth was obtained when density dependence increased. The growth in C and D was lower than the growth in A and B. Carrying capacity (K) was reached at a higher time in C and D and the oscillations around it were lower.
The dynamics of this model was influenced by environmental stochasticity and density dependence in the same manner as other biological systems, where an expected change in one parameter strongly affected the dynamics of the population, leading to a non-linear increase in the carrying capacity and in the expected mean population size (Saether et al., 2000). The environmental parameters could represent the introduction of a drug dose, chemical, mutagens, radiation dose, growth factor, and change in temperature, pH, osmolarity or simply the exhaustion of the nutrients.
The results obtained were similar to that reported by
RUBELJ et al. (2000) in the study of the senescence
of human cells in culture. These authors considered the accumulation of non-dividing cells and the cell loss in the culture during its proliferation. In contrast
to our results, they introduced a new parameter: the cellular senescence, which we could not consider in our model due to the tumoral characteristics of our cell line. In addition, other authors have used similar birth-and-death stochastic processes in the same way as in this work, although applied in models for the definition of tumour control probability (Zaider and Minerbo, 2000).
Existing models assume a homogeneous population of cells. Thus, there is a need to develop discrete event models that take into account the behaviour of individual cells. MCKELLAR and KNIGHT (2000) applied a discrete stochastic model to the individual cells of Listeria monocytogenes, and combined with a deterministic population-level growth model. By combining the discrete adaptation step with a continuous growth function it was possible to
SimCel: Cell growth modeling
File Edit View Window Help
Stochastic Model
Cell division rate
Cell death rate
Density dependence1 Density dependence2
Chi-Square:
N
K
t (days)
Stochastic Model
Cell division rate
Cell death rate
Density dependence1
Density dependence2
K N
Chi-Square:
t (days)
Stochastic Model
Cell division rate
Cell death rate
Density dependence1
Density dependence2
K N
Chi-Square:
t (days)
Stochastic Model
Cell division rate
Cell death rate
Density dependence1
Density dependence2
K N
Chi-Square:
t (days)
A
B
C
generate a model that accurately described the transition from lag to exponential phase being a useful tool for describing individual cell behaviour. Thus, it could be possible to design a stochastic model for each biological process that could be influenced or altered by natural or artificial causes. The design of models that could show the behaviour of different cell lines when exposed to radiation or drugs (Kendal, 1998), apoptosis mechanism (Fennell and Cotter, 2000), modelling of angiogenesis or metastases invasion, response of metabolic pathways and cellular damage and repair processes (Cotlet and Blue, 2000) could help in the investigation of these mechanisms.
The stochastic model makes a better prediction of the cell growth behaviour because it takes into account the cell division rate, cell death rate, density dependence, type of event (cell division or cell death) and transition time between them. The introduced randomness could be considered a good approach in the explanation of the experimental deviations. The stochastic simulations could be applied in the prediction of the behaviour of tumour cell lines exposed to antineoplastic agents and radiation, which is an useful tool to study this type of processes where the limitations of laboratory material, due to the high cost of them, is an important handicap.
ACKNOWLEDGEMENTS
The authors thank Ms. L. Gil-Carmona (Radiology Department) for technical assistance and Prof. Dr. E. Nava (ETSI Telecomunicaciones) for help with the automated image analysis software.
REFERENCES
Cotlet, G. and Blue, T. E. (2000), A stochastic model of radiation-induced bone marrow damage. Health Phys., 78, 289-94.
Dushoff, J. (2000), Carrying capacity and demographic stochasticity: scaling behavior of the stochastic logistic model. Theor. Popul. Biol., 57, 59-65. Fennell, D. A. and Cotter, F. E. (2000), Stochastic
modeling of apoptosis tolerance distributions measured by multivariate flow analysis of human leukemia cells. Cytometry, 39, 266-74.
Hein, R.; Landthaler, M.; Haina, D. and Krieg, T. (1992), Laser light of low power density does not influence chemotaxis and collagen synthesis of human dermal fibroblasts. Lasers Med. Sci., 7, 79-83.
Kendal, W. S. (1998), A closed-form description of tumour control with fractionated radiotherapy and repopulation. Int. J. Radiat. Biol., 73, 207-10.
Margalef, R. (1989), Ecología. Barcelona: Omega. McKellar, R. C. and Knight, K. (2000), A combined
discrete-continuous model describing the lag phase of Listeria monocytogenes. Int. J. Food Microbiol., 54, 171-80.
Morales, J. A.; Ruiz-Gómez, M. J.; Gil-Carmona, L.; Souviron, A. and Martínez Morillo, M. (1995), He-Ne laser has no effect on cell cycle phases of human colon adenocarcinoma cells. Rev. Esp. Physiol. (J. Physiol. Biochem.), 51, 43-8.
Rubelj, I.; Huzak, M. and Brdar, B. (2000), Sudden senescence syndrome plays a major role in cell culture proliferation. Mech. Ageing Dev., 112, 233-41. Saether, B.; Tufto, J.; Engen, S.; Jerstad, K.; Rodstad,
O. W. and Skâtan, J. E. (2000), Population dynamical consequences of climate change for a small temperate songbird. Science, 287, 854-6.
Zaider, M. and Minerbo, G. N. (2000), Tumour control probability: a formulation applicable to any temporal protocol of dose delivery. Phys. Med. Biol.,
45, 279-93.