Body Mass Index Is Better than Other
Anthropometric Indices for Identifying
Dyslipidemia in Chinese Children with Obesity
Yanna Zhu1☯, Zixian Shao1☯, Jin Jing1, Jun Ma2, Yajun Chen1, Xiuhong Li1, Wenhan Yang1, Li Guo1, Yu Jin1*
1Department of Maternal and Child Health, School of Public Health, Global Health Institute, Sun Yat-sen University, Guangzhou, China,2Institute of Child and Adolescent Health, School of Public Health, Peking University, Peking, China
☯These authors contributed equally to this work. *jinyu@mail.sysu.edu.cn
Abstract
Background
Body mass index (BMI), waist circumference (WC), and waist-to-hip ratio (WHR) are used in screening and predicting obesity in adults. However, the best identifier of metabolic com-plications in children with obesity remains unclear. This study evaluated lipid profile distribu-tion and investigated the best anthropometric parameter in associadistribu-tion with lipid disorders in children with obesity.
Methods
A total of 2243 school children aged 7–17 years were enrolled in Guangzhou, China, in 2014. The anthropometric indices and lipid profiles were measured. Dyslipidemia was defined according to the US Guidelines for Cardiovascular Health and Risk Reduction in Children and Adolescents. The association between anthropometry (BMI, WC, and WHR) and lipid profile values was examined using chi-square analysis and discriminant function analysis. Information about demography, physical activity, and dietary intake was provided by the participant children and their parents.
Results
Children aged 10–14 and 15–17 years old generally had higher triglyceride values but lower median concentration of total cholesterol, high-density lipoprotein cholesterol, and low-den-sity lipoprotein cholesterol compared with children aged 7–9 years old (allP<0.001). These lipid parameters fluctuated in children aged 10–14 years old. The combination of age groups, BMI, WC and WHR achieved 65.1% accuracy in determining dyslipidemic disor-ders. BMI correctly identified 77% of the total dyslipidemic disorders in obese children, which was higher than that by WHR (70.8%) (P<0.05).
OPEN ACCESS
Citation:Zhu Y, Shao Z, Jing J, Ma J, Chen Y, Li X, et al. (2016) Body Mass Index Is Better than Other Anthropometric Indices for Identifying Dyslipidemia in Chinese Children with Obesity. PLoS ONE 11(3): e0149392. doi:10.1371/journal.pone.0149392
Editor:Jacobus van Wouwe, TNO, NETHERLANDS
Received:July 27, 2015
Accepted:February 1, 2016
Published:March 10, 2016
Copyright:© 2016 Zhu et al. This is an open access article distributed under the terms of theCreative Commons Attribution License, which permits unrestricted use, distribution, and reproduction in any medium, provided the original author and source are credited.
Data Availability Statement:The anonymized, de-identified, minimal data set is within the Supporting Information file.
Conclusion
The distribution of lipid profiles in Chinese children differed between younger and older age groups, and the tendency of these lipid levels remarkably fluctuated during 10 to 14 years old. BMI had better practical utility in identifying dyslipidemia among school-aged children with obesity compared with other anthropometric measures.
Introduction
Childhood obesity is a serious public threat because of its various metabolic complications and related risks of cardiovascular diseases (CVDs), such as dyslipidemia, hypertension, and diabe-tes mellitus, which is already potentially present at an early age [1–3]. Cardiovascular risk factors undergo a slow and sub-clinical evolution and usually include the prevalence of abnormalities in lipid metabolism [4–6]. For example, 3.9% to 9.4% of Chilean children aged 11.4 ± 0.97 years old exhibited a clinical form of dyslipidemia [7]. Likewise, approximately one in every five American youth had an adverse lipid concentration of total cholesterol (TC) or high-density lipoprotein cholesterol (HDL-C) [8]. However, few studies have examined blood lipids levels in children stratified by age and gender in low- and middle-income countries such as China.
Many studies have suggested variations in the ability of body mass index (BMI), waist cir-cumference (WC) and waist-to-hip ratio (WHR) in predicting cardiovascular risk factors in adults, which may differ with ethnicity and age groups [9,10]. Child overweight and obesity are often defined by BMI in both clinical practice and biomedical research instead of WC or WHR. Although BMI remains the most popular obesity measurement tool, its main limitation over WC and WHR is its inability to consider body fat distribution. Given the differences in growth status between children and adults, best anthropometry measure to identify adiposity in chil-dren remains unclear.
This study aimed to evaluate the distribution of serum lipid levels in Chinese children strati-fied by age and gender and to estimate the discriminative abilities of BMI, WC, and WHR in screening the risks of dyslipidemia in children with obesity.
Material and Method
Design and Study Subjects
The study was a series of cross-sectional health and nutrition surveys conducted by student con-stitution and local authorities to provide representative prevalence data of the health conditions of children in Guangzhou, China. The study population finally comprised 2243 children aged 7–17 years old who were randomly selected from elementary and middle schools in Guangzhou City in 2014. All children were asked to complete questionnaires, including information on physical activities and dietary intake, with parents completing the demographic information (birth weight, delivery mode, household income, etc.). Participants who refused to finish the questionnaires or did not have complete anthropometric and demographic data were excluded from this analysis (n = 157). Study protocols were approved by the Ethical Committee of the Peking University. All children and their parents voluntarily signed the informed consents.
Questionnaire Assessment
The self-reported questionnaires were created based on previously tested and validated questions, including questions of demographics, physical activities (vigorous-intensity activities,
moderate-Guangdong Provincial Natural Science Foundation, Award Number 2015A030313175 (Recipient: Yanna Zhu).
intensity activities, walking and sedentary behavior), and dietary intake (breakfast, sugary drinks, fruit, vegetable, and meat). The participant were asked the following five questions regarding physical activities:“How many days and how often per day did you go on vigorous-intensity activities (running, basketball, football, bodybuilding exercises, etc.), moderate-intensity activities (table tennis, moving something light, dancing, etc.) and walking in the last seven days?”The average outdoor duration per day in the last week was classified into four categories (<1.0, 1–2,
2–4 and>4 h/day). Children were also asked the following:“How many hours did you spend in
sedentary behavior (sitting or lying still at school and home, not including sleeping) in the last seven days?”To determine their dietary intake of vegetable, meat, fruit and breakfast, children were asked the following:“How many days did you have breakfast last week and how many serv-ings of each dietary intake did you have last week?”and“How many cups of sugary drinks did you have last week?”One serving of sugar-sweetened beverage was 250 mL.
Anthropometric Measurements
The anthropometric measurements, including height, weight, hip circumference (HC), WC and blood pressure, of all participants were measured by experienced technicians [11]. Body weight was measured using a scale to the nearest 0.1 kg (Hengxing RGT-140, Jiangsu, PRC), and standing height was measured to the nearest 0.1 cm using a fixed stadiometer (Yilian TZG, Jiangsu, PRC). WC and HC were also measured to the nearest 0.1 cm. BMI and WHR were then calculated. The systolic and diastolic blood pressures of children were measured after 5 min in a seated position using a sphygmomanometer (Yutu XJ1ID, Shanghai, PRC).
Laboratory Analysis
Venous blood samples were collected from children following an overnight fast for 12 h. Serum was separated by centrifugation at 1500×g for 15 min at 4°C within 2 h and stored at
−80°C until testing. Serum levels of triglycerides (TG), low-density lipoprotein cholesterol
(LDL-C), TC and HDL-C were examined using commercial colorimetric kits (Biosino Biotech-nology Company Ltd, Beijing, China) and an automated analyzer (Hitachi Co Ltd) in accor-dance with previous document [12]. The inter- and intra- assay coefficients of variation for all measured lipid parameters were less than 5%.
Definition of Abnormal Lipid Levels and Obesity
The 2011 reference data on serum levels of lipids for children according to the US Guidelines for Cardiovascular Health and Risk Reduction in Children and Adolescents were used to esti-mate whether the lipid indicators of each child were at a normal stage [13]. However, TG was divided in two definitions based on age. Therefore, the highest borderline TG values for ages 0–9 and 10–19 year old (>99 and>129 mg/dL, respectively) were used in this assay in both
sexes. In accordance with the guideline of the Working Group on Obesity in China, children with<85th percentile BMI for age were considered as normal weight, those with85th but
<95th percentile BMI were considered overweight, and those with95th percentile BMI were considered obese [14]. Subjects with95th percentile of WC based on Chinese population percentiles were classified as having abdominal obesity [15]. Male children with WHR of0.90 and female children with WHR of0.85 were classified as obese [16].
Statistical Analysis
and age groups were determined using Student’st-test and analysis of variance (ANOVA).
Discriminant function analysis was performed stepwise to test the ability of independent var-iables (BMI, WC, WHR, age groups, birth weight, physical activities, and dietary intake) in predicting dyslipidemia or non-dyslipidemia. Sensitivity and specificity were also calculated. The categorical variables (delivery mode, household income, and breakfast) were described in both genders by the proportion of participants falling into each category and were evalu-ated using Chi-square analysis. This type of analysis was also used to compare the proportion of obese children with each item of dyslipidemia in different anthropometric groups. AP
value of<0.05 was considered significant.
Results
Baseline Characteristics of Study Population
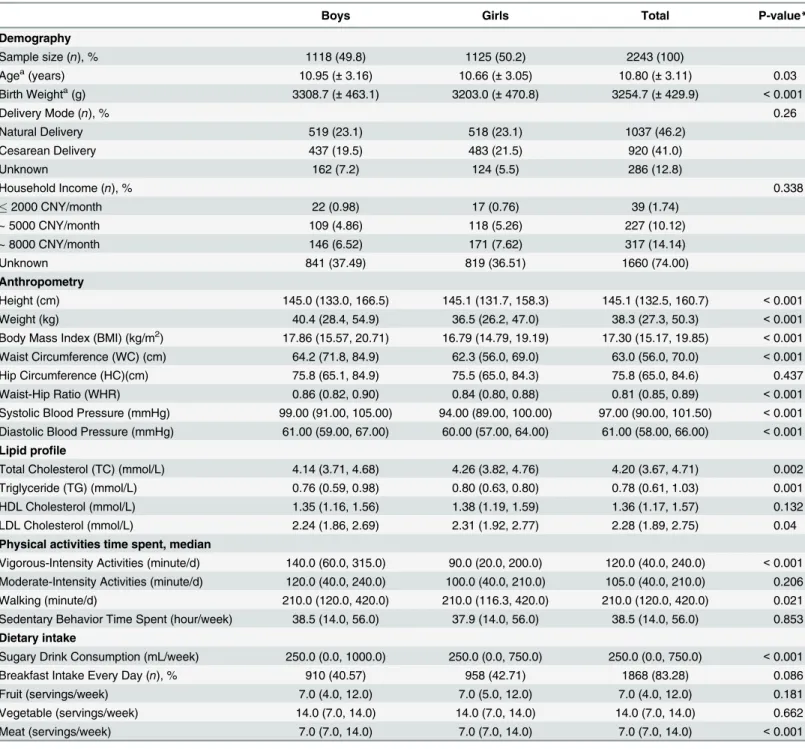
A total of 2243 children with age ranging from 7 to 17 years old were enrolled in this study. The characteristics of the study population, such as demography, lipid profiles, anthropometry, physical activities, and dietary intake, were summarized inTable 1. In terms of lipid profile, boys had significantly lower median concentration of TC, TG, and LDL-C compared with girls (P<0.05). Boys presented higher values of birth weight and anthropometry than girls
(P<0.001), except for HC (P= 0.437). After comparing the duration of different intensity
activities, only vigorous-intensity activities and walking behavior reached a statistical signifi-cance between two genders, withP<0.001 andP= 0.021, respectively. In addition,
consump-tion of sugary drinks and meat was higher in boys than in girls (P<0.001). Other factors in
this study did not significantly differed between boys and girls.
Distribution of Lipid Profile in Children Stratified by Sex and Age
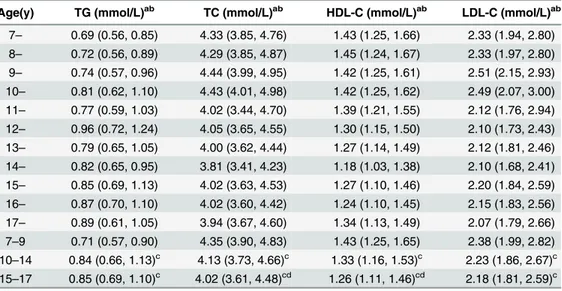
As shown inTable 2, the distribution of serum lipids of the sample substantially varied and all indicators demonstrated markedly significant differences among ages based on ANOVA method (allP<0.001). To further analyze the influence of age groups on lipid profiles, we
divided ages into three groups: 7–9, 10–14 and 15–17 year old. We then found that compared with children aged 7–9 years old, the two older age groups tended to have lower median con-centration of TC, HDL-C, and LDL-C and higher TG (P<0.05).
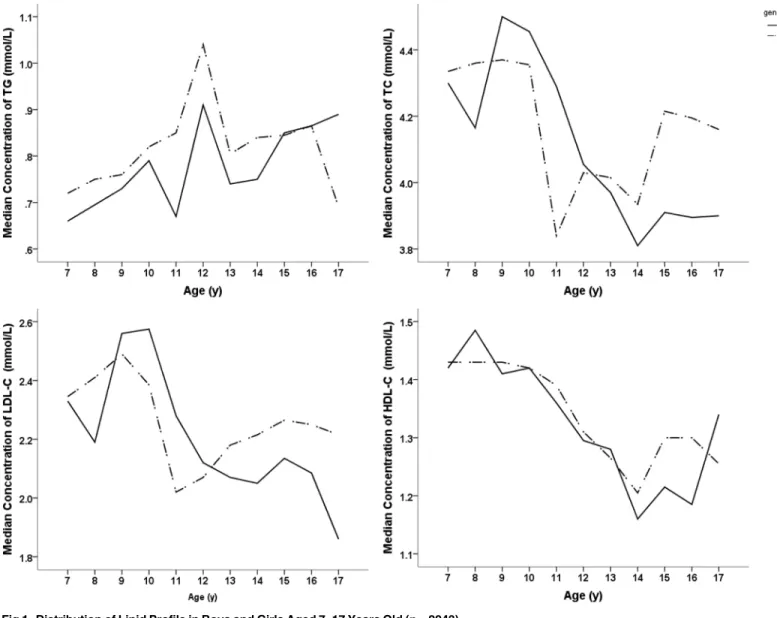
We further explored each lipid profile item to evaluate whether the trends observed in the total lipid profile were generalized by sex (Fig 1). In children aged 10–14 years old, the TC, HDL-C, and LDL-C levels decreased with the increase in ages in both genders and declined to a valley at 14 years (Fig 1B, 1C and 1D). The tendency of TG fluctuated intensively from 10 to 14 years old and reached a peak level at 12 years old (Fig 1A).
Variables to Predict Dyslipidemia in Children Determined by
Discriminant Function Analysis
Percentage of Dyslipidemia in Children with Obesity as Defined by BMI,
WC and WHR
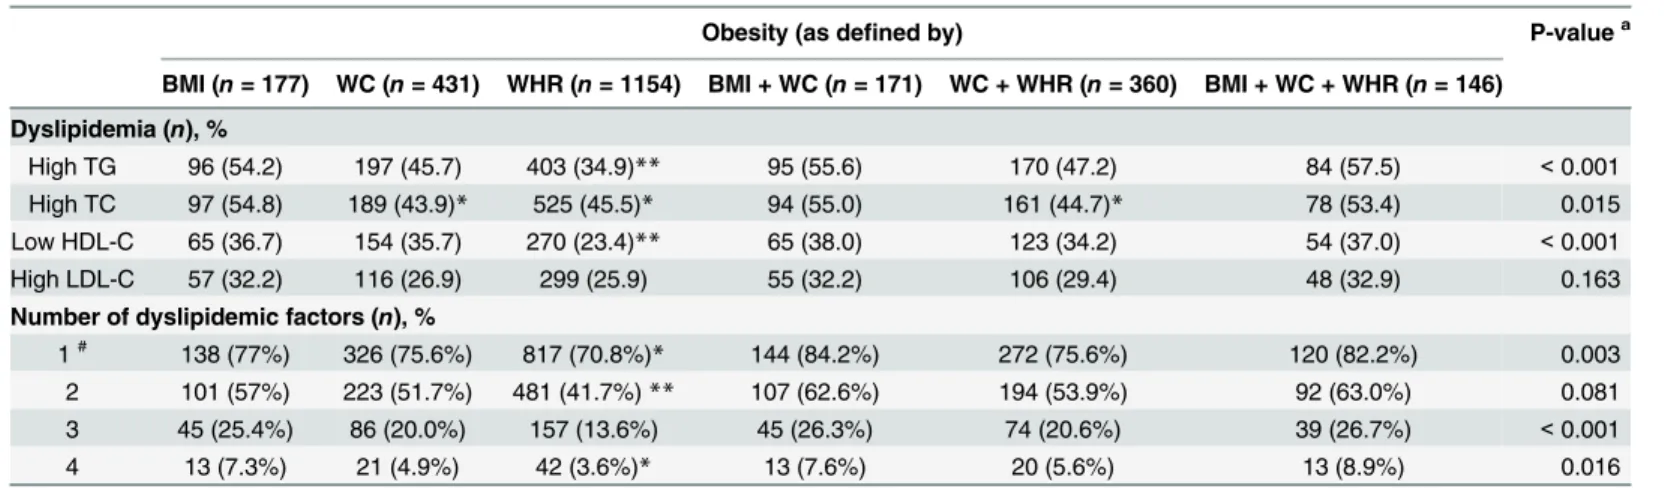
The proportion of children with dyslipidemia was shown inTable 4. Based on the established cut-off points, the proportion of high TG and LDL-C in obese children group defined by the
Table 1. Descriptive Characteristics of Children Ranging from 7 to 17 Years Old in Guangzhou, 2014 (n= 2243).
Boys Girls Total P-value*
Demography
Sample size (n), % 1118 (49.8) 1125 (50.2) 2243 (100)
Agea(years) 10.95 (±3.16) 10.66 (±3.05) 10.80 (±3.11) 0.03
Birth Weighta(g) 3308.7 (±463.1) 3203.0 (±470.8) 3254.7 (±429.9) <0.001
Delivery Mode (n), % 0.26
Natural Delivery 519 (23.1) 518 (23.1) 1037 (46.2)
Cesarean Delivery 437 (19.5) 483 (21.5) 920 (41.0)
Unknown 162 (7.2) 124 (5.5) 286 (12.8)
Household Income (n), % 0.338
2000 CNY/month 22 (0.98) 17 (0.76) 39 (1.74)
~ 5000 CNY/month 109 (4.86) 118 (5.26) 227 (10.12)
~ 8000 CNY/month 146 (6.52) 171 (7.62) 317 (14.14)
Unknown 841 (37.49) 819 (36.51) 1660 (74.00)
Anthropometry
Height (cm) 145.0 (133.0, 166.5) 145.1 (131.7, 158.3) 145.1 (132.5, 160.7) <0.001
Weight (kg) 40.4 (28.4, 54.9) 36.5 (26.2, 47.0) 38.3 (27.3, 50.3) <0.001
Body Mass Index (BMI) (kg/m2) 17.86 (15.57, 20.71) 16.79 (14.79, 19.19) 17.30 (15.17, 19.85) <0.001
Waist Circumference (WC) (cm) 64.2 (71.8, 84.9) 62.3 (56.0, 69.0) 63.0 (56.0, 70.0) <0.001
Hip Circumference (HC)(cm) 75.8 (65.1, 84.9) 75.5 (65.0, 84.3) 75.8 (65.0, 84.6) 0.437
Waist-Hip Ratio (WHR) 0.86 (0.82, 0.90) 0.84 (0.80, 0.88) 0.81 (0.85, 0.89) <0.001
Systolic Blood Pressure (mmHg) 99.00 (91.00, 105.00) 94.00 (89.00, 100.00) 97.00 (90.00, 101.50) <0.001
Diastolic Blood Pressure (mmHg) 61.00 (59.00, 67.00) 60.00 (57.00, 64.00) 61.00 (58.00, 66.00) <0.001 Lipid profile
Total Cholesterol (TC) (mmol/L) 4.14 (3.71, 4.68) 4.26 (3.82, 4.76) 4.20 (3.67, 4.71) 0.002
Triglyceride (TG) (mmol/L) 0.76 (0.59, 0.98) 0.80 (0.63, 0.80) 0.78 (0.61, 1.03) 0.001
HDL Cholesterol (mmol/L) 1.35 (1.16, 1.56) 1.38 (1.19, 1.59) 1.36 (1.17, 1.57) 0.132
LDL Cholesterol (mmol/L) 2.24 (1.86, 2.69) 2.31 (1.92, 2.77) 2.28 (1.89, 2.75) 0.04
Physical activities time spent, median
Vigorous-Intensity Activities (minute/d) 140.0 (60.0, 315.0) 90.0 (20.0, 200.0) 120.0 (40.0, 240.0) <0.001
Moderate-Intensity Activities (minute/d) 120.0 (40.0, 240.0) 100.0 (40.0, 210.0) 105.0 (40.0, 210.0) 0.206
Walking (minute/d) 210.0 (120.0, 420.0) 210.0 (116.3, 420.0) 210.0 (120.0, 420.0) 0.021
Sedentary Behavior Time Spent (hour/week) 38.5 (14.0, 56.0) 37.9 (14.0, 56.0) 38.5 (14.0, 56.0) 0.853 Dietary intake
Sugary Drink Consumption (mL/week) 250.0 (0.0, 1000.0) 250.0 (0.0, 750.0) 250.0 (0.0, 750.0) <0.001
Breakfast Intake Every Day (n), % 910 (40.57) 958 (42.71) 1868 (83.28) 0.086
Fruit (servings/week) 7.0 (4.0, 12.0) 7.0 (5.0, 12.0) 7.0 (4.0, 12.0) 0.181
Vegetable (servings/week) 14.0 (7.0, 14.0) 14.0 (7.0, 14.0) 14.0 (7.0, 14.0) 0.662
Meat (servings/week) 7.0 (7.0, 14.0) 7.0 (7.0, 14.0) 7.0 (7.0, 14.0) <0.001
aMean (±standard deviation) presented
Median (Interquartile range) presented unless otherwise stated. HDL, high-density lipoprotein; LDL, low-density lipoprotein
*P-value was calculated using chi-square test for categorical variable and two independent samplest-test for continuous variable between genders.
combination of BMI, WC, and WHR was higher than those in other groups (P<0.001), whereas
the combination of BMI and WC had the highest proportion of high TC and low HDL-C (P<0.05). After evaluating the number of dyslipidemic disorders, over 70.8% of obese subjects
had at least one risk factor (high TG, high TC, high LDL-C, or low HDL-C). Among obese chil-dren, the percentage of having all four cardiovascular risk factors was between 3.6% and 8.9% by all six measures of obesity, with the highest proportion for those defined by the combination of BMI, WC, and WHR. In addition, the percentage for dyslipidemic disorders in children with obe-sity was higher as defined by BMI (77%) than that as defined by WHR (70.8%), withP<0.05.
Discussion
With the rapidly increasing prevalence of obesity among children in recent years, a great inter-est has been given in exploring the relationship between bodily stoutness and blood lipids in children [1,2]. BMI, WC, and WHR were often used to define obesity. However, whether these anthropometric parameters can be used to identify obesity-related complications has not been thoroughly examined. The present study found that the distribution of serum lipid levels in younger groups (aged 7–9 years old) was significantly different from those in other two older age groups (10–14 and 15–17 year old) among Chinese children. Furthermore, the tendency of these lipid parameters remarkably fluctuated in children aged 10–14 years old. Four variables were selected (age groups, BMI, WC, and WHR) via stepwise discriminant procedure and pro-duced 65.1% accuracy in dyslipidemia determination. BMI was better in predicting dyslipide-mia in children with obesity compared with WC and WHR.
Table 2. Median Concentration (IQR) of the Lipid Profile among Children Aged 7–17 Years in This
Study (n= 2243).
Age(y) TG (mmol/L)ab TC (mmol/L)ab HDL-C (mmol/L)ab LDL-C (mmol/L)ab
7– 0.69 (0.56, 0.85) 4.33 (3.85, 4.76) 1.43 (1.25, 1.66) 2.33 (1.94, 2.80)
8– 0.72 (0.56, 0.89) 4.29 (3.85, 4.87) 1.45 (1.24, 1.67) 2.33 (1.97, 2.80)
9– 0.74 (0.57, 0.96) 4.44 (3.99, 4.95) 1.42 (1.25, 1.61) 2.51 (2.15, 2.93)
10– 0.81 (0.62, 1.10) 4.43 (4.01, 4.98) 1.42 (1.25, 1.62) 2.49 (2.07, 3.00)
11– 0.77 (0.59, 1.03) 4.02 (3.44, 4.70) 1.39 (1.21, 1.55) 2.12 (1.76, 2.94)
12– 0.96 (0.72, 1.24) 4.05 (3.65, 4.55) 1.30 (1.15, 1.50) 2.10 (1.73, 2.43)
13– 0.79 (0.65, 1.05) 4.00 (3.62, 4.44) 1.27 (1.14, 1.49) 2.12 (1.81, 2.46)
14– 0.82 (0.65, 0.95) 3.81 (3.41, 4.23) 1.18 (1.03, 1.38) 2.10 (1.68, 2.41)
15– 0.85 (0.69, 1.13) 4.02 (3.63, 4.53) 1.27 (1.10, 1.46) 2.20 (1.84, 2.59)
16– 0.87 (0.70, 1.10) 4.02 (3.60, 4.42) 1.24 (1.10, 1.45) 2.15 (1.83, 2.56)
17– 0.89 (0.61, 1.05) 3.94 (3.67, 4.60) 1.34 (1.13, 1.49) 2.07 (1.79, 2.66)
7–9 0.71 (0.57, 0.90) 4.35 (3.90, 4.83) 1.43 (1.25, 1.65) 2.38 (1.99, 2.82)
10–14 0.84 (0.66, 1.13)c 4.13 (3.73, 4.66)c 1.33 (1.16, 1.53)c 2.23 (1.86, 2.67)c
15–17 0.85 (0.69, 1.10)c 4.02 (3.61, 4.48)cd 1.26 (1.11, 1.46)cd 2.18 (1.81, 2.59)c
HDL-C, high-density lipoprotein cholesterol; LDL-C, low-density lipoprotein cholesterol; TC, total cholesterol; TG, triglyceride. Median (interquartile range) presented unless otherwise stated. aSigni
ficant levels by ANOVA among ages. bSigni
ficant levels by ANOVA among three age groups. c
Significant differences between age groups usingt-test analysis (7–9-year old group as reference
category). dSigni
ficant differences between age groups usingt-test analysis (10–14-year old group as reference
category).
Yipet al. demonstrated that lipid levels, such as TC, LDL-C, HDL-C, and apo B, showed
gender-related differences among 525 subjects in early school and adolescent ages [17]. These results are consistent with the present finding that boys have significantly lower median con-centration of TC, TG, and LDL-C than girls. In addition, we found that a sharp decrease in TC,
Fig 1. Distribution of Lipid Profile in Boys and Girls Aged 7–17 Years Old (n= 2243).
doi:10.1371/journal.pone.0149392.g001
Table 3. Results of Discriminant Function Analysis for Classifying Dyslipidemia among Children (n= 2243).
Variables Standardized Discriminant Function Coefficients Accuracy Sensitivity Specificity
Age groups (y) 0.445 53.6% 56.3% 47.5%
BMI (kg/m2) 0.484 67.9% 85.0% 28.8%
WC (cm) 0.396 67.2% 84.3% 28.2%
WHR 0.397 54.0% 51.8% 58.9%
Formula: Z = 0.445 age groups (y) +0.484 BMI (kg/m2) + 0.396 WC (cm) +0.397 WHR BMI, body mass index; WHR, waist to hip ratio; WC, waist circumference.
HDL-C, and LDL-C, whereas the tendency of TG intensively fluctuated during 10–14 years. The fluctuation in TG in children aged 10–14 years may be attributed to their transitioning from pre-pubertal to pubertal status. Previous studies among school-aged children proposed that the significant reductions in the levels of lipid profiles were associated with the hormones produced during puberty [18,19]. However, a retrospective analysis reported that no differ-ences in lipids were found in 43 girls treated with gonadotropin-releasing hormone analog for at least 2 years compared with those untreated during 3-year follow-up [20]. Together with other research groups, we speculate that the girls had a relatively protective tendency when they entered the puberty years [21]. The role of hormone on levels of lipid profiles during puberty may depend, to some extent, on the duration of observation and the study population. Thus, the relationship between lipids and hormonal levels needs to be further explored in a larger population-based longitudinal study, which can be useful in tracking changes in lipids during the maturation process.
As reported previously, children with overweight and obesity are more likely to experience dyslipidemia and related CVD risk [22–26]. A case-control study observed that children with obesity aged 7–10 years old defined by BMI had 2.17 times greater risks of high TC and hyper-tension than non-obese children [23]. Another study reported that obesity, rather than being overweight, was more positively correlated with adverse alterations in the lipid profiles in chil-dren [25]. Some previous studies have showed that BMI, WC, and WHR were independent predictors of cardiovascular risk factors, such as in predicting dyslipidemia [9,27]. However, a recent study conducted in children and adolescents demonstrates that WC and WHR are prac-tical measures of abdominal fat mass and are related to increased muscle or distribution of excess fat in the body [28]. Therefore, measures of adiposity need to be further examined to determine the ability of these measures to identify children at the risk of dyslipidemia. To eluci-date this point, the present study confirmed that BMI, instead of WC or WHR, produced a bet-ter role in correctly classifying children into dyslipidemia or non-dyslipidemia groups by using stepwise disciminant analysis.
Table 4. Proportion of Lipid Disorders in Children Defined by BMI, WC, and WHR (n= 2243).
Obesity (as defined by) P-valuea
BMI (n= 177) WC (n= 431) WHR (n= 1154) BMI + WC (n= 171) WC + WHR (n= 360) BMI + WC + WHR (n= 146)
Dyslipidemia (n), %
High TG 96 (54.2) 197 (45.7) 403 (34.9)** 95 (55.6) 170 (47.2) 84 (57.5) <0.001
High TC 97 (54.8) 189 (43.9)* 525 (45.5)* 94 (55.0) 161 (44.7)* 78 (53.4) 0.015
Low HDL-C 65 (36.7) 154 (35.7) 270 (23.4)** 65 (38.0) 123 (34.2) 54 (37.0) <0.001
High LDL-C 57 (32.2) 116 (26.9) 299 (25.9) 55 (32.2) 106 (29.4) 48 (32.9) 0.163
Number of dyslipidemic factors (n), %
1# 138 (77%) 326 (75.6%) 817 (70.8%)* 144 (84.2%) 272 (75.6%) 120 (82.2%) 0.003
2 101 (57%) 223 (51.7%) 481 (41.7%)** 107 (62.6%) 194 (53.9%) 92 (63.0%) 0.081
3 45 (25.4%) 86 (20.0%) 157 (13.6%) 45 (26.3%) 74 (20.6%) 39 (26.7%) <0.001
4 13 (7.3%) 21 (4.9%) 42 (3.6%)* 13 (7.6%) 20 (5.6%) 13 (8.9%) 0.016
HDL-C, high-density lipoprotein cholesterol; LDL-C, low-density lipoprotein cholesterol; TC, total cholesterol; TG, triglyceride; BMI, body mass index; WHR, waist to hip ratio; WC, waist circumference.
*p<0.05 level **p<0.01 level
#The proportion of children with obesity who had at least one risk factor of dyslipidemia (high TG, high TC, high LDL-C, or low HDL-C). aP-value was calculated using chi-square test for category variables. These tests were done to compare among all groups.
Furthermore, this study conducted among Chinese children showed that a combination of BMI, WC, and WHR yielded the highest proportion for those with one of the lipid disorders. Adiposity greatly contributed to adverse HDL-C and TG levels, which can be explained by vis-ceral fat accumulation and excess liver exposure to fatty acids [29]. Although more children were identified with at least one dyslipidemic risk factors using the combination of obesity indi-ces (BMI, WC, and WHR) than BMI alone, no statistical significance was found between these two anthropometric groups. In additon, measures of central adiposity (WC and/or WHR) appeared to identify dyslipidemia in older individuals [10]. In accordance with the previous study, WC and WHR were similarly performed after adjustment for age [30]. The present study proposed that BMI may be a better and appropriate risk predictor of dyslipidemia in Chi-nese children than other anthropometric indices.
Strengths and Limitations
This study had several strengths. First, a cluster of potential risk factors, such as birth weight, physical activities, and dietary intake, were considered when exploring the relationship between BMI and CVD. Second, this study involved a wide rang of ages from 7 to 17 years to observe the secular trend of lipid profile. We found that lipid levels tended to remarkably fluc-tuate in children aged 10–14 years old. Therefore, the participants were divided into three age groups to further explore the relationship between anthropometric parameters and lipid profile values. However, this study also had limitations. A cross-sectional design was applied in this study, which cannot infer the causality of the relationships observed. Moreover, we were unable to conclude on the role of pubertal timing on the variations in serum lipids in this age group, as pubertal stage was not assessed in this population
Conclusion
We found different distributions of serum lipid levels among three age groups (7–9, 10–14, and 15–17 years old) in Chinese children and found significant fluctuations among these lipid parameters in children aged 10–14 years old. This study proved that BMI can be used as a sim-ple and non-invasive method in predicting dyslipidemia in Chinese school-aged children with obesity compared with other anthropometric indices.
Supporting Information
S1 Dataset. Dataset of Body Mass Index Is Better than Other Anthropometric Indices for Identifying Dyslipidemia in Chinese Children with Obesity.
(XLS)
Acknowledgments
The authors would like to acknowledge the children, their families and all the team involved in the study (fellows students, nurses, and technicians).
Author Contributions
References
1. Matikainen N, Taskinen MR. Management of dyslipidemias in the presence of the metabolic syndrome or type 2 diabetes. Curr Cardiol Rep. 2012; 14(6): 721–31. doi:10.1007/s11886-012-0309-3PMID:
22941588
2. Al-Okbi SY, Mohamed DA, Hamed TE, Edris AE. Protective effect of clove oil and eugenol microemul-sions on fatty liver and dyslipidemia as components of metabolic syndrome. J Med Food. 2014; 17(7): 764–7. doi:10.1089/jmf.2013.0033PMID:24611461
3. Dietz WH. Health consequences of obesity in youth: childhood predictors of adult disease. Pediatrics. 1998; 101: 518–525. PMID:12224658
4. Freedman S, Dietz H, Srinivasan R, Berenson S. Risk factors and adult body mass index among over-weight children. Pediatrics. 2009; 123(3): 750–757. doi:10.1542/peds.2008-1284PMID:19254998
5. Freedman D, Patel D, Srinivasan S, et al. The contribution of childhood obesity to adult carotid intima-media thickness. International Journal of Obesity. 2008; 32(5): 749–756. doi:10.1038/sj.ijo.0803798
PMID:18227845
6. Chen X, Wang Y. Tracking of blood pressure from childhood to adulthood: a systematic review and meta-regression analysis. Circulation. 2008; 117(25): 3171–3180. doi:10.1161/CIRCULATIONAHA.
107.730366PMID:18559702
7. Barja Yáñez S, Arnaiz Gómez P, Villarroel Del Pino L, Domínguez de Landa A, Castillo Valenzuela O, Farías Jofré M, et al. Dyslipidemia in school-age Chilean children: prevalence and associated factors. Nutr Hosp. 2015; 31(5): 2079–87. doi:10.3305/nh.2015.31.5.8672PMID:25929377
8. Kit BK, Kuklina E, Carroll MD, Ostchega Y, Freedman DS, Ogden CL. Prevalence of and trends in dysli-pidemia and blood pressure among US children and adolescents, 1999–2012. JAMA Pediatr. 2015;
169(3): 272–9. doi:10.1001/jamapediatrics.2014.3216PMID:25599372
9. Camhi SM, Bray GA, Bouchard C, Greenway FL, Johnson WD, Newton RL, et al. The relationship of waist circumference and BMI to visceral, subcutaneous, and total body fat: sex and race differences. Obesity 2011; 19:402–8. doi:10.1038/oby.2010.248PMID:20948514
10. Cheng CH, Ho CC, Yang CF, Huang YC, Lai CH, Liaw YP. Waist-to-hip ratio is a better anthropometric index than body mass index for predicting the risk of type 2 diabetes in Taiwanese population. Nutr Res 2010; 30:585–93. doi:10.1016/j.nutres.2010.08.007PMID:20934599
11. Jennings A, Cassidy A, van Sluijs EM, Griffin SJ, Welch AA. Associations between eating frequency, adiposity, diet, and activity in 9–10 year old healthy-weight and centrally obese children. Obesity. 2012
Jul; 20(7):1462–8. doi:10.1038/oby.2012.72PMID:22436840
12. Zhu Y, Huang X, Zhang Y, Wang Y, Liu Y, Sun R, et al. Anthocyanin supplementation improves HDL-associated paraoxonase 1 activity and enhances cholesterol efflux capacity in subjects with hypercho-lesterolemia.J Clin Endocrinol Metab. 2014, Feb; 99(2):561–9. doi:10.1210/jc.2013-2845PMID:
24285687
13. Expert panel on integrated guidelines for cardiovascular health and risk reduction in children and ado-lescents: summary report. Pediatrics. 2011; 128 (5): S213–S256.
14. Working Group on obesity in China (WGOC). Body mass index cut-offs for overweight and obesity in Chinese children and adolescents. Zhonghua Liu Xing Bing Xue Za Zhi. 2004, 25:97–102.
15. Ji CY, Yt SR, Ma G, Ma J, He ZH and Chen TJ. Waist circumference distribution of Chinese school-age children and adolescents. Biomed Environ Sci. 2010 Feb; 23(1):12–20. PMID:20486431
16. Joint Committee for Developing Chinese guidelines on Prevention and Treatment of Dyslipidemia in Adults. Zhonghua Xin Xue Guan Bing Za Zhi 2007, 35:390–419. PMID:17711682
17. Yip PM, Chan MK, Nelken J, Lepage N, Brotea G, Adeli K. Pediatric referenc interval for lipids and apo-lipoproteins on the VITRO 5,1 FS Chemistry System. Clin Biochem. 2006 Oct; 39(10)978–83. PMID:
16962571
18. Mascarenhas LP, Leite N, Titski AC, Brito LM, Boguszewski MC. Variability of lipid and lipoprotein con-centrations during puberty in Brazilian boys. J Pediatr Endocrinol Metab. 2015; 28 (1–2): 125–31. doi:
10.1515/jpem-2013-0450PMID:25153571
19. Pierce MB, Kuh D, Hardy R. Role of lifetime body mass index in the association between age at puberty and adult lipids: findings from men and women in a British birth cohort. Ann Epidemiol. 2010; 20: 676–
682. doi:10.1016/j.annepidem.2010.05.015PMID:20696407
20. Colmenares A, Gunczler P, Lanes R. Higher prevalence of obesity and overweight without an adverse metabolic profile in girls with central precociouspuberty compared to girls with early puberty, regardless of GnRH analogue treatment. Int J Pediatr Endocrinol. 2014(1: ):5. doi:10.1186/1687-9856-2014-5
21. Zhu J, Liang L, Fu J, Gong C, Xiong F, Liu G, et al. Survey on the levels of lipids in school-aged children of Beijing, Tianjin, Hangzhou, Shanghai, Chongqing and Nanning cities. Zhonghua Liu Xing Bing Xue Za Zhi. 2012; 33(10): 1005–9. PMID:23290840
22. Luciana N, Joel A, Sylvia D. Sociodemographic, anthropometric and dietary determinants of dyslipide-mia in preschoolers. J Pediatr. 2013; 89(5): 462–469
23. Coronelli CL, de Moura EC. Hypercholesterolemia and its risk factors among school children. Rev Saude Publica. 2003; 37: 24–31 PMID:12488917
24. Alcantara Neto OD, Silva RC, Assis AM, Pinto E de J. Factors associated with dyslipidemia in children and adolescents enrolled in public schools of Salvador, Bahia. Rev Bras Epidemiol. 2012; 15: 335–45.
PMID:22782099
25. Ribas SA, Santana da Silva LC. Anthropometric indices: predictors of dyslipidemia in children and ado-lescents from north of Brazil. Nutr Hosp. 2012 Jul-Aug; 27(4):1228–35 doi:10.3305/nh.2012.27.4.
5798PMID:23165566
26. Freedman DS, Dietz WH, Srinivasan SR, Berenson GS. The relation of overweight to cardiovascular risk factors among childrenb and adolescents: the Bogalusa Heart Study. Pediatrics.1999; 103: 1175–
82. PMID:10353925
27. Lam BC, Koh GC, Chen C, Wong MT, Fallows SJ. Comparison of body mass index (BMI), body adipos-ity index (BAI), waist circumference (WC), waist-to-hip ratio (WHR) and waist- to-height ratio (WHtR) as predictors of cardiovascular disease risk factors in an adult population in Singapore. PLoS One. 2015; 10(4): e0122985. doi:10.1371/journal.pone.0122985PMID:25880905
28. Burgos MS, Burgos LT, Camargo MD, Franke SI, Prá D, Silva AM, et al. Relationship between anthro-pometric measures and cardiovascular risk factors in children and adolescents. Arq Bras Cardiol. 2013 Oct; 101(4):288–96 doi:10.5935/abc.20130169PMID:23979777
29. Despres JP, Lemieux S, Lamarche B, Prud'homme D, Moorjani S, Brun LD, et al. The insulin resis-tance-dyslipidemic syndrome: contribution of visceral obesity and therapeutic implications. Int J Obes Relat Metab Disord. 1995; 1: 76–86