SUMMARY
Objective: To verify the prevalence of obesity and hypertension in schoolchildren from Santa Cruz do Sul – RS, Brazil, in 2005 and 2008. Method: he study was performed with two consecutive cross-sectional measurements, consisting of a stratiied cluster sample, totaling 414 students, aged between 7 and 17 years, of which 215 (51.9%) were males and 199 (48.1%) were females. Obesity was assessed by body mass index (BMI) and per-centage of body fat (%BF). Hypertension was measured by blood pressure values , both systolic (SBP) and diastolic (DBP). Results: BMI assessment showed 18.6% and 22.3% of excess weight in males and 22.6% and 14.6% in females (in 2005 and 2008, respec-tively). Regarding obesity, the prevalence was 4.7% in both years for males and a reduc-tion from 12.6% to 9.0% was observed in females. When analyzing the diference be-tween assessments, there was signiicance in the BMI classiication (p = 0.022) and %BF (p = 0.017) only in females. Statistically signiicant changes in SBP were found only in males (p < 0.001). Conclusion: he levels of excess weight, obesity, and %BF in females, as well as the increased levels of systolic blood pressure in males, demonstrate the need for early intervention through more efective public health campaigns.
Keywords: Obesity; hypertension; public health; child; teenager.
©2012 Elsevier Editora Ltda. All rights reserved.
Study conducted at Universidade de Santa Cruz do Sul, Santa Cruz do Sul, RS, Brazil
Submitted on: 01/10/2012
Approved on: 08/23/2012
Correspondence to:
Cézane Priscila Reuter Rua Ernesto Carlos Iserhard, 537 Santa Cruz do Sul, RS, Brazil CEP: 96825-040 [email protected]
Conlict of interest: None.
Obesity and arterial hypertension in schoolchildren from Santa Cruz
do Sul – RS, Brazil
ÉBONI MARÍLIA REUTER1, CÉZANE PRISCILA REUTER2, LEANDRO TIBIRIÇÁ BURGOS3, MIRIAM BEATRIS RECKZIEGEL4, FÚLVIO BORGES NEDEL5,
ISABELLA MARTINSDE ALBUQUERQUE6, HILDEGARD HEDWIG POHL7,MIRIA SUZANA BURGOS8 1 Physiotherapist, Universidade de Santa Cruz do Sul (UNISC), Santa Cruz do Sul, RS, Brazil
2 Pharmaceutic; MSc Student, Postgraduate Course in Health Promotion, UNISC, Santa Cruz do Sul, RS, Brazil 3 MSc in Regional Development, Department of Physical Education and Health, UNISC, Santa Cruz do Sul, RS, Brazil 4 MSc in Human Movement Science, Department of Physical Education and Health, UNISC, Santa Cruz do Sul, RS, Brazil
5 PhD in Epidemiology, Department of Public Health, Centro de Ciências da Saúde, Universidade Federal de Santa Catarina (UFSC), Florianópolis, SC, Brazil 6 PhD in Medical Sciences, Department of Physiotherapy and Reabilitation, Universidade Federal de Santa Maria (UFSM), Santa Maria, RS, Brazil 7 PhD in Regional Development; Professor, Postgraduate Course in Health Promotion, UNISC, Santa Cruz do Sul, RS, Brazil
INTRODUCTION
Lifestyle changes have occurred according to social preferences throughout human evolution, and popula-tion characteristics change accordingly. In this sense, in the past two centuries there was a phenomenon the lit-erature called epidemiological transition, in which non-transmissible chronic diseases have gained focus, while infectious and parasitic diseases are no longer the main morbimortality agents1.
Non-transmissible chronic diseases are those that have multiple etiologies with a prolonged course, which occur together with comorbidities, and are often asymp-tomatic for long periods. Most of them have modifiable risk factors in their genesis1, of which obesity is one of the most important, as it generates systemic alterations, mainly cardiovascular and endocrine effects2.
Cardiovascular diseases are considered a significant public health problem, justified by the fact that they are the leading cause of death and disability in developed and developing countries3. Among the wide range of cardiovascular diseases, one of the most prevalent in the population is systemic arterial hypertension, which is characterized by high and sustained levels of blood pressure (BP)4. It is known that hypertension is no longer observed only in adults. Previous studies have shown that obese children and adolescents have the po-tential to develop this disease2,5.
Within this context, the childhood environment ap-pears to be strongly related to the risk of non-transmis-sible diseases in adulthood. Stimulus during the child’s development results in permanent adaptation responses that produce long-term changes in tissue structure or function6. Cardiovascular diseases are closely related with genetics, and when associated with risk factors generated by an inappropriate lifestyle early in life, they result in diseases later manifested in adults7. Finally, early intervention is necessary, as it alone is capable of ensuring a healthy lifestyle for the cardiovascular sys-tem in adulthood, thus modifying the high rates of car-diovascular morbidity and mortality8.
In this sense, the present study aimed to determine the prevalence of obesity and hypertension among schoolchildren in Santa Cruz do Sul, Rio Grande do Sul, in the years 2005 and 2008.
METHODS
This was a study with two consecutive cross-sectional measurements (before-and-after) with children and adolescents enrolled in schools in the city of Santa Cruz do Sul – RS, Brazil. This research is a sub-sample of the “Lifestyle, somatomotor, and risk factors profiles: a study of schoolchildren in Santa Cruz do Sul and par-ticipants in the UNISC” and “Health and lifestyle in
school and family: health indicators in schoolchildren and their association with family health in urban and rural areas of Santa Cruz do Sul” projects, both from the Universidade de Santa Cruz do Sul.
The sample consisted of the 414 schoolchildren as-sessed in 2005 that were measured again in 2008, thus constituting, for this study, a closed cohort. The data originally collected in the years 2005 and 2008 were randomly selected from a stratified cluster sample (cen-ter, and north, south, east, and west regions of the out-skirts of the urban area, and north, south, east, and west rural regions), from 18 schools (public and private), 14 from the urban area and four from the rural area.
The study included all students enrolled in the school aged 7 to 17 years, who were selected by drawing lots, after the informed consent had been signed by a parent or guardian, authorizing the student’s participa-tion in the assessments and tests. The study excluded all children with any type of disabling disease that would prevent testing.
In this study, the variables were: body mass index (BMI), percentage of body fat (%BF), systolic (SBP) and diastolic (DBP) blood pressure, as well as the classifica-tions of these variables, with BMI as a continuous vari-able classified into three categories (normal, overweight, and obesity), and the presence of hypertension (defined by the VI Brazilian guidelines on hypertension, 2010)4. Their distributions were analyzed by gender and year of sample for discrimination purposes.
BMI was calculated using the formula: weight (kg) ÷ height (m)², and was categorized according to the percentile curves for gender and age, following the protocol by Conde and Monteiro9, intended for the as-sessment of nutritional status of Brazilian children and adolescents. To evaluate the sum of skinfolds (ΣSF) and %BF, triceps and subscapular folds were measured with a Lange compass (Multimed, Skinfold Caliper – USA). To calculate the %BF, the Slaughter equation was used10, being subsequently classified according to the data pro-vided by Heyward and Stolarczyv10.
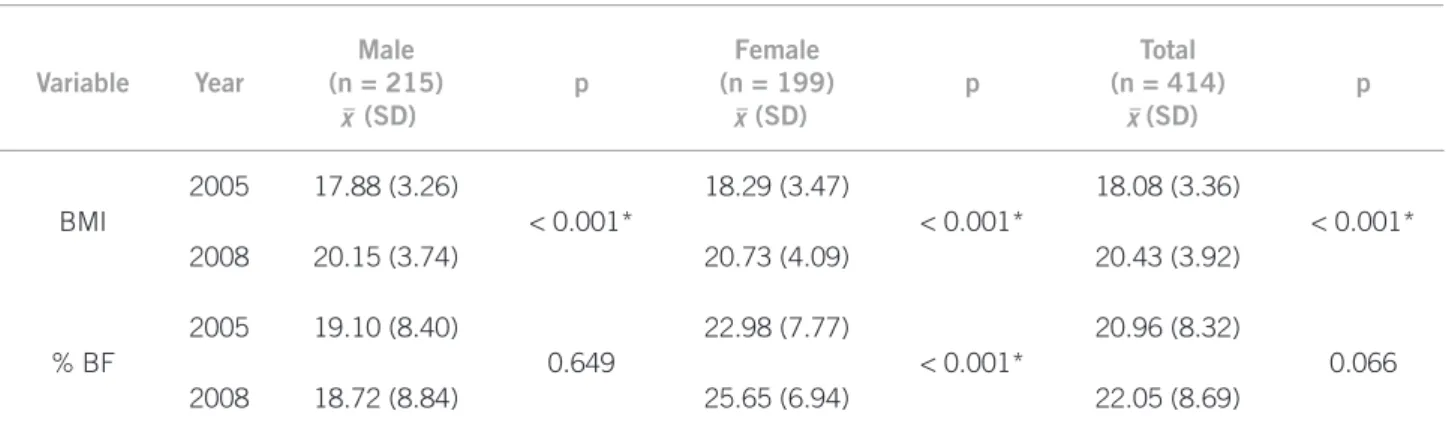
Table 1 – Anthropometric parameters
Variable Year
Male (n = 215)
(SD)
p
Female (n = 199)
(SD)
p
Total (n = 414)
(SD)
p
BMI
2005 17.88 (3.26)
< 0.001*
18.29 (3.47)
< 0.001*
18.08 (3.36)
< 0.001* 2008 20.15 (3.74) 20.73 (4.09) 20.43 (3.92)
% BF
2005 19.10 (8.40)
0.649
22.98 (7.77)
< 0.001*
20.96 (8.32)
0.066 2008 18.72 (8.84) 25.65 (6.94) 22.05 (8.69)
(SD), mean (standard deviation); BMI, body mass index; %BF, percentage of body fat. *Signiicant values for p < 0.05.
x x x
x
The Statistical Package for Social Sciences for Win-dows (SPSS – version 18.0) was used for data analysis. Descriptive statistics comprised measures of central tendency and dispersion, frequency, and percentage. The Kolmogorov-Smirnov test was used, and showed normal distribution for all continuous variables, which allowed for the use of parametric tests. Thus, the dif-ference between the groups (2005 and 2008) was cal-culated using the Chi-squared test for trends in cate-gorical variables; Student’s t-test was used for numeric variables. In order to analyze the relationship between anthropometric variables and blood pressure, Pearson’s linear correlation was used. The level of significance was set at p < 0.05.
The project was previously submitted and approved by the Ethics Committee on Human Research at Uni-versidade de Santa Cruz do Sul (UNISC) , under pro-tocol No. 2780/10, in accordance with the Declaration of Helsinki. Parents or guardians signed the informed consent form prior to enrollment in the study, which al-lowed the participation of their children in assessments and tests. Students who did not participate in the two evaluations were excluded.
RESULTS
A total of 414 students were evaluated in 2005 and reas-sessed in 2008; these were students from public and pri-vate schools in the city of Santa Cruz do Sul, Rio Grande do Sul, Brazil. The overall mean age was 9.8 (SD 1.8 years) and 14.0 (SD 1.8 years), respectively in 2005 and 2008. Regarding gender, there were 215 (51.9%) males and 199 females (48.1%).
Table 1 shows the total mean as well as the dif-ferentiated means by gender for BMI and %BF; there was an increase in both variables. It should be not-ed that the overall mean BMI signiicantly increasnot-ed (p < 0.001) from 17.88 (SD 3.26) kg/m² to 20.15 (SD 3.74) kg/m² in males, and from 18.29 (SD 3.47) kg/m² to 20.73 (SD 4.09) kg/m² in females (p < 0.001).
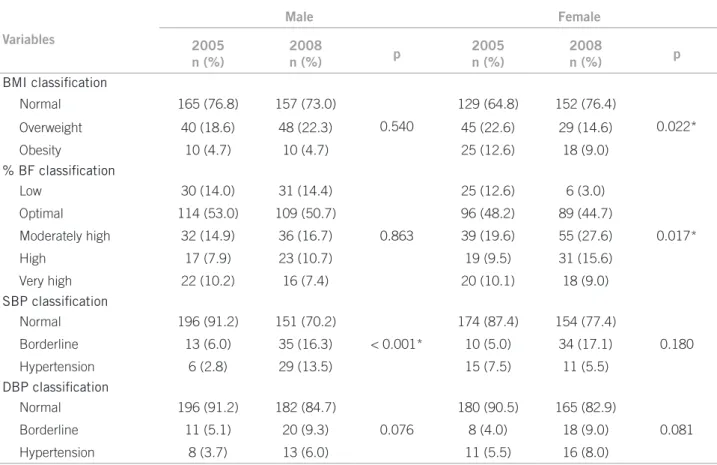
Table 2 shows that there were different results re-garding gender. For males, there were no statistically significant changes between the two years regarding both the BMI classification and %BF. In females, there was a statistically significant difference regarding BMI (p = 0.022) and %BF (p = 0.017). Moreover a reduction in BMI classification, but an increase of %BF was ob-served in females.
Table 2 shows that there were statistically signii-cant changes in the classiication of SBP only in males (p < 0.001) when the diference between the two years was assessed. Regarding the normal range of SBP, there was a decrease in both genders (of 21% and 10%, respec-tively, for males and females), while there was an increase of over 10% of both genders in the borderline range.
Although there was no statistical significance in the classification of SBP, a decrease in the number of stu-dents in the normal range and an increase in the bor-derline and hypertension ranges was observed for males and females.
Evaluating possible associations between the de-pendent variables (SBP and DBP) and indede-pendent variables (BMI and %BF), a significant correlation was observed among all of them (p < 0.05). For SBP, there was a weak correlation with BMI in both years and with %BF only in 2005. As for DBP, only a weak correlation with BMI was observed in both years (Table 3).
DISCUSSION
The study has demonstrated an increased prevalence of hypertension and borderline BP levels among school-children in Santa Cruz do Sul, aged 7 to 17 years over a period of three years – from 2005 to 2008, which was statistically significant for males.
Variables
Male Female
2005 n (%)
2008
n (%) p
2005 n (%)
2008
n (%) p
BMI classification
Normal 165 (76.8) 157 (73.0)
0.540
129 (64.8) 152 (76.4)
0.022* Overweight 40 (18.6) 48 (22.3) 45 (22.6) 29 (14.6)
Obesity 10 (4.7) 10 (4.7) 25 (12.6) 18 (9.0)
% BF classification
Low 30 (14.0) 31 (14.4)
0.863
25 (12.6) 6 (3.0)
0.017* Optimal 114 (53.0) 109 (50.7) 96 (48.2) 89 (44.7)
Moderately high 32 (14.9) 36 (16.7) 39 (19.6) 55 (27.6)
High 17 (7.9) 23 (10.7) 19 (9.5) 31 (15.6)
Very high 22 (10.2) 16 (7.4) 20 (10.1) 18 (9.0)
SBP classification
Normal 196 (91.2) 151 (70.2)
< 0.001*
174 (87.4) 154 (77.4)
0.180 Borderline 13 (6.0) 35 (16.3) 10 (5.0) 34 (17.1)
Hypertension 6 (2.8) 29 (13.5) 15 (7.5) 11 (5.5)
DBP classification
Normal 196 (91.2) 182 (84.7)
0.076
180 (90.5) 165 (82.9)
0.081 Borderline 11 (5.1) 20 (9.3) 8 (4.0) 18 (9.0)
Hypertension 8 (3.7) 13 (6.0) 11 (5.5) 16 (8.0)
BMI, body mass index; % BF, percentage of body fat; SBP, systolic blood pressure; DBP, diastolic blood pressure; p, chi-squared for trend. *Values considered signiicant when p < 0.05.
Table 2 – Classification of BMI,% BF, SBP, and DBP comparing the prevalence related to the year and by gender
BMI % BF
2005 2008 2005 2008
SBP
r 0.456* 0.446* 0.359* 0.261
p < 0.001 < 0.001 < 0.001 < 0.001
DBP
r 0.331* 0.358* 0.258 0.238
p < 0.001 < 0.001 < 0.001 < 0.001
r, Pearson’s correlation; p, level of signiicance (p < 0.05); SBP, systolic blood pressure; DBP, diastolic blood pressure; BMI, body mass index; %BF, percentage of body fat. *Weak correlation (r = 0.30 to r = 0.49).
Table 3 – Correlation of SBP and DBP with BMI and %BF
The definitions of overweight and obesity, as well as their classification in children and adolescents, show a lot of variability in classification methods, making it difficult to compare results with previous studies11.
Regarding BMI, the present results demonstrate that there was an increase in the means when compared be-tween the years in both genders. Gupta et al.12 found similar results in India, showing an increase in mean BMI in males (p = 0.006), also compared with a three-year interval.
Regarding the BMI classification, the schoolchil-dren had a rate of overweight of 18.6% and 22.3% in males (2005 and 2008, respectively), whereas in fe-males, it was 22.6% in 2005 and 14.6% in 2008. Costa, Cintra and Fisberg11, in a study in the city of Santos – São Paulo, found lower rates of overweight, but higher rates of obesity, both for males and females. In addi-tion, the authors found greater significance in relation to prevalence of overweight in females, and of obesity, in males; therefore, these results differ from the pres-ent study.
In Pelotas – RS13, the authors found similar values in relation to overweight and obesity for boys (21.3% and 5.1% respectively). For females, 20.5% were overweight and 4.8% obese; the latter were lower than the results found in this study. In Maceió, the overall prevalence of overweight was 9.3%, and 4.5% for obesity, which are lower rates when compared to the present study14.
prevalence of overweight (23.2% to 25.9%, p = 0.023) and obesity (8.9 % to 11.5%, p = 0.002) in boys. In girls, the prevalence of overweight decreased (25.9% to 24.0%, p = 0.227), corroborating the present findings12. Regarding the %BF, the main results showing in-creased and undesirable levels were observed in fe-males, with statistical significance for both means (p <0.001) and classification (p = 0.017). These findings are confirmed by Kolle et al.15, Morales et al.16, Berg-mann et al.17, and Alvarez et al.18. McCarthy19 reports that there are known differences in the development of adiposity between males and females. The figures are similar for both genders until puberty, diverging sharp-ly from this period onward, in which the males propor-tionally decrease %BF in relation to females.
The fact that females have shown a decrease in overweight and obesity rates as demonstrated by BMI, as well as an undesirable increase in %BF, can be ex-plained by the hormonal transition that occurs during puberty, in which body fat development stimulation occurs by estrogen action in girls, increasing the accu-mulation of body fat and decreasing muscle mass ratio. The higher content of fat tissue occurs through both the larger amount of tissue and the greater size of adi-pocytes20. Furthermore, BMI is an index that does not reflect body composition21.
Kaplowitz22 reports that several recent studies have shown that females with a relatively higher body mass index are more likely to have an early menarche, sug-gesting a relationship between hormonal status and body composition.
In another scenario, Rivera et al.23 found, in the city of Maceió, a prevalence of sedentary lifestyle of 93.5% among the assessed children and adolescents, being more common in female adolescents. In this study, in-dividuals were considered sedentary if they did not ex-ercise at moderate to high intensity during the week.
Regarding blood pressure, significant values were observed in relation to the classification of systolic blood pressure in males (p < 0.001). Despite that, a de-crease was noticed in the number of children and ado-lescents in the normal BP range, and an increase in the borderline and hypertension ranges for SBP and DBP in males and in DBP for females. For SBP, there was a decrease in the hypertension range among girls, consid-ering the last cutoff studied. This fact may be related to the aforementioned hormonal factors of puberty, as the estrogen has a cardioprotective effect, including effects on the arterial wall24,25, which hypothetically could jus-tify the decreased levels of systolic hypertension in girls. In addition to hormonal factors, the practice of physical activity, which was not assessed in this study, may influ-ence the decrease in blood pressure26.
Regarding means, a signiicant increase (p <0.001) was observed for SBP and DBP between the years for both genders. However, this increase is expected, as the study assessed the same schoolchildren, and they grew during this period. In this sense, it is worth emphasizing the close relationship between height and blood pressure. Steinthorsdotti et al.27, in a study of Icelandic chil-dren aged 9 to 10 years, found a prevalence of higher blood pressure in boys (13.9% versus 12.3%). Similar findings on BP increase were found by Bancalari et al.28 in Chile, Salvadori et al.2 in Canada, Sorof et al.29 and Morrison et al.30 in the US, Aguirre et al.31 in Spain, Benmohammed et al.32 in Algeria, and Gomes and Alves33 and Araújo et al.34 in Brazil.
Thus, national and international studies have dem-onstrated a higher prevalence of hypertension in males. Despite this fact, an explanation on gender difference regarding alterations in systolic blood pressure was not found in the literature2,28-35.
Although the mechanisms by which SBP alterations occur more often in males are not yet known, it is im-portant to identify hypertension in childhood and ado-lescence for both genders, considering that, as reported by Liang Mi36, 50% of children with hypertension be-come hypertensive adults, and among the hypertensive prepubertal individuals, 34.3% developed this altera-tion as adults.
When correlating blood pressure variables, both systolic and diastolic, with anthropometric variables as-sessed in this study, a weak correlation was found be-tween the following variables: SBP and BMI (in 2005 and 2008), SBP and %BF (only in 2005), and DBP and BMI (in 2005 and 2008). For all variables analyzed in this correlation, a p < 0.001 was obtained. Steinthors-dotti et al.27 found a significant correlation between BMI and SBP (r = 0.038, p <0.001). Although the pres-ent study did not evaluate waist circumference, the data have been analyzed by this group in another study, showing a moderate correlation between this variable and systolic blood pressure (r = 0.498 and p < 0.001)37.
The authors believe that there are factors, which were not the object of this study, that can influence the results, such as the daily habits of using the computer, watching TV, or playing video games for many hours38,39; the number of BP measurements40; the school environ-ment41; dietary habits; and socioeconomic class38.
of life (UQoL), which represents the individual’s social background, as measured by several indicators such as family income, health status, social assistance, educa-tion, and housing conditions.
The present study has some limitations: it did not assess socioeconomic status, time spent on physical exercises, which activities were practiced, nor even the level of sedentary lifestyle. The lack of data on nutri-tion, family history, and waist circumference, the lat-ter being an important anthropometric measurement as an indicator of cardiovascular health, should also be mentioned as limitations of this study. Therefore, it is suggested that further studies are conducted in order to establish a more accurate picture.
CONCLUSION
The findings of the present study show that the lev-els of prevalence of overweight, obesity, and %BF are high in schoolchildren, especially in females. Addi-tionally, increased levels of systolic blood pressure in males highlight the need for early intervention through more effective public health campaigns. These data are alarming, as children and adolescents with these altera-tions have increased risk to develop non-transmissible chronic diseases as adults. The percentage decrease in normal blood pressure levels, both systolic and dia-stolic, although lacking statistical significance, is still relevant as it demonstrates a regression in the profile of the studied group.
Therefore, the importance of diagnosing obesity and/or arterial hypertension in this age group is empha-sized in order to identify individuals with BP alterations, as well as who have risk factors for future alterations.
REFERENCES
1. Moura EC, Silva AS, Malta DC, Morais Neto OL. Fatores de risco e pro-teção para doenças crônicas: vigilância por meio de inquérito telefônico, VIGITEL, Brasil, 2007. Cad Saúde Pública. 2011;27(3):486-496.
2. Salvadori M, Sontrop JM, Garg AX, Truong J, Suri RS, Mahmud FH, et al. Elevated blood pressure in relation to overweight and obesity among children in a rural Canadian community. Pediatrics.2008;122(4):e821-7. 3. Jeemon P, Reddy KS. Social determinants of cardiovascular disease
out-comes in Indians. Indian J Med Res. 2010;132(5):617-22.
4. Sociedade Brasileira de Cardiologia, Sociedade Brasileira de Hipertensão, Sociedade Brasileira de Nefrologia. VI Diretrizes Brasileiras de Hiperten-são. Arq Bras Cardiol. 2010;95(Suppl 1):1-51.
5. Beilin L, Huang R-C. Childhood obesity, hypertension, the metabolic syndrome and adult cardiovascular disease.Clin Exp Pharmacol Physio. 2008;35:409-11.
6. Langley-Evans SC. Developmental programming of health and disease. Proc Nutr Soc. 2006;65(1):97–105.
7. Robillard JE, Segar JL. Influence of early life events on health and diseases. Trans Am Clin Climatol Assoc. 2006;117:313–20.
8. Magalhães MEC, Brandão AA, Pozzan R, Campana EMG, Fonseca FL, Pizzi OL, et al. Prevenção da hipertensão arterial: para quem e quando começar? Rev Bras Hipertens. 2010;17(2):93-97.
9. Conde WL, Monteiro CA. Body mass index cutoff points for evalua-tion of nutrievalua-tional status in Brazilian children and adolescents. J Pediatr. 2006;82(4):266-72.
10. Heyward VH, Stolarczyk LM. Avaliação da composição corporal aplicada. São Paulo: Manole; 2000.
11. Costa RF, Cintra IP, Fisberg M. Prevalência de sobrepeso e obesi-dade em escolares da ciobesi-dade de Santos, SP. Arq Bras Endocrinol Metab. 2006;50(1):60-7.
12. Gupta DK, Shah P, Misra A, Bharadwaj S, Gulati S, Gupta N, et al. Secular trends in prevalence of overweight and obesity from 2006 to 2009 in urban Asian Indian adolescents aged 14-17 years. PLoS One. 2011;6(2):e17221. 13. Terres NG, Pinheiro RT, Horta BL, Pinheiro KAT, Horta LL. Prevalência e
fatores associados ao sobrepeso e à obesidade em adolescentes. Rev Saúde Pública. 2006;40(4):627-33.
14. Mendonça MRT, Silva MAM, Rivera IR, Moura AÁ. Prevalência de so-brepeso e obesidade em crianças e adolescentes da cidade de Maceió. Rev Assoc Med Bras. 2010;56(2):192-6
15. Kolle E, Steene-Johannessen J, Holme I, Andersen LB, Anderssen SA. Secu-lar trends in adiposity in Norwegian 9-year-olds from 1999-2000 to 2005. BMC Public Health.2009;9:389.
16. Morales IF, Vilas MVA, Veja CJM, Para MCM. Breakfast quality and its relationship to the prevalence of overweight and obesity in adolescents in Guadalajara (Spain). Nutr. Hosp. 2011;26(5):952-8.
17. Bergmann MLA, Halpern R, Bergmann GG. Perfil lipídico, de aptidão car-diorrespiratória, e de composicão corporal de uma amostra de escolares de 8a série de Canoas/RS. Rev Bras Med Esporte. 2008;14(1):22-7.
18. Alvarez MM, Vieira ACR, Sichieri R, Veiga GV. Associação das medidas antropométricas de localização de gordura central com os componentes da síndrome metabólica em uma amostra probabilística de adolescentes de escolas públicas. Arq Bras Endocrinol Metab. 2008;52(4):649-57. 19. McCarthy HD, Cole TJ, Fry T, Jebb SA, Prentice AM. Body fat reference
curves for children. Int J Obes. 2006;30:598–602.
20. Rowland TW. Fisiologia do exercício na criança. 2a ed. São Paulo: Manole; 2008.
21. Chen CC, Wang WS, Chang HY, Liu JS, Chen YJ. Heterogeneity of body mass index, waist circumference, and waist-to-hip ratio in predicting obesity-related metabolic disorders for Taiwanese aged 35–64 y. Clinical Nutrition 2009;28(5):543–8.
22. Kaplowitz PB. Link between body fat and the timing of puberty. Pediatrics. 2008;121(3):S208-17.
23. Rivera IR, Silva MAM, Silva RDATA, Oliveira BAV, Carvalho ACC. Ativi-dade física, horas de assistência à TV e composição corporal em crianças e adolescentes. Arq Bras Cardiol. 2010;95(2):159-65.
24. Leitão MB, Lazzoli JK, Oliveira MAB, Nóbrega ACL, Silveira GG, Carv-alho T, et al. Posicionamento oficial da Sociedade Brasileira de Medicina do Esporte: atividade física e saúde na mulher. Rev Bras Med Esporte. 2000;6(6):215-20.
25. Gerhard M, Ganz P. How do we explain the clinical benefits of estrogen? From bedside to bench. Circulation. 1995;92(1):5-8.
26. Balas-Nakash M, Benítez-Arciniega A, Perichart-Perera O, Valdés-Ramos R, Vadillo-Ortega F. The effect of exercise on cardiovascular risk mark-ers in Mexican school-aged children: comparison between two structured group routines. Salud Publica Mex. 2010;52(5):398-405.
27. Steinthorsdottir SD, Eliasdottir SB, Indridason OS, Agustsdottir IM, Pals-son R, EdvardsPals-son VO. Prevalence of hypertension in 9- to 10-year-old Ice-landic school children. J Clin Hypertens (Greenwich). 2011;13(10):774-9. 28. Bancalari R, Díaz C, Martínez-Aguayo A, Aglony M, Zamorano J, Cerda V,
et al. Prevalencia de hipertensión arterial y su asociación con la obesidad en edad pediátrica.Rev Med Chile. 2011;139:872-9.
29. Sorof JM, Lai D, Turner J, Poffenbarger T, Portman RJ. Overweight, ethnic-ity, and the prevalence of hypertension in school-aged children. Pediatrics. 2004;113:475–82.
30. Morrison JA, James FW, Sprecher DL, Khoury PR, Daniels SR. Sex and race differences in cardiovascular disease risk factor changes in school-children, 1975–1990: the Princeton School Study. Am J Public Health. 1999;89:1708–14.
31. Aguirre CJ, Sánchez JC, Hernández N, Aguirre FJ, Andres BT. Prevalencia de hipertensión arterial en la población infantil de una zona rural. Aten Primaria. 2011;44(4):e16-17.
32. Benmohammed K, Nguyen MT, Khensal S, Valensi P, Lezzar A.Arterial hy-pertension in overweight and obese algerian adolescents: role of abdomi-nal adiposity. Diabetes Metab. 2011;37(4):291-7.
33. Gomes BMR, Alves JGB. Prevalência de hipertensão arterial e fatores as-sociados em estudantes de Ensino Médio de escolas públicas da Região Metropolitana do Recife, Pernambuco, Brasil, 2006. Cad Saúde Pública. 2009;25(2):375-81.
34. Araújo FL, Monteiro LZ, Pinheiro MHNP, Silva CAB. Prevalência de fa-tores de risco para hipertensão arterial em escolares do município de For-taleza, CE. Rev Bras Hipertens. 2010;17(4):203-9.
35. Rosa MLG, Fonseca VM, Oigman G, Mesquita ET. Pré-hipertensão arte-rial e pressão de pulso aumentada em adolescentes: prevalência e fatores associados. Arq Bras Cardiol. 2006;87(1):46-53.
36. Liang Y, Mi J. Pubertal hypertension is a strong predictor for the risk of adult hypertension. Biomed Environ Sci. 2011;24(5):459-66.
38. Rech RR, Halpern R, Costanzi CB, Bergmann MLA, Alli LR, Mattos AP. Prevalência de obesidade em escolares de 7 a 12 anos de uma cidade serrana do RS, Brasil.Rev Bras Cineantropom Desempenho Hum. 2010;12(2):90-7. 39. Goldfield GS, Kenny GP, Hadjiyannakis S, Phillips P, Alberga AS, Saun-ders TJ, et al. Video game playing is independently associated with blood pressure and lipids in overweight and obese adolescents. PLoS One. 2001;6(11):1-6.
40. Costanzi CB, Halpern R, Rech RR, Bergmann MLA, Alli LR, Mattos AP. Fa-tores associados a níveis pressóricos elevados em escolares de uma cidade de porte médio do sul do Brasil. J Pediatr. 2009;85(4):335-40.
41. Pereira A, Guedes AD, Verreschi ITN, Santos RD, Martinez TLR.A obe-sidade e sua associação com os demais fatores de risco cardiovascular em escolares de Itapetininga, Brasil. Arq Bras Cardiol. 2009;93(3):253-60. 42. Garcia FD, Terra AF, Queiroz AM, Correia CA, Ramos PS, Ferreira QT, et