Fundação Getúlio Vargas
Escola De Pós-Graduação Em Economia
Marcelo Paranaguá de Vasconcelos Teixeira
VALUE AND MOMENTUM STRATEGIES
IN THE BRAZILIAN STOCK MARKET:
THE 2008 FINANCIAL CRISIS AND ITS
AFTERMATH
Marcelo Paranaguá de Vasconcelos Teixeira
VALUE AND MOMENTUM STRATEGIES
IN THE BRAZILIAN STOCK MARKET:
THE 2008 FINANCIAL CRISIS AND ITS
AFTERMATH
Dissertação submetida à Escola de Pós-Graduação em Economia da Fundação Getulio Vargas como requisito parcial para obtenção do grau de mestre em economia.
Área de Concentração: Finanças
Orientador: Marco Antônio Cesar Bonomo
Ficha catalográfica elaborada pela Biblioteca Mario Henrique Simonsen/FGV.
Teixeira, Marcelo Paranaguá de Vasconcelos
Value and momentum strategies in the Brazilian stock market : the 2008 financial crisis and its aftermath / Marcelo Paranaguá de Vasconcelos Teixeira. – 2011.
ix, 41 f.
Dissertação (mestrado) - Fundação Getulio Vargas, Escola de Pós- Graduação em Economia.
Orientador: Marco Antônio Cesar Bonomo. Inclui bibliografia.
1. Bolsa de valores. 2. Investimentos. 3. Ações (Finanças). 4. Crise financeira global, 2008-2009. I. Bonomo, Marco Antônio Cesar. II. Fundação Getulio Vargas. Escola de Pós-Graduação em Economia. III. Título.
Marcelo Paranaguá de Vasconcelos Teixeira
VALUE AND MOMENTUM STRATEGIES
IN THE BRAZILIAN STOCK MARKET:
THE 2008 FINANCIAL CRISIS AND ITS
AFTERMATH
Dissertação submetida à Escola de Pós-Graduação em Economia da Fundação Getulio Vargas como requisito parcial para obtenção do grau de mestre em economia. Área de Concentração: Finanças
E aprovado em 01/07/2011 pela banca examinadora.
Marco Antônio Cesar Bonomo EPGE/FGV
Axel André Simonsen EPGE/FGV
Marcelo de Sales Pessoa IPEA
Esta dissertação analisa o desempenho de três estratégias de investimento em carteiras de custo zero ( alue , o e tu e uma combinação 50/50 delas, que é chamada de combo ) no mercado de ações brasileiro durante a última década. Os resultados são comparados aos encontrados por Asness, Moskowitz e Pedersen (2009) para quatro mercados: EUA, Reino Unido, Europa Continental, e Japão. Uma análise específica é feita em torno da crise financeira de 2008, comparando os resultados pré- e pós-crise. O índice de Sharpe é usado para ajustar os desempenhos por seus riscos, e para classificar as estratégias para diferentes horizontes de investimento. Os resultados mostram um ótimo
dese pe ho da est atégia o o nos últimos três anos, período que inclui a crise de 2008, mas considerando todo o período analisado a est atégia alue obteve o melhor desempenho. Esse resultado difere dos resultados encontrados para os quatro mercados de referência, onde a estratégia combo tem o melhor desempenho. A análise do horizonte de investimento mostra que a escolha do investidor pode mudar com diferentes horizontes.
This dissertation analyzes the performance of three zero-cost portfolio strategies (value, momentum and a 50/50 combination of those, which is called combo) in the Brazilian stock market during the last decade. The results are compared to the ones found by Asness, Moskowitz and Pedersen (2009) for four markets: US, UK, continental Europe, and Japan. A specific analysis is made around the 2008 financial crisis, comparing the pre- and post-crisis results. The Sharpe ratio is used to adjust the performances by their risks, and to rank the strategies for different investment horizons. The results show that the combo performed very well on the last three years, period that includes the 2008 crisis, but considering the entire period the value strategy had the best performance. This result is different from the results found for the four benchmark markets, where the combo strategy has the best performance. The investment horizon analysis shows that the investor’s choice may change with different horizons.
1 INTRODUCTION……… 7
2 LITERATURY REVIEW………. 10
2.1 The Value Strategy………. 10
2.2 The Momentum Strategy……….. 11
2.3 The Value and Momentum Combination Strategy (Combo Strategy).. 11
3 METHODOLOGY……… 13
3.1 Data……….. 13
3.2 Portfolio Construction………. 14
3.3 Adjusting the performances for the risk……… 15
3.4 Correlation……….. 17
4 RESULTS………. 19
4.1 Performance……….. 19
4.2 Risk-adjusted Performance……….. 23
4.3 Correlations……… 29
4.3.1 Ibovespa……… 29
4.3.2 Stocks Correlation……….. 30
4.3.3 Foreign Capital Flow………. 32
5 CONCLUSIONS……… 33
REFERENCES………. 35
1. INTRODUCTION
The traditional finance paradigm tries to understand financial markets through models in which agents are rational, i.e., they process new information correctly
updati g thei eliefs a o di gl to the Ba es’ la , a d gi e thei eliefs, the
make optimal choices, maximizing their utility. Although this traditional framework is very attractive, their predictions usually are not confirmed in data, and it has faced some difficulties explaining some stock markets facts, as well as some individual trading behaviors observed in the real world.
The field of behavioral finance comes as a new approach for financial markets, arguing that some phenomenon can be better explained if the agents are not considered fully rational. The literature of the area shows that a lot of aspects of the
i esto s’ a tio s that see to poi t to atio alit de iatio s a e o se ed th ough
empirical evidence.
One of the observed actions is the insufficient diversification. There is strong evidence that the investors diversify their portfolios much less than some traditional financial models would recommend when choosing a portfolio, and when they diversify, most of them do it in a very naive way, as shown by Benartzi and Thaler (2001).
Other aspects of the behavior of the investors are connected to the buying and selling decisions. Shefrin and Statman (1985) observe that the agents avoid selling stocks when they worth less than the value for which they were bought, calling it
dispositio effe t , a d Odea o se es that the age ts a e o e illi g to sell
a stock when its price is higher than the price they paid for it.
Regarding the buying decision, Odean (1999) noti ed that the age ts’
preferences are split between stocks with recent gains and stocks with recent losses, but in both cases they prefer the extreme cases. This phenomenon may be explained
a atte tio effe t , e ause so e age ts a just ot pa attention to certain stocks until they have some kind of abnormal behavior, such as great gains or losses.
Barberis and Thaler (2003) argue that the reason for these rationality deviations is that the agents generally base their decisions on a limited number of heuristic principles, which simplify complex tasks of probability evaluation and price prediction, and can lead to systematic ad serious mistakes.
De Bondt and Thaler (1985) also found evidence of irrational behavior by investors, this time related to o e ea tio to e e t e s, hi h ould lead to
abnormally high returns on the short-run, followed by a reversal effect on the long-run.
These irrational behavior from the non- atio al age ts, ho a e alled oise t ade s , lead to isp i i g o the arkets, and the traditional finance theory argues that the rational agents should recognize the opportunities of arbitrage, correcting the mispricing and excluding the noise traders from the market. However, there is a lot of empirical evidence of persisting mispricing, due to arbitrage limits, mostly connected to the short-term investment horizon of the agents, as argued by Shleifer (2000).
So, the existence of irrational behavior created space to a new research area, in which the authors try to predict the return of the stocks based on past information, relying on the known behavioral pattern of the agents to construct the strategies.
stock market, examining their behavior during the last decade (from 2001 to 2010) in order to rank the strategies. A special attention is given to the 2008 crisis.
Following the methodology of Asness, Moskowitz and Pedersen (2009), we construct the value, momentum, and combo zero-cost portfolios, compute their returns, and analyze the results for the entire period, as well as for the pre- and post-crisis periods. We adjust the performances of the strategies by their risks through the Sharpe ratio, and analyze the results over different choices of investment horizon. Finally, for further analysis, we compute the correlation between the performances of the strategies and some financial variables.
The results show during the 2008 crisis/recovery the combo strategy had the best performance, but considering the entire period the value strategy performed better than the combo, even after adjusting by the risk. Besides, investment horizon analysis shows that the st ategies’ a ki g ay change with different horizon choices.
2. LITERATURE REVIEW
2.1. The Value Strategy
The alue st ateg is ased o idea that the e iste t isp i i g o the a ket
will be corrected. It consists on, based on some value signal, buying stocks with a
good signal and selling stocks with a ad sig al. An example of a value signal is the book-to-market (BM) ratio, which is in fact one of the most used value signals. The idea is that if a price is below its fundamental level, it should increase, and similarly, if a price is above its fundamental level, it should decrease.
Fama and French (1992), studying the US stock market, found that the portfolios composed of stocks with high BM had higher average monthly return then the portfolios composed by stocks with low BM, and that this a o al etu as ’t
justified by a higher risk.
Lakonishok, Shleifer and Vishny (1994) also found that stocks with high BM continuously present higher returns in comparison with stocks with low BM, and the risk could not justify the difference of returns. They found yet that these results were
alid fo oth ea a d ull a ket pe iods.
Later, in a more comprehensive work, Fama and French (1998) found effectiveness of the value strategies for several countries, including Brazil.
Analyzing the Brazilian case, Braga and Leal (2000) found that portfolios of stocks with high BM had much better performances than portfolios of stocks with low
BM, e e afte adjusti g the pe fo a es the po tfolios’ isk.
2.2. The Momentum Strategy
The o e tu effe t is the elatio et ee a asset’s etu a d its e e t
performance history. The momentum strategy consists on buying stocks with high momentum (that is, high past returns) and selling stocks with low momentum, believing on the continuity of the trend.
Jegadeesh and Titman (1993) found evidence on momentum effectiveness on the US market, for several formation periods as well as several portfolio maintenance periods. They also found that the momentum etu as ’t justified by a higher risk. Chopra, Lakonishok and Ritter (1992) also found a short-run momentum trend for the US market.
For the Brazilian market, Lemos and Costa Jr. (1997) found reversal effect instead of a momentum effect, where the stocks with low momentum had better performance than the stocks with high momentum.
Bo o o a d Dall’Ag ol , following the methodology of Chopra, Lakonishok and Ritter (1992), also found a reversal trend in the Brazilian stock market instead of a momentum one.
2.3. The Value and Momentum Combination Strategy (Combo Strategy)
The ombo strategy consists on a 50/50 combination of the value and momentum strategies. Asness, Moskowitz and Pedersen (2009) argue that studying the interaction between value and momentum is more powerful than examining each one in isolation.
that produces a significantly higher Sharpe ratio than the ones of the individual strategies.
3. METHODOLOGY
3.1. Data
The stock sample used to compute the performance of value and momentum strategies consists of 1140 stocks negotiated at Bovespa, from July of 2000 through December of 20101. From the E o o ati a s ste , e olle ted the sto ks’ daily closure prices, book-to-market information2, and quarterly average traded volume.
The database was divided in time in 20 one-year-window subsamples (overlapping every six months), so that in the middle point of each subsample it would be possible to analyze 6-month past information to create the value and momentum portfolios, and then calculate their returns over the following 6 months. As this is an ex-post exercise, the idea is that, starting in January of 2001, the investor would have analyzed available information from the last six months to create the portfolio, and in July of 2001 he would have sold this po tfolio, o puti g its etu s, a d eated a new one based on the new recent information. He would have repeated the process in every six months until December of 2010.
Since the signal used in the value strategy (BM) is different from the one used in the momentum strategy (past returns), specific filters were created for each approach in order to construct the portfolios: for the value strategy, in each subsample, the stocks with at least one BM information in the past six months were kept; for the momentum strategy, in each subsample, the stocks with six months of past return history were kept.
Besides these individual filters, two other ones were created that were common to both strategies. First, to avoid abnormalities on the returns, the stocks with price smaller than R$ 0.1 at some point of a subsample were excluded from it. Second, to avoid liquidity problems, all stocks with an average traded volume smaller
1 Bonomo and Dall'Agnol (2003) show that the efficiency of the Brazilian stock market seems to have
i p o ed si e the B azilia a oe o o i ha ges i the ’s, hi h a affe ted the etu s of the
these strategies. So, in order to avoid these changes to affect the results, we chose to analyze the performance of these strategies based only on last decade information, from 2001 to 2010.
than R$ 300,000.00 in the last quarter were excluded from that subsample. After all the filters, we end up with on average 204 and 216 available stocks to be used in the value and momentum portfolios, respectively.
3.2. Portfolio Construction
Once the stocks to be used have been selected, we followed the methodology of Asness, Moskowitz and Pedersen (2009) to construct the value, momentum, and combo portfolios and compute their returns. Zero-cost portfolios were constructed for each strategy and each period, simulating an investor that based on the signals would create a portfolio, keep it for six months3, and then rebuilt the portfolio based on the new signal information. The idea is to eate a u i ue po tfolio’s o st u tio
algorithm, but keeping the portfolio a dynamic characteristic.
It is worth mentioning that the goal here is not to come up with the best predictors of the returns of the stocks, but to introduce a simple approach that should
gi e good esults a d does ’t de a d a o sta t atte tio to the po tfolio, si e the
investor will keep it for six months without making any changes.
For the value strategy, the used signal was the last BM information available for each stock. We sorted the stocks based on their BM, split them in three groups4 (high, middle, and low), and constructed zero-cost portfolios that go long stocks with high BM and short stocks with low BM. This way, we are using on average approximately 136 stocks (2/3 of 204) on the value portfolios.
The stocks are weighted in the value portfolio as follows:
3 Asness, Moskowitz and Pedersen (2009) used 12-month signal information to construct their
portfolios, and keep them for twelve months, but due to the reduced database we are using (compared to the databases of other papers in the literature), we chose to make new portfolios in every 6 months, so that we could have more portfolio return information to analyze.
4 If the number of available stocks is not divisible by three, the middle group will be slightly bigger, so
where is the number of stocks composing the portfolio at time (after the exclusion of the middle group), and are the weights, which clearly sum to zero, representing a zero-cost long-short portfolio. Notice that the weights were chosen such that the overall portfolio is scaled to R$1 long and R$1 short.
Then, the return of the value portfolio is:
where is the individual return of stock .
For the momentum strategy, we used as signal the 6-month past cumulative raw return of the stocks, skipping the ost e e t o th’s etu 5, which was called MOM2-6. Then we did the same thing we did for value: sorted the stocks based on their MOM2-6, divided them in three groups (high, middle, and low), and constructed zero-cost portfolios that go long stocks with high MOM2-6 and short stocks with low MOM2-6. So, the momentum portfolios are composed on average by 144 stocks.
The stock weighting methodology of the momentum portfolio is the same used to the value portfolio, just replacing BM for MOM2-6.
We also consider the return on a 50/50 equal combination of value and momentum strategies, which will be called o o st ateg . Then, the return of the combo is:
3.3. Adjusting the performances by the risks
To o e tl o pa e the st ategies’ pe fo a es, one needs to adjust them by their risks. For this, we used the Sharpe Ratio, a standard measure in the literature that was introduced by Sharpe (1966). It is generally defined as:
5 Skipping the most recent month is standard in the momentum literature, due to a contrarian effect
where is the return of the risky asset, is the return of a risk-free asset, and is the volatility of this excess of return, i.e., the standard deviation of .
Sharpe (1994) interprets the SR as an instrument to analyze the risk-adjusted performance of a zero-investment (or zero-cost) portfolio, in the sense that one would sell a risk-free asset to buy a risky asset.
In our case, we are already dealing with zero-investment portfolios, selling the low-signal portfolios to buying the high-signal ones. So, the Sharpe Ratio used here is:
where is the return of the strategy (value, momentum, or combo), and is the volatility of the strategy. Note that already is, by definition, an excess of return (the spread between the high-portfolio’s return and the low-portfolio’s etu , a d is the volatility of this excess of return.
No matter which frequency of data is used to compute the SR, it is standard in the literature to annualize the SR, according to the simple methodology proposed by Sharpe (1994), and then compare the SR from different portfolios to rank the strategies. But this practice can lead to errors on the strategies ranking.
Levy (1972) shows that the SR tends to change with different investment horizons. He also shows that as long as the intended investment horizon is different from the horizon used to compute the ratio, the Sharpe ratio exhibits systematic biases and any asset-allocation decisions based on it will be misleading.
Looking at our case, since in these strategies the investors always keep their portfolios for at least six months6, there is no reason for us to calculate the SR using daily or monthly data. So, we will only use data horizons equal or multiples of
6
semesters to compute it. Also, in order to check if the SR value changes over different horizons, we will compute the SR using different horizons, and annualize them to compare the results.
Following this idea, Lin and Chou (2003) argue that because investors differ in their risk attitudes and in holding horizons, it is unreasonable to evaluate portfolio performance based on one single investment horizon. So, as practical implementation of the SR is reasonable only if the intended investment horizon equals the holding period of the returns used to compute the ratio, they propose that plotting a graph of Sharpe ratio against the investment horizon may be more appropriate for investors with multiyear investment horizons.
Then, to conclude the evaluation of the risk-adjusted performance, after having computed the SR for several investment horizons (all multiples of one semester), we will plot a graph of SR against investment horizon, so that an investor could look at it and rank the strategies according his investment horizon profile.
3.4. Correlations
In order to better understand the performances of the three strategies, we analyze their relations with some financial variables, trying to obtain more information about the behavior of the returns of the strategies.
So, after computing the performances of the value, momentum, and combo strategies, we analyze the correlation between these performances and the three other variables: (i) the Ibovespa, (ii) the correlation among the available stocks, and (iii) the foreign net capital flow in the Brazilian stock market.
To measure the correlation among the available stocks (i.e., the stocks that
su i ed the filte s we simply take the mean of the all the correlations between pairs of stocks. Said in another way, this is the mean of all elements that are under (or above) the principal diagonal of the correlation matrix of the available stocks. From now on we use the letter to represent this correlation measure.
For the foreign net capital flows in the Brazilian stock market, we used a daily series from January of 2006 through December of 2009. The reason for the reduced period of the database is simply the lack of additional available data, but at least this window includes both pre- and post-crisis periods. The daily correlation between this
4. RESULTS
Following the methodology illustrated on section 3, the MatLab software was used to compute the returns of the value, momentum and combo strategies, their risk-adjusted performances, the Sharpe ratios and the correlations between the performance of the portfolios and the variables proposed on section 3.4. The results are presented and analyzed in this section.
4.1. Performance
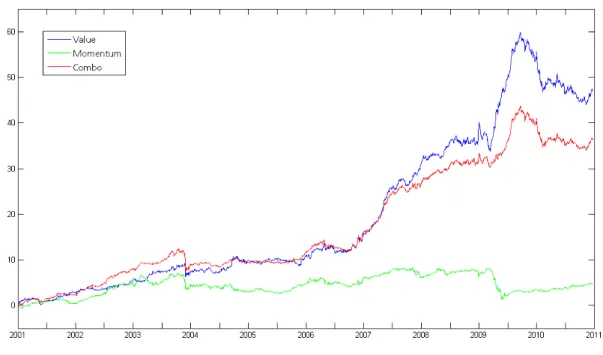
On figure 1 we can see the performance of the value, momentum and combo strategies over the last decade, as well as the performance of the Ibovespa.
Figure 1: Cumulated performance of the portfolios
The cumulated return of the value strategy (541.97%) was much higher than the return of the momentum strategy (75.38%), and consequently higher than the
highe tha the I o espa’s u ulated etu . % , hi h is ot a ze o -investment portfolio7.
The analysis of the performance of the value strategy gets even more interesting if we look just for the 2008-2010 period, the one of most economic instability on the decade, comprehending the 2008 crisis and its recovery. On figure 2 it can be seen that during the peak of the crises, when the Ibovespa suffered a huge
de aluatio , the alue’s u ulated etu ot o l did ’t de eased ut e e
increased a little bit. And during 2009, when the economy was recovering from the crisis, the value strategy had a great performance, reaching a cumulated return of about 80% on the second and third quarters of that year.
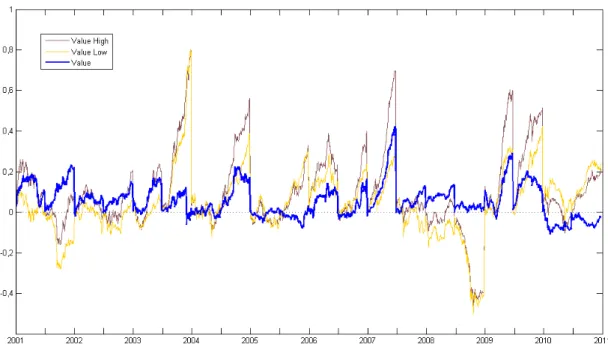
Figure 2: 2008-2010 performance
The reasons for this outstanding result can be noticed by analyzing the separated performances of the value-high and value-low portfolios, which are shown in figure 3. Studying the behavior of the semiannual performances of these portfolios, we see that during the second semester of 2008 both portfolios had a great depreciation, but the intensity was very similar, resulting in a stable performance of
7 One cannot directly compare the return of a zero-investment strategy with the gross return of
the value strategy, which is spread between those returns. In the following year, the value-high portfolio had a much higher cumulated return than the low-value portfolio, resulting on the great increase of the value st ateg ’s u ulated etu , as e sa o the last figure.
Figure 3: Semiannual performance of the value portfolios
The explanation for this behavior could be explained by the idea behind the construction of the value portfolio. When one buys stocks with high BM, one expects that the market value of these stocks will rise, and similarly, when one sell stocks with low BM, one expects that the prices will be corrected by the market, decreasing. But the 2008 crisis was characterized by a global loss of confidence on book information, so the market failed on correcting the stocks mispricing, and both the high and low portfolios had similar devaluation.
compared to the book information available, so that the correction of these mispricing would imply in return much higher than usual.
Analyzing now the performance of momentum strategy on the same period, figure 2 shows that it did well during the peak of the crisis (slightly better than the value strategy indeed), but had a huge crash on the first semester of 2009, when the economy was recovering from the crisis, and both value strategy and Ibovespa were doing very well.
On figure 4, analyzing the semiannual performance of its high and low portfolios, we can see why this happened. During the crisis, similarly to the value case, both portfolios presented great devaluation, but the momentum-low had an even worse performance, which resulted in a small increase of the momentum cumulated return.
Figure 4: Semiannual performance of the momentum portfolios
economy was recovering from the crisis. The market rapidly corrected the mispricing on the economy, in a way that the stocks with lowest returns over the past six months had the highest returns on the first semester of 2009. So, it was the arbitrage of the market that corrected the mispricing and provoked this reversal effect, making the momentum strategy to perform so badly.
When we turn our attention to the combo strategy, we can see on figure 2 that it performed well during the crises, with a good stability, and even better after the crises, with positive cumulative returns. That is, even though the momentum strategy had a bad performance, the great performance of the value strategy more than compensated it, making the combo strategy to perform well.
4.2. Risk-adjusted Performance
If an investor would look only to the past cumulated return of the strategies when choosing an investment strategy, from figures 2 and 3 we can see that the value strategy would be the chosen one, since it had the best performance either between 2001 and 2010 or from the 2008 crisis on. Moreover, by construction, the combo strategy would never have the highest cumulated return, since it is the average of the other two strategies, so the investor would never choose it.
However, the investor is not interested in the past return, but in the future return, which is uncertain, and a higher volatility will certainly make it more uncertain. So, when choosing the best investment strategy, the agent should also analyze the volatility of the past returns, a d that’s he the o o st ateg e o es o e
attractive.
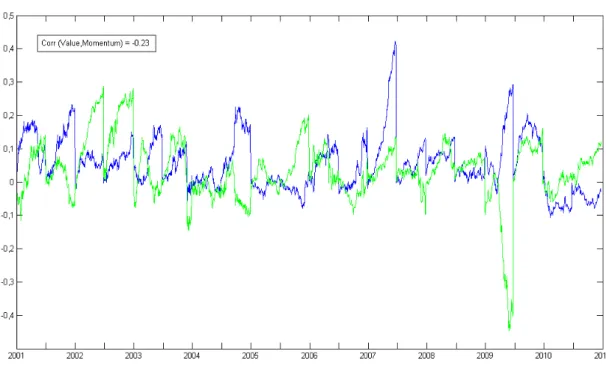
Figure 5 shows the semiannual returns of the value and momentum strategies, and we can clearly see that they are negatively correlated8 (-0.23). This negative correlation is responsible for a smaller volatility of the combo strategy, if compared to value and momentum strategies, making its portfolio less risky than the other two.
8 The correlation between the daily returns of the value and momentum strategies is also negative and
Figure 5: Correlation between value and momentum semiannual returns
This way, since the value strategy has the highest past cumulated returns, and the combo strategy has the smallest risk, we need to adjust the performance of the portfolios by their risk to rank the strategies. Asness, Moskowitz and Pedersen (2009) adjusted the cumulative returns of value, momentum and combo strategies for four markets (US, UK, continental Europe, and Japan) by their monthly volatility. The results can be seen in the figures of the appendix.
Following this idea, we did a similar exercise, but instead of using the monthly volatility, it was used the semiannual volatility to adjust our series of cumulative return, due to the argumentation presented in section 3.3. The results can be seen in figure 6.
Comparing the risk-adjusted performance of the portfolios with the non-adjusted performance on figure 2, we can see that the combo strategy has a relatively better result, but still worse than the value strategy one. This result is different from the results of Asness, Moskowitz and Pedersen (2009)9, where the combo strategy risk-adjusted performance surpasses the performances of both the value and momentum strategies. One possible reason for this result is that, while on those cases the negative
correlation between value and momentum is very strong (-0.63, -0.59, -0.50, and -0.52, respectively), in the Brazilian market it is -0.23. This way, the decrease on the volatility of the combo strategy on the Brazilian a ket ould ’t e as large as it appears to be on the cases analyzed by those authors, which made this strategy less powerful here.
Figure 6: Performance adjusted by semiannual volatility.
Comparing these four markets with the Brazilian market, it can also be noticed that the Brazilian market is more similar to the Japanese market than the others, in which the value strategy has better results than the momentum strategy. Another similarity is that for some periods the combo is better than the value, and sometimes it is worse. This can be evidence that the period of analysis can interfere on the ranking of the strategies, and to explore it in a deeper dimension, we also analyze the performance of the strategies before and after the crisis, splitting the database in before and after January 1st, 2008.
Figure 7 shows the performances from January of 2001 to December of 2007, adjusted by the semiannual volatility of the period. Notice that the pattern of the performances is very similar to the one we observe for the entire period.
Figure 7: 2001-2007 performance adjusted by semiannual volatility
This difference of results can be explained by the fact that from 2001 to 2007 the correlation between value and momentum is weak and positive (0.07), which takes off the power of the combo portfolio, while from 2008 to 2010 the correlation between value and momentum is negative and very strong (-0.74), which reduces the combo volatility and consequently improves its risk-adjusted performance.
These results of the performances before and after the 2008 crisis indicate that the combo strategy in the Brazilian market was more efficient during the most instable period, as it was expected.
However, although the analysis of these last two figures is important to see what happened before and after the 2008 crisis, the results should not be generalized for all crises, since there is only one great crisis in this sample. Moreover, we are looking only for past results, comparing pre- and post-crisis results, and it is hard for an investor to predict exactly when a crisis will begin.
Also, according to what was argued on section 3.3, this analysis can change according to the chosen investment horizon, since it will change the volatility of the returns. So, the previous results of this subsection are only completely valid for an investor that has an investment horizon of six months.
So, the a al sis of the pe fo a e’s g aphs can be useful on explaining some events, or to capture some details, but it is not the best way to rank the strategies, since it is not completely objective and would require redoing all these analyses when changing the investment horizon.
Hence, for this purpose we will compute and compare the Sharpe ratios (SR), which is an objective way to rank zero-investment strategies. As we explained on section 3.3, the SR also suffers from the investment horizon dilemma , and in order to show it is true, table 1 presents the annualized10 SR of the three strategies for different investment horizons.
Table 1: Annualized Sharpe Ratios x Investment Horizons
Horizon
Annualized Sharpe ratio Value Momentum Combo
1 semester 1,26 0,38 1,20
2 semesters 1,20 0,31 1,06
4 semesters 1,31 0,25 0,93
6 semesters 1,13 0,28 1,16
8 semesters 1,34 0,39 2,22
Note that with a horizon of one semester, the value strategy has the highest SR, but with a horizon of 6 or 8 semesters the combo strategy has the highest SR, which is an evidence of the existence of that dilemma.
However, differently f o hat happe s o the g aphs’ a al sis, this p o le
is simpler to be solved when we are dealing with the SR. All we need to do is to compute the SR for different horizons (which is much simpler than plotting all those graphs for each different horizon) and rank the strategies for each horizon. Then, all an
i esto eeds to do is to hoose his i est e t ho izo , a d the st ateg ’s hoi e ill
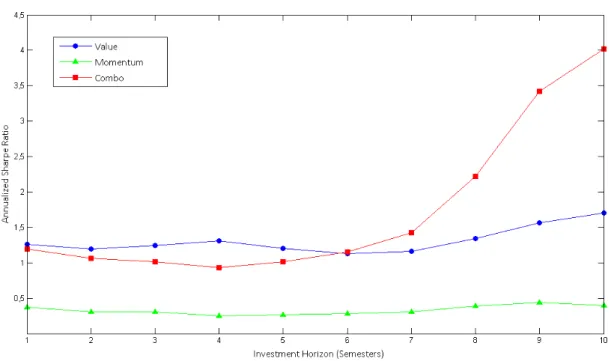
be made. Plotting a graph of the annualized SR over different horizon, as Lin and Chou (2003) suggested, makes the visualization easier, as showed in figure 9.
Figure 9: Annualized Sharpe Ratio x Investment Horizons
It is valid to mention that, due to the small size of the used sample, as the chosen investment horizon gets bigger, the computed SR becomes less robust, since the number of observations gets smaller. For example, using six-month overlapping data, for an investment horizon of one semester we have 20 observations to compute the SR, while for a six semesters horizon we have only 15 observations, and for a ten semesters horizon we have only 11 observations.
And if we consider that when we use overlapping data we use repeated information, the results for big investment horizons get even less trustful, since for a six semesters ho izo e ha e less tha eal o se atio s, a d fo a te se este s ho izo e ha e o l t o eal o se atio s. So, for the sample size we have, it may not be prudent to make statements about long investment horizons decisions.
Then, our results show that for investment horizon of one to five semesters the value strategy should be the best option for the investor, while for investment horizons of six to ten semesters the combo strategies seems to be better, although this last result may not be very robust.
4.3. Correlations
In this section we compute the correlations between the performance of the strategies and the three variables suggested on section 3.4.
4.3.1. Ibovespa
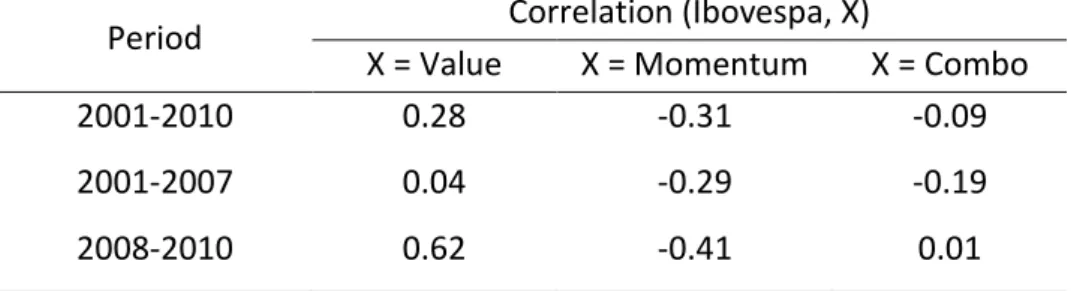
Here we present the correlations between the semiannual returns of the Ibovespa and the value, momentum and combo strategies. The correlations are calculated over the entire period, as well as for the pre-crisis and post-crisis period, and can be seen on table 2.
before and after 2008 we see that this positive correlation is due to the post-crisis period high correlation, since the correlation of the pre-crisis period was near to zero.
Table 2: Correlation between the Ibovespa and the strategies
Period Correlation (Ibovespa, X)
X = Value X = Momentum X = Combo 2001-2010 0.28 -0.31 -0.09 2001-2007 0.04 -0.29 -0.19 2008-2010 0.62 -0.41 0.01
When we look to the correlation with the momentum strategy, it is quite the opposite of the previous one, as expected, since value and momentum are negatively correlated. Comparing the values of the correlations on pre- and post-crisis periods, we can see that both value and momentum strategies were more correlated (positively or negatively) to the Ibovespa during the instable period (this was especially true to the value strategy), which made the combo strategy practically uncorrelated with the Ibovespa during the crisis.
4.3.2. Stocks Correlation
On figure 10 we plotted the correlation among the available stocks over time. This is actually the correlation among the prices of the stocks that could be used on the construction of the portfolios, which change every six months.
We can see that for most of the period the value of stood between 0.12 and 0.17, but during the peak of the crisis it reached 0.20, getting ever higher on the following semester (0.23), while the economy was already recovering from the crisis, as showed on figure 1.
more intense than its impact on the value strategy, leading also to a negative correlation between and the combo strategy.
Figure 10: Correlation among available stocks over time
We should be careful not to generalize these results by simply saying that the
most correlated the available stocks, the higher the return of the value strategy, and that the more diversified the portfolio, the higher the returns of the momentum and
o o st ategies , si e significant changes on only happened during the 2008 crisis/recovery, a single event in our sample.
In fact, the analysis made in section 4.1 shows that the performances of both value and momentum strategies stood practically stable during the second semester of 2008, when was very high, and had very extreme (and opposite) results on the first semester of 2009, when achieved its highest value. So, due to the relatively good behavior of and the performances of the strategies for the rest of the period in comparison to the first semester of 2009, we may suspect that the correlation between and the performances was strongly affected by this extreme observation.
would not be very useful information for the investor, since the strategies by
o st u tio do ’t allo the i esto to t to di e sif the portfolios.
Therefore, because of the observed pattern of and the small sample we have, the results of this sub-section are only valid to show how the correlation among the stocks was affected by the 2008 crisis, which helps illustrating the affect of the crisis on the performances of the strategies.
So, we can say that the 2008 crisis increased the correlation among the stocks, and in that scenario (of global crisis of confidence followed by recovery) the value strategy had a great performance, while the momentum strategy had a bad performance.
4.3.3. Foreign Capital Flow
5. CONCLUSIONS
In this work we analyzed the performance of value, momentum and combo strategies on the Brazilian stock market over the past decade. The value strategy had the higher cumulated return over the past ten years, compared to the momentum and the combo strategies, and even after adjusting the returns of the portfolios by their risks.
This result is different from the results of Asness, Moskowitz and Pedersen (2009), where the combo strategy had the best risk-adjusted performance in the US, UK, Continental Europe and Japan. This finding could be explained by the weaker negative correlation between value and momentum strategies on the Brazilian market (-0.23), if compared this correlation on those markets (always stronger than -0.5), which would lead to a less powerful combo strategy.
Splitting the period of analysis in pre-crisis (2001-2007) and post-crisis (2008-2010), we found that the value strategy still had the best performance one the first period, but on the second period (the one of most instability), as the correlation between the value and momentum strategies became considerably more negative (-0.74), the combo strategy had the best risk-adjusted performance.
After computing the Sharpe ratio of the strategies for different investment horizons, e fou d that the st ategies’ a ki g could change with the chosen horizons. The SR analysis showed that the value strategy is the best option for horizons of 1 to 5 semesters, but the combo strategy may be better for horizons of 6 to 10 semesters, although this last result is not as robust as the first one.
We also found that the momentum strategy on the Brazilian market does ’t appear to be a good option for the investor, if compared to the other two strategies. This result is coherent with Bonomo and Dall'Agnol (2003), who did not find a momentum effect on the Brazilian market, but instead found a reversal effect.
the post-crisis period, while for the momentum strategy this correlation was consistently negative, also with a stronger relation on the post-crisis period. The momentum strategy correlated very poorly with the Ibovespa in the entire period.
About the correlation among the stocks, its correlation with the performance of the value (momentum) strategy was positive (negative), but probably due to the period of recovery from the crisis.
REFERENCES
ASNESS, C., T. Moskowitz, and L. Pedersen . Value a d Mo e tu E e he e . AFA 2010 Atlanta Meetings Paper. (Available at SSRN: http://ssrn.com/abstract=1363476).
BARBER, B. and T. Odean . T adi g is haza dous to ou ealth: the o o stock performance of individual investo s , Journal of Finance, v. 55, pp. − .
BARBERIS, N. and R. Thaler (2003). A Su e of Beha io al Fi a e . I : Handbook of
the Economics of Finance, pp. 1051-1121. Elsevier Science.
BENARTZI, S. and R. Thaler . Nai e di e sifi atio st ategies in defined
o t i utio sa i gs pla s , American Economic Review, v. 91, pp. − .
BONOMO, M.A. and I. Dall'Agnol (2003). Reto os a o ais e est atégias o t á ias .
Revista Brasileira de Finanças, v.1, n. 2, pp. 165-215.
BRAGA, C. and R. Leal (2000). Ações de alo e de es i e to os a os ,
Finanças Aplicadas ao Brasil, org: Marco Bonomo, 1º ed., FGV Editora.
CHOPRA, N., J. Lako ishok e J. R. Ritte , Measu i g A o al Pe fo a e: Do sto ks o e ea t? . Journal of Financial Economics, v. 31, pp. 235-268.
De BONDT, W. and R. Thaler (1985). Does the stock market overreact? . Journal of
Finance, v. 40, pp. 793-805.
FAMA, E. and K. French (1992). The cross-section of expected returns . Journal of
Finance, v. 47, pp. 427-465.
FAMA, E. and K. F e h . Value e sus G o th: The I te atio al E ide e .
Journal of Finance, v. 53, n. 6, pp. 1975-1999.
JEGADEESH, N. and S. Titman (1993). Returns to buying winners and selling losers: Implications for stock market efficiency , Journal of Finance, v. 48, pp. 65-91.
LAKONISHOK, J., A. Shleifer and R. Vishny (1994). Co t a ia I est e t,
Extrapolation and Risk, Journal of Finance 49, 1541-1578.
LEMOS, M. and Costa Jr, N. (1997). O efeito de so e-reação a curto prazo no me ado de apitais asilei o . Revista Brasileira de Economia, v. 51, n. 3, pp. 323-324.
LEVY, H. (1972). Po tfolio Pe fo a e a d the I est e t Ho izo . Management
Science, v. 18, pp. 645-653.
LIN, M., and P. Chou . The Pitfall of Usi g Sha pe Ratio . Finance Letters, v. 1, pp. 84-89.
LO, A.W. and A. Ma Ki al , Whe A e Co t a ia P ofits Due to Sto k Ma ket
O e ea tio ?, The Review of Financial Studies, v. 3, n. 3, pp. 175-205.
ODEAN, T. . A e i esto s elu ta t to ealize thei losses? . Journal of Finance, v. 53, pp. − .
ODEAN, T. . Do i esto s t ade too u h? . American Economic Review, v. 89, pp. − .
SHARPE, W. F. . Mutual Fu d Pe fo a e . Journal of Business, vol. 39, n. 1, Jan., pp. 119-138.
SHARPE, W. F. . The Sha pe Ratio . Journal of Portfolio Management, vol. 21, Fall, pp. 49-58.
SHEFRIN, H. and M. Statman . The dispositio to sell i e s too ea l a d ide
lose s too lo g , Journal of Finance, v. 40, pp. − .
SHLEIFER, A. . I effi ie t Ma kets: A I t odu tio to Beha io al Fi a e .
APPENDIX