Exposing Corrupt Politicians:
The Effects of Brazil’s Publicly Released Audits on Electoral
Outcomes
∗
Claudio Ferraz
†Frederico Finan
‡September 2006
Abstract
This paper examines whether access to information enhances political accountabil-ity. Based upon the results of Brazil’s recent anti-corruption program that randomly audits municipal expenditures of federally-transferred funds, it estimates the effects of the disclosure of local government corruption practices upon the re-election success of incumbent mayors. Comparing municipalities audited before and after the elections, we show that the audit policy reduced the incumbent’s likelihood of re-election by approximately 20 percent, and was more pronounced in municipalities with radio sta-tions. These findings highlight the value of information and the role of the media in reducing informational asymmetries in the political process.
∗We are grateful to Tim Besley, David Card, Ken Chay, Alain de Janvry, Seema Jayachandran, Enrico Moretti, Torsten Persson, James Robinson, Elisabeth Sadoulet, and to seminar participants at Harvard University, LSE, UC-Berkeley, UCLA, UCSD, University of Chicago- Harris, University of Toronto, and Yale University. We are especially thankful to Ted Miguel for his many insights and constant encouragement. We also thank the staff at the Controladoria Geral da Uni˜ao (CGU) for helping us understand the details of the anti-corruption program. Ferraz gratefully acknowledges financial support from a CAPES doctoral fellowship.
†Instituto de Pesquisa Econˆomica Aplicada, Av. Presidente Antonio Carlos 51, 17o andar, Rio de Janeiro, RJ, 20020-010, Brasil. Email:cferraz@ipea.gov.br
‡Department of Economics, Bunche Hall 9353, UCLA, Box 951477 Los Angeles, CA 90095-1477. Email: ffinan@econ.ucla.edu
1
Introduction
The asymmetry of information between voters and policymakers is a central feature of
po-litical agency models. Voters typically do not observe a politician’s actions or may be
uninformed about his preferences.1
Because the interests of voters and politicians are not
al-ways aligned, politicians have an incentive to exploit this informational advantage to behave
opportunistically. Among the potential governance problems that information asymmetries
create, corruption stands at the forefront.
Consequently, one of the most powerful ways of monitoring politicians and preventing
corruption is to increase transparency by expanding the right to information disclosure (Sen
1999).2
With better information, voters can identify high quality politicians and hold corrupt
politicians accountable at the polls, thus reducing agency problems (Besley 2005).
While transparency has become the hallmark of good governance, an understanding
of how the availability of corruption information affects political accountability is rather
limited. Theoretically, recent models of political agency that incorporate both moral hazard
and adverse selection predict an ambiguous effect. Greater transparency allows voters to
better screen politicians, but it may also encourage corrupt politicians to disguise their
behavior thus decreasing the likelihood of detection (Besley and Pratt 2004).3
Empirically,
1
See for example Alesina and Cukierman (1990), Barro (1970), Ferejohn (1986), Persson, Roland, and Tabellini (1997). Alternatively, information asymmetries may stem from when information is costly and policymakers have better access to information on the consequences of alternative policies. This type of asymmetry is at the heart of the models pioneered by Baron (1994) and Grossman and Helpman (1996).
2
The World Bank, for example, asserts that “Transparency via public scrutiny has proven to be one of the most powerful forms of monitoring public officials. . .”. This reasoning has led several countries to experiment with transparency and information dissemination programs aimed at reducing corruption. For example, Argentina began a program in 1999 called Cristal. This program disseminates online all information concerning the use of public funds in Argentina. In 1998, the municipal government of Seoul, South Korea, started the program OPEN, which publishes a variety of information related to the services, permits and licenses issued by the local government. In addition to these programs, others exist in various states of India, as well as the in Philippines, Sri Lanka, and Colombia.
3
the lack of objective corruption measures and the identification problems associated with
the non-random nature of information disclosure continue to mount serious methodological
obstacles.4
In this paper, we study the effects of the disclosure of local governmental corruption
practices on the incumbent’s electoral outcomes in Brazil’s municipal elections. We
over-come previous data limitations and identification concerns by using an experimental design
that generates exogenous variation in the exposure of corrupt politicians to the public. Our
analysis utilizes Brazil’s recent anti-corruption program initiated in April of 2003, when the
federal government began to audit municipal governments for their application of federal
funds. Each month approximately sixty municipalities are chosen at random and then
in-spected by a team of auditors for irregularities associated with federally-sponsored projects
or public works, and misappropriation of federal funds. To promote transparency, the results
of these audits are disseminated publicly to the municipality, federal prosecutors, and the
general media. The randomized design and public dissemination allow us to compare the
electoral outcomes of incumbent mayors in municipalities where public audits occurred prior
to the elections to the electoral outcomes in municipalities where audits occurred after the
elections.
Although this simple comparison identifies the average impact of the program on
elec-toral outcomes, it does not capture the differential effects of the policy in terms of two
important aspects: the mayor’s corruptness and the presence of the media. In the first case,
as we show theoretically, for the audits to negatively (or positively) affect re-election
out-comes on average, voters would have had to systematically underestimate (or overestimate)
the incumbent’s corruption level. However, how the information from the audits compares
4
to voters’ prior beliefs of the mayor’s corruptness is likely to depend on the information
disclosed. An audit that does not report any corruption would expectedly have a different
effect on electoral outcomes than one that reports severe corruption. The simple comparison
between municipalities that were audited before and after the elections fails to account for
these differential effects, which on average may cancel each other out. Secondly, because the
media is used as a vehicle for disseminating these audit findings, one would expect the audit
policy to have a differential effect in regions where local media is present to help diffuse the
audit reports.
To address these issues, we use the audit reports to construct an objective measure of
corruption for each audited municipality.5
Although we only know the extent of corruption
for municipalities that have been audited, the timing of the 2004 election and the release
of the audit reports allow us to measure corruption levels for a group of municipalities that
were audited but had their corruption reports released only after the election. Because the
order in which municipalities are selected is random, this group of municipalities constitute a
valid counterfactual for the effect of information disclosure. Thus, we measure the program’s
effect by comparing, among the audited municipalities, those whose reports were released
prior to election to those whose reports were released after the election, allowing the effect
to vary by the degree of corruption and the availability of local media.
Our main findings are as follows. We begin by showing that the electoral performance
of incumbent mayors that were audited before the elections, while slightly worse, was not
significantly different from the electoral outcomes of mayors that were audited after the
election. However, when we account for the level of corruption that was revealed in the audit,
we find that the effect of the policy was considerable. For every additional corrupt violation
reported, the audit policy reduced the incumbent’s likelihood of re-election by approximately
20 percent. The effect of the policy was similar for other measures of electoral performance,
5
such as the change in vote share and margin of victory. These results suggest that voters not
only care about corruption, but once empowered with the information, update their prior
beliefs and punish corrupt politicians at the polls.6
Furthermore, in those municipalities with local radio stations, the effect of disclosing
cor-ruption on the incumbent’s likelihood of re-election was more severe. Among municipalities
with local radio, for an additional corruption violation, the release of the audits decreased
the probability of re-election by approximately 15.7 percentage points, which represents a
40 percent decline from re-election rates among the control municipalities. Although radio
exacerbates the audit effect when corruption is revealed, it also promotes non-corrupt
in-cumbents. When corruption was not found in a municipality with local radio, the audit
actually increased the likelihood that the mayor was re-elected by as much as 20 percentage
points.
In effect, these results indicate not only that the disclosure of information enhances
po-litical accountability but that the interpretation of this information is ultimately influenced
by the prior beliefs of voters. On average voters do share the initial belief that politicians
are corrupt, and only punish those incumbents who were discovered to have “surpassed” the
median level of corruption. When no corruption was revealed and voters had overestimated
the incumbent’s corruption level, the incumbent was rewarded at the polls. Interestingly, in
areas without local radio, voters tend to systematically underestimate the corruption level
of the incumbent, indicating that local radio also influences prior beliefs. Together these
results highlight how media can profoundly affect political outcomes both in the screening of
politicians and in conditioning individual beliefs. The analysis suggests that the media
in-6
fluences the selection of good politicians both by exposing corrupt politicians and promoting
good ones (Besley 2005).
Our findings contribute to a growing literature that examines the effectiveness of
anti-corruption programs. Di Tella and Schargrodsky (2003) study the impact of a anti-corruption
crack-down in the city of Buenos Aires. Using an auditing process induced by a change in
government, they find that an increase in monitoring decreases the price public hospitals
pay for inputs. Yang (2006) shows that the adoption of pre-shipment inspection programs
on imports is associated with a 6-8 percentage point annual increase in the growth rate of
import duties. Because these programs are also associated with both increases in imports
and declines in the misreporting of goods classification, he concludes that the increase in
imports duties is likely a result of a reduction in customs corruption. Reinikka and Svensson
(2005) analyze the effects of an information campaign designed to reduce the diversion of
public funds transferred to schools in Uganda. Using a difference-in-difference approach,
they compare the capture of public funds in schools with access to newspapers to schools
without access to newspapers before and after a large anti-corruption campaign. They find
that schools with newspaper access received, on average, 13 percent more of their
entitle-ment. They conclude that information allowed parents and teachers to exert pressure on
local politicians and decrease corruption. Our paper, although related through the
informa-tion disseminainforma-tion mechanism, uses an identificainforma-tion strategy based on randomized control
methodology to control for any potential confounds associated with the endogenous
acquisi-tion of informaacquisi-tion. In a related and important paper, Olken (2005) conducts a randomized
field experiment in 608 Indonesian villages to analyze how different monitoring mechanisms
might reduce corruption in infrastructure projects. His findings suggest that central auditing
mechanisms are more effective to control corruption when compared to grassroots
participa-tion monitoring. We see our paper as complementary to these studies by providing evidence
through an alternative mechanism: reducing asymmetrical information in the political
pro-cess to enable voters to select better politicians.7
This paper is also related to the literature that explores the role of media in shaping public
policy and influencing the political process. Several papers use cross-country data and show
a positive association between a free, well-developed media and good governance (Brunetti
and Weder (2003); Ahrend (2002)). Nonetheless these studies do not provide evidence on the
specific ways in which media availability promotes good governance.8
Recent contributions
have started to fill this gap. Besley and Burgess (2002) focus on the role of the media
in mitigating political agency problems by providing information to voters. They analyze
the relief of shocks in India and show that in places with newspapers, governments are more
responsive. In a related paper, Stromberg (2004) suggests that U.S. counties with more radio
listeners received more relief funds from the New Deal program. His results are consistent
with a theory in which politicians target resources to voters who are better informed.9
Our
results contribute to this literature by demonstrating the specific impacts of the media upon
political accountability.
The remainder of the paper is organized as follows. Section 2 presents a simple theoretical
framework to understand how information might affect political accountability. Section 3
then provides a brief background on Brazil’s anti-corruption program, and a description of
the data used in the analysis. Our empirical strategy is discussed in Section 4, and the
paper’s main empirical findings are presented in section 5. Section 6 concludes the paper.
7
See Besley (2005) and Besley, Pande, and Rao (2005) for a discussion on political selection. 8
Besley, Burgess, and Pratt (2002) state that there is comparatively little work in the political economy literature that scrutinizes the role and effectiveness of the media in fulfilling this function. There is however a nascent yet related literature on the effects of media on corporate governance. See Dyck and Zingales (2002) for an interesting paper on this topic.
9
2
Theoretical Framework
In this section, we present a simple theoretical framework to guide the interpretation of our
empirical findings. Our model, which is based on Majumdar, Mani, and Mukand (2004) and
similar to those presented in Persson and Tabellini (2000) and Alesina and Tabellini (2006),
is a simple adaptation of the standard political agency models. This class of models, where
voters have limited information about the incumbent’s type or behavior, provides a natural
environment to examine the value of information in promoting political accountability.
2.1
A Simple Model
Consider a society comprised of informed and uninformed voters. Voters have linear
pref-erences over a single policy g, which is affected by both the incumbent politician’s effort e
and his type τ. The random variableτ measures the politician’s propensity to be good (or
non-corrupt) and, like the politician’s effort, is unobserved by the voters. Voters do however
have prior beliefs about the politician’s type based on the knowledge that τ is distributed
normally with mean ¯τ and variance στ. The policy outcomeg is thus defined as,
g =e+τ+ν
where ν is a productivity shock, which is distributed N(0, σν) and is uncorrelated with τ.
While all voters observe policy outcome g, only informed voters also observe ν. In this
additive setting, all else held constant, voters prefer less corrupt politicians (higherτ), since
this would imply a higher policy outcome g.
Besides preferences over government policy, voters possess an ideological preference δ
in favor of the incumbent mayor. We further assume that the parameter δ is distributed
uniformly over the interval [−1 2ξ,
1
citizen compares his estimate of the incumbent’s type and ideological preferences to his prior
beliefs,
E[τ|Ω] +δ >¯τ
where E[τ|Ω] is the voter’s posterior belief of the incumbent’s type given his information
set, Ω. Thus for given realizations of g andν and the distribution of δ, the incumbent’s vote
share is given by,
π = 1
2 +ξ[α(E[τ|g, ν]−τ¯) + (1−α)(E[τ|g]−τ¯)] (1)
where α is the proportion of the population that is informed.
Given this simple setup, the timing of the events is as follows. In beginning of the
pe-riod, the incumbent politician, whose objective is to maximize the probability of re-election,
chooses the level of effort, e, before knowing his type τ.10
Nature then reveals the value
of τ and ν, determining the outcome policy, g. Observing only their own utility, voters are
forced to make inference on the incumbent’s type. Elections are held. If the incumbent wins,
his type τ is maintained. Otherwise, the challenger enters office with a τ that is randomly
drawn from the same normal distribution.
To compute the posterior beliefs of the voters, we assume that voters update their beliefs
according to Bayes’ rule.11
Given our distribution assumptions, the expected mean of an
10
The assumption that the incumbent does not know his own type is admittedly strong. This simplifying assumption allows us to avoid issues associated with politicians using their effort level to signal their type. See Persson and Tabellini (2000) and Besley (2004) for a discussion of political agency models that assumes both moral hazard and adverse selection.
11
uninformed voter’s posterior beliefs is
E[τ|g] = hττ¯+hν(g−e
∗)
hτ +hν
(2)
wherehτ =
1
στ andhτ =
1
σν, ande
∗ denotes the voters’ expectation of the incumbent’s effort
which is realized in equilibrium. For informed voters, who observe ν, their posterior beliefs
can be expressed as follows,
E[τ|g, v] =g−e∗−v. (3)
Inserting equations 2 and 3 into 1, an incumbent of type τ wins the election if he receives
a majority of the votes, i.e.
ξ
α(τ −τ¯) + (1−α)
hτ¯τ+hν(τ+ν)
hτ +hν −
¯
τ
>0.
Therefore, the probability that an incumbent of type τ wins is given by
1−Φ
− τ −¯τ
(1−α)√hν
(α(hτ+hν) + (1−α)hν)
(4)
where Φ is the cdf of the standard normal distribution. The probability of re-election is thus
increasing in the politician’s type, τ, and exceeds 0.5 when τ −τ >¯ 0.
Equation 4 implies that the effect of more information on political accountability will
de-pend on voters’ initial priors. Providing information to the voters (i.e. increasing proportion
of informed voters,↑α) will increase the probability of re-election if the politician’s expected
type exceeds the voters’ beliefs (τ−τ >¯ 0) but decrease the probability of re-election if
vot-ers’ had overestimated the politician’s type (τ −τ <¯ 0). Moreover, whether voters over or
underestimate the corruption level of the politician is likely to depend on the information
our empirical strategy.
In effect, this simple model provides clear empirical predictions. Unless voters
systemat-ically over or underestimate the incumbent’s corruption level, the simple average treatment
effect of the audits may be undetermined, and will expectedly vary according to the level of
reported corruption. The average effect will likely be negative at higher levels of reported
corruption, and presumably positive at zero levels of reported corruption.
3
Background and Data
3.1
Brazil’s anti-corruption program
In May 2003 the government of Luiz In´acio Lula da Silva started an unprecedented
anti-corruption program based on the random auditing of municipal government’s expenditures.12
The program, which is implemented through the Controladoria Geral da Uni˜ao (CGU), aims
at discouraging misuse of public funds among public administrators and fostering civil society
participation in the control of public expenditures. To help meet these objectives, the findings
from each audit are posted on the internet and released to the media. The following quote
from President Lula, extracted from the program’s inaugural speech, emphasizes this: “I
think the Brazilian society needs to understand once and for all, that we are only going to
be able to truly fight corruption when the civil society, with the instruments made available,
can act as a watch dog.”13
The program started with the audit of 26 randomly selected municipalities, one in each
state of Brazil. It has since expanded to auditing 50 and later 60 municipalities per lottery,
from a sample of all Brazilian municipalities with less than 450,000 inhabitants.14
The
12
In Portuguese the program is calledPrograma de Fiscaliza¸c˜ao a partir de Sorteios P´ublicos. 13
Authors’translation. The speech is available at www.presidencia.gov.be/cgu. 14
lotteries, which are held on a monthly basis at theCaixa Econˆomica Federal in Brasilia, are drawn in conjunction with the national lotteries. To assure a fair and transparent process,
representatives of the press, political parties, and members of the civil society are all invited
to witness the lottery.
Once a municipality is chosen, the CGU gathers information on all federal funds
trans-ferred to the municipal government from 2001 onwards. Approximately 10 to 15 CGU
auditors are then sent to the municipality to examine accounts and documents, to inspect
for the existence and quality of public work construction, and delivery of public services.
Auditors also meet members of the local community, as well as municipal councils in order
to get direct complaints about any malfeasance.15
After approximately one week of
inspec-tions, a detailed report describing all the irregularities found is submitted to the central CGU
office in Brasilia. The reports are then sent to the Tribunal de Contas da Uni˜ao (TCU), to
public prosecutors, and to the municipal legislative branch. For each municipality audited, a
summary of the main findings is posted on the internet and disclosed to main media sources.
It is from these reports that we construct an objective measure of corruption.
3.2
Measuring Corruption from the Audit Reports
In this section we describe how we use the audit reports to construct an objective measure
of corruption. As of July 2005, reports are available for the 669 municipalities that were
randomly selected across the first 13 lotteries.16
Each report contains the total amount of
federal funds transferred to the current administration and the amount audited, as well as, an
itemized list describing each irregularity, in what sector it occurred (e.g. health, education,
etc.), and in most cases the amount of funds involved.
15
These auditors are hired based on a competitive public examination and they receive competitive salaries. Prior to going on the field, they receive extensive training on the specificities of the sampled municipality. Also, there is a supervisor for each team of auditors.
16
munici-Based on our readings of the reports, we codified the irregularities listed into several
categories; some indicating corruption while others simply exposing poor administration.17
We define political corruption to be any irregularity associated with fraud in procurements,
diversion of public funds, and over-invoicing.18
Although local corruption in Brazil assumes
a variety of forms, illegal procurement practices, diversion of funds, and the over-invoicing
of goods and services are among the most common violations found in the audit reports.19
Illegal procurement practices typically consist of benefiting friendly or family firms with
insider information on the value of the project, or imposing certain restrictions to limit
the number of potential bidders. This was the situation in Cacule, Bahia, where the call for bids on the construction of a sports complex specified as a minimum requirement for
participation that all firms needed to have at least R$100,000 in capital and a specific quality
control certification. Only one firm called Geo-Technik Ltda., which was discovered to have
provided kickbacks to the mayor, met this qualification. While some procurement practices
manipulate the process in favor of firms that offer potential kickbacks, other strategies are
more blatant forms of fund diversions. In S˜ao Francisco do Conde, Bahia, for example, a health contract of R$308,000 was awarded to a phantom firm: a firm that only exists on
paper.
Other dominant forms of corruption include mayors diverting funds intended for
educa-tion and health projects towards private goods, (e.g. the purchase of cars, fuel, apartments,
or payment of their friends’ salaries) or simply over-invoicing goods and services. For
exam-17
We also used an independent research assistant to code the reports in order to provide a check on our coding. See Ferraz and Finan (2006) for more details on how we coded the audit reports.
18
Specifically, we define aprocurement to be irregularif: i) a required procurement was not executed; ii) the minimum number of bids was not attained; iii) there was evidence of fraud in the procurement process (e.g. use of bids from non-existing firms). We categorizediversion of public fundsas any expenditure without proof of purchase or provision and/or direct evidence of diversion provided by the CGU. Finally, we define
over-invoicing as any evidence that public goods and services were bought for a value above the market price.
19
ple, inParanhos, Mato Grosso do Sul, R$189,000 was paid to implement a rural electrification project. As it turns out, the mayor owned one of the farms benefitted by the project.
Over-invoicing is typically found in the provision of medical supplies and the construction of public
works.
These types of practices have not only been shown to be the most common forms local
politicians find to appropriate resources, but in many instances they are not necessarily
mutually exclusive (see Trevisan, Antoninho M. et al. (2003)). In effect, over-invoicing
and illegal procurement practices often serve as vehicles for funds diversion. As such, we
combined indicators of these three categories to best capture the municipality’s corruption
level. Specifically, we sum up for each municipality all the irregularities associated with each
of these three categories and define this as our measure of corruption.20
3.3
Complementary Data Sources
Three other data sources are used in this paper. The political outcome variables and mayor
characteristics come from the Tribunal Superior Eleitoral (TSE), which provides results for
2000 and 2004 municipal elections. These data contain vote totals for each candidate by
municipality, along with various individual characteristics, such as the candidate’s gender,
education, occupation, and party affiliation. With this information, we matched individuals
across elections to construct our main dependent variable - whether the incumbent mayor
was re-elected - as well as other measures of electoral performance such as vote shares and
win margin.
To capture underlying differences in municipal characteristics, we relied on two surveys
from the Brazilian Institute of Geography and Statistics (Instituto Brasileiro de Geografia e
Estat´ıstica (IBGE)). First, the 2000 population census provides several socioeconomic and
20
demographic characteristics used as controls in our regressions. Some of these key variables
include per capita income, income inequality, population density, share of the population
that is urban, and share of the population that is literate. Second, to control for different
institutional features of the municipality, we benefited from a 1999 municipality survey,Perfil dos Munic´ıpios Brasileiros: Gest˜ao P´ublica. This municipal survey characterizes not only various aspects of the public administration, such as budgetary and planning procedures,
but also more structural features such as the percentage of roads that are paved, whether
the municipality has a judge, among others. Moreover, the survey provides our key measures
of the availability of media, namely the number of radio stations and the number of daily
newspapers. The richness of this dataset allows us to comprehensively check the validity of
our research design, and control for any potential confounding factors in the regressions that
do not entirely rely on the randomization.
Basic descriptive statistics of our corruption measure, electoral outcomes, and
munici-pal characteristics are presented in Table 1. Besides providing background on the average
municipality’s socio-economic and political characteristics, the table also reports, as a check
of the randomization, whether any systematic differences exist between municipalities
au-dited before and after the elections. Column 1 presents the mean for the municipalities that
were audited after the election (control group), while Column 2 presents the mean for the
municipalities that were audited prior to the election (treatment group). The difference in
the group means are reported in Column 3, and the standard errors of these differences are
presented in Column 4.
Panel A and B document the political outcomes and characteristics of the mayors in our
sample. Re-election rates for the past two elections have been roughly 40 percent among the
incumbent mayors that are eligible for re-election.21
While it might appear that Brazilian
21
mayors do not enjoy the same incumbent advantage that is reputed in other countries,
election rates do increase to 59 percent when conditioned on the mayors that ran for
re-election (approximately 70 percent of all eligible mayors, see Column 1). Re-re-election in most
municipalities of Brazil requires only a relative majority, and yet on average elected mayors
win with over 50 percent of the votes. Even though 18 political parties are represented in
our sample, over 70 percent of the elected mayors belong to one of the 6 parties presented in
Panel B, and on average only 3 political parties compete within a particular municipality.
The municipalities in our sample tend to be sparsely populated and relatively poor (see
Panel C). The average per capita monthly income in our sample is only R$204 (US$81),
which is slightly less than the country’s minimum wage of R$240 per month. Approximately
38 percent of the population of these municipalities live in rural areas, and only 21 percent
of the adult population is illiterate. Local AM radio stations exist in only 27 percent of the
municipalities; among those municipalities with an AM radio station the average number of
radio stations is 1.32.
The characteristics summarized in panels A-C are well-balanced across the two groups of
municipalities. There are no significant differences across groups for any of the characteristics
presented in the table, at a 5 percent level of significance.22
In fact, out of 90
character-istics, only three variables - the number of museums, whether the municipality has a local
constitution, and whether the municipality has an environmental council - were significantly
different between the two groups of municipalities. Including these three characteristics in
the regressions do not affect the estimated coefficients.
The last couple rows of Table 1 present the constructed corruption measure and the
average amount of federal funds audited. The program audited approximately 5.5 million
reais per year and found that municipal corruption is widespread in Brazil. At least 73
22
percent of the municipalities in our sample had an incidence of corruption reported, and the
average number of corrupt irregularities found was 1.74. Municipalities that were audited
after the elections tend to be slightly more corrupt than those audited before the election,
but this difference is small and statistically indistinguishable from zero.
For a better sense of the corruption measure, Figure 1 presents the distributions of
re-ported corruption for municipalities that were audited before and after the elections. As this
figure depicts, the mass of the distribution falls mostly between 0 and 4 corrupt violations,
with less than 6 percent of the sample having more than 4 corrupt violations. As with the
comparison in means, the distributions of corruption between the two groups are also fairly
well balanced. At each level of corruption, none of the differences in distributions are
sta-tistically significant at a 10 percent level. This comparison further validates not only the
program’s randomized auditing, but also the integrity of the audit process.23
4
Estimation Strategy
Based on the theoretical model presented above, we are interested in testing whether the
release of information about the extent of municipal government corruption affects the
elec-toral outcomes of incumbent mayors. The ideal experiment to test this would consist of
auditing municipalities to record their corruption levels and then releasing this information
to voters in a random subset of municipalities. For any given level of corruption, the simple
comparison of the electoral outcomes in municipalities where information was released to
those where no information was released estimates the causal effect of disclosing information
about corruption on voting patterns. In practice however, this experiment is both unethical
and politically infeasible. Our research design, which exploits the random auditing of the
23
anti-corruption program and the timing of the municipal elections, is perhaps the closest
approximation to such an experiment.
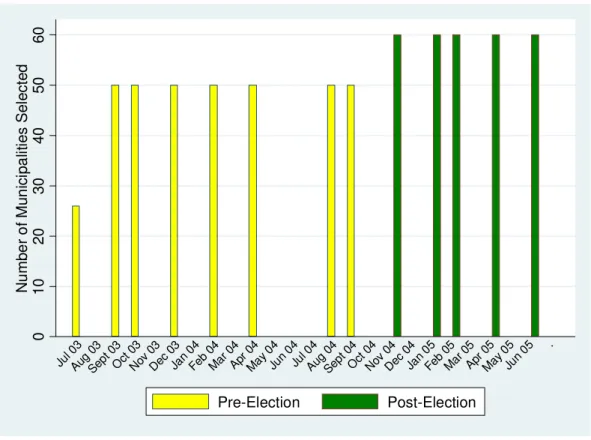
Figure 2 depicts the timing of the release of the corruption reports. Prior to the October
2004 municipal elections, the Federal government had audited and released information on
the corruption levels of 376 municipalities randomly selected across 8 lotteries. After the
municipal elections, audit reports for 300 municipalities were released, providing us with
information on corruption levels for two groups of municipalities: those whose corruption
levels were released prior to the elections - potentially affecting voters’ perceptions on the
mayor’s corruptness - and those that were audited and had their results released only after
the elections. Since municipalities were selected at random, the set of municipalities whose
audit reports were only made available after the elections represent a valid control group.
Furthermore, by restricting our analysis to include only municipalities that were audited, we
are able to construct a measure of corruption for each municipality and thus account for the
opposite effects that positive and negative corruption reports might induce.24
In this section we proceed as follows. Under the assumption that the audits of
munici-palities before the elections did not affect the electoral outcomes of municimunici-palities audited
after the elections, we compare electoral outcomes in municipalities that were audited before
and after the elections to estimate the average effect of the audit policy. We then investigate
how the effect of the program varies with the information revealed and the availability of
media outlets. Given the use of the media to disseminate the audit results, one might expect
the program to have a more significant impact on electoral outcomes in areas where more
corruption is revealed and local media is present to diffuse such information.
24
Basic Models
To estimate the average effect of the audit policy on electoral outcomes, we begin with the
following reduced-form model
Ems=α+βAms+Xmsγ+νs+εms, (5)
where Ems denotes the 2004 electoral performance of an incumbent mayor eligible for
re-election in municipalitymand states,Amsis an indicator for whether or not the municipality
was audited prior to the October 2004 elections, Xmj is a vector of municipality and mayor
characteristics that determine electoral outcomes,νsis a state fixed effect andεmsis a random
error term for the municipality.25
Because of the randomized auditing, the coefficient β
provides an unbiased estimate of the average effect of the program on the electoral outcomes
of the incumbent politician, capturing both the effect of being audited and the public release
of this information.
Although estimation of equation 5 relies only on the 2004 election results, for some
electoral outcomes, such as the mayor’s vote share and margin of victory, we can also measure
the incumbent’s performance in the previous 2000 election. Thus, we exploit this additional
information to compare changes in electoral outcomes using the following specification:
∆Ems =Emst−Emst−1 =α+βAms+Xmsγ+εms, (6)
where ∆Ems denotes the difference in the mayor’s electoral performance between the 2000
and 2004 elections. Consequently, β measures the effect of the audit on the change in the
25
mayor’s electoral outcome, ∆Ems. Note that while the identification of β still stems from
the randomized policy, by estimating a change in outcomes, we are implicitly removing any
time invariant determinants of voter behavior across municipalities. Moreover, with state
intercepts, this specification controls for any unobserved state-specific shocks affecting the
change in electoral outcomes.
Differential Effects across Corruption Levels and Media
The specifications presented in equations 5 and 6, while providing estimates of the average
effect of the audits, ignore that the effect of a publicly released audit may depend on the
information disclosed. An audit revealing extensive corruption should have a markedly
different effect on an incumbent’s re-election chances than one that reports no corruption.
To test for this differential effect, we estimate a model that includes an interaction of whether
the municipality was audited prior to the elections with the level of corruption discovered in
the audit:
Ems = α+β0Cms+β1Ams+β2(Ams×Cms) +Xmsγ+νm+εms, (7)
where Cms is the number of corrupt irregularities found in the municipality. In this model,
the parameterβ2 estimates the causal impact of the policy, conditional on the municipality’s
level of corruption.
Another potentially important source of variation is the availability of media in the
municipality. A critical design feature of the policy is the use of mass media to divulge
the results of the audit. If the government audits and media serve as complements then we
would expect a more pronounced effect in areas with a local media. On the other hand, if in
areas with media the public is already informed about the extent of the mayor’s corruption
function as substitutes. In this situation, we might expect the audits to have had a more
significant impact in areas without media. To test these two competing hypotheses, we
augment the specification in equation 7 with a set of terms to capture the triple interaction
between whether the municipality was audited, its corruption level, and its availability of
local media:
Ems = α+β0Cms+β1Ams+β2Mms
+ β3(Ams×Mms) +β4(Ams×Cms) +β5(Mms×Cms)
+ β6(Ams×Cms×Mms) +Xmsγ+νm+εms. (8)
Our measure of media, Mms, in this specification is the number of AM radio stations that
exist in the municipality. For the majority of municipalities in Brazil, radio is the most
important source of information on both local politics and federal news (Dunn 2001). We also
experiment with the number of newspapers in the municipality as an alternative measure of
media, even though in Brazil the printed press is not a widely used source of local information.
With this model, the main parameter of interest β6 captures the differential effect of audits
by the level of corruption reported and the number of radio stations in the municipality.
5
Results
5.1
Measuring the Average Effect of the Audits on Electoral
Out-comes
We begin this section by presenting estimates of the average effect of the audit policy on
various electoral outcomes. Panel A of Table 2 presents regression results from estimating
incumbent was re-elected in the 2004 elections. The results presented in Columns 1 and 2 of
Panel A are estimated for the sample of incumbent mayors who were eligible for re-election in
2004, whereas Columns 3 and 4 of Panel A consider only those mayors who actually ran for
re-election.26
The first specification (Column 1) controls for state fixed-effects but excludes
other control variables. Column 2 presents an extended specification that includes various
municipal and mayor characteristics. Columns 3 and 4 simply replicate the specifications
presented in Columns 1 and 2 for the other sample.27
The results in panel A suggest that the audits and the associated release of information
did not have a significant effect on the election probability of incumbent mayors. While
re-election rates are 3.6 percentage points lower in municipalities that were audited prior to the
elections (Column 1 of Panel A), we cannot reject that this effect is not statistically different
from zero (standard error is 0.053). The inclusion of municipal and mayor characteristics
(Column 2 of Panel A), which should absorb some of the variation in the error term, does
not alter the estimated effect or the estimated precision. Restricting the sample to include
only mayors that ran for re-election provides similar results (Columns 3 and 4 of Panel A).
Even though the audits do not appear to have significantly affected re-election
probabil-ities, winning the election is a discontinuous outcome. The program might have impacted
other measures of electoral performance such as vote shares and margin of victory, without
ultimately affecting the election outcome. Panel B displays the results of estimating equation
5 using vote share and win margin as dependent variables.28
As in the case of re-election
rates, we do not find any evidence that vote share (see Columns 1 and 2 of Panel B) or
mar-gin of victory (see Columns 3-4 of Panel B) differed systematically between municipalities
26
Only 60 percent of the all Brazil mayors were eligible for re-election in 2004. The remaining 40 percent, which had been elected to a second term in 2000, were not eligible for re-election under the Brazilian constitution which limits member of the executive branch to two consecutive terms. See Ferraz and Finan (2006) for a description of term limits in Brazil and its potential effects on corruption.
27
Also note that the sample has been restricted to the non-missing observations of the various control variables, so as to keep its size constant across specifications.
28
audited before and after the elections.29
In Panel C we present estimates of the regression model presented in equation 6. This
model exploits additional information on electoral outcomes from the 2000 elections to
con-trol for any unobserved time invariant characteristics of the mayor and municipality, as well
as any state-specific shock to the change in voting sentiment between 2000 and 2004. Even
with this alternate model, we find only minimal evidence that the audit policy affected the
change in vote share or margin of victory from the 2000 to 2004 elections. The change
in vote share is 3.2 percentage points lower in municipalities audited prior to the elections
(Column 2 of Panel C), and statistically significant at 90 percent confidence. Even though
this estimate implies a 52 percent decline from a baseline of -.057, overall the results are less
than convincing. In effect, the results presented in Table 2 show that the audits and its
re-lease of information on corruption levels had on average only a minimal effect on subsequent
electoral outcomes.
The lack of evidence documenting an average effect of the anti-corruption policy on
electoral outcomes is to some extent expected. According to the theory, for the audits to
negatively (or positively) affect re-election outcomes voters would have had to systematically
underestimate (or overestimate) the incumbent’s corruption level. But how the information
from the audits compares to voters’ priors is likely to depend on the information disclosed.
Audits that do not reveal corruption may produce positive effects on electoral outcomes that
on average cancel out the negative effects induced by audits revealing extreme corruption.
The simple comparison between municipalities audited pre and post election ignores not only
this possibility, but also the potential effect media has in disseminating the information.
Be-cause the program was designed to release the audit results to the public using the media, the
release of information on corruption may not have reached as many voters in municipalities
29
where local media sources are not available. To account for these program characteristics,
we can exploit the fact that we observe the corruption level of audited municipalities to test
for a differential effect of the program that captures both the role of media and the level of
corruption revealed. Because of the random release of the audit reports, causal inference can
still be made conditional on the municipality’s corruption level.
5.2
Testing for Differential Effects across Corruption Levels
This section investigates whether the policy’s effect varies according to the extent of
cor-ruption found. To do so, we compare the electoral performance of incumbent mayors of
municipalities that were audited prior to the election to those audited after the election.
Because each municipality has been audited, we can construct objective measures of
cor-ruption for each of these municipalities, and then exploit the random timing of the audits
to estimate how the effect of the policy varies according to the level of corruption revealed.
Based on both graphical and regression analysis, we find that the disclosure of a report with
corruption did have a significant negative impact on the incumbent’s performance in the
2004 mayor elections.
Graphical Analysis
To get an understanding for how the dissemination of corruption information might affect
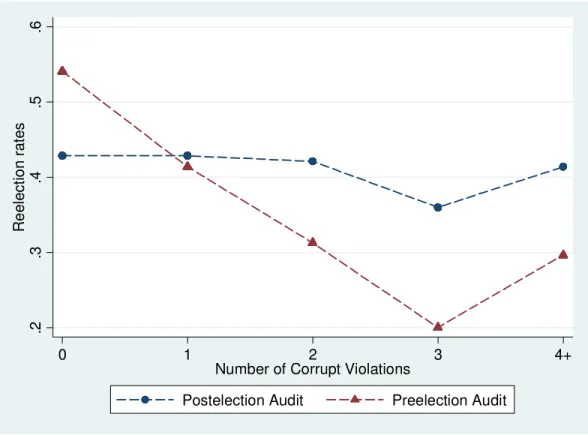
an incumbent’s electoral performance, Figure 3 illustrates the relationship between
corrup-tion and re-eleccorrup-tion rates. The figure plots the proporcorrup-tion of eligible mayors re-elected in
the 2004 elections against the level of corruption discovered in the audit, distinguishing
be-tween municipalities that were audited prior to the election (represented by a triangle) and
municipalities that were audited after the election (represented by a circle).30
30
Municipalities that were audited and had their findings disseminated prior to the
mu-nicipal elections exhibit a striking downward yet nonlinear relationship between re-election
rates and corruption. Among the municipalities where not a single violation of corruption
was discovered, approximately 53 percent of the incumbents eligible for election were
re-elected. Re-election rates decrease sharply as the number of corrupt irregularities discovered
approaches three, which is almost double the sample average of corrupt violations found.
In contrast to the municipalities where corruption was not discovered, re-election rates were
about 20 percent among municipalities where auditors reported three corrupt violations. For
municipalities with four or more violations, election rates increase slightly, but still
re-main low at less than 30 percent (10 percentage point below the sample average). In general,
the relationship suggests that voters do care about corruption, and hold corrupt politicians
accountable.
The sharply negative association between re-election rates and corruption among
mu-nicipalities that experienced a pre-election audit lies in stark contrast to the relationship
depicted for municipalities that underwent a post-election audit. With only a minor
excep-tion, re-election rates remained steady across corruption levels at close to the population
average of 40 percent. The comparison of these two relationships provides interesting
in-sights into both the effects of the policy and also voters’ initial priors. At corruption levels
of less than one (which is the sample median), voters’ prior beliefs appear to have
overes-timated the incumbent’s corruption level, as the audits may have increased an incumbent’s
likelihood of re-election. Beyond this crossover point, politicians are punished as voters have
systematically underestimated their corruption levels. This graph provides a first indication
that the audit policy may have not only impacted the incumbent’s likelihood of re-election
but that this impact depends on the severity of the corruption reported.
elec-toral performance:31
re-election rates for the sample of incumbent mayors that reran for
re-election, the change in the incumbent vote shares from 2000 to 2004, and the mayor’s
change in win margins from the 2000 to 2004 elections. Each figure demonstrates
relation-ships consistent with those depicted in Figure 3. Independent of the measure of electoral
per-formance, municipalities audited prior to the elections generally display a negatively sloped
association between electoral performance and corruption, which is not present among the
municipalities that were randomly audited post-election.
In effect, Figure 3 presents suggestive evidence that the dissemination of information
about corruption did lead to political accountability. The average voter appeared to have
had the prior belief that the incumbent committed approximately one corrupt violation.
Consequently, incumbents with less than one corruption violation were rewarded, and those
with more were punished. The figure also demonstrates two important patterns that deserve
econometric considerations. First, the effect of the policy is a function of the information
revealed, and second, voters may not necessarily respond to the announced corruption in a
linear fashion.
Regression Analysis
Table 3 provides a basic quantification of the relationship depicted in Figure 3. The
es-timation results are from a series of models based on equation 7, where the dependent
variable is an indicator for whether the incumbent was re-elected in the 2004 elections.
As in the previous table, the specifications presented in odd-numbered columns control for
state fixed-effects, but exclude any other control variables; whereas, the specifications in the
even-numbered columns control for an additional 20 municipal and mayor characteristics.
The models in Columns 1 and 2 assume a linear relationship between re-election rates
and corruption, but allow this relationship to differ between municipalities audited before
31
and after the elections. In these specifications, the point estimates suggest that the audits
had a differential impact of -3.8 percentage points. However, despite the fact that these
estimates represent a 9 percent decline in re-election rates, they are not statistically
signifi-cant at conventional levels. While it is possible that the audit policy did not illicit electoral
retribution, the patterns presented in Figure 3 suggest that a linear regression model might
be misspecified.
The models in Columns 3 and 4 present alternative specifications that include quadratic
terms for corruption and the interaction terms. As opposed to the linear specifications, these
models assume a quadratic relationship between the probability of re-election and corruption,
and in so doing allow for the up-tick in re-election rates at the higher levels of corruption.32
The estimates reported in these columns suggest that the quadratic terms do have some
predictive power (F-test= 2.58; P-value=0.08 on the quadratic terms) and improve the
models’ overall fit. In these specifications, the dissemination of the audit reports revealing
extensive corruption had a negative and statistically significant impact on the incumbent’s
likelihood of re-election. Among the municipalities where only one corruption violation was
discovered, which is approximately the intersection point in Figure 3, the dissemination of
this information reduced re-election rates by only 4.6 percentage points (F(1,348)=0.57;
P-value=0.45). In contrast, the audit policy reduced re-election rates by 17.7 percentage points
(F(1,348)=4.93; P-value=0.03) in municipalities where 3 corrupt violations were reported.
At sample means, a one standard deviation increase in reported corruption, the likelihood
of re-election is reduced by 12.2 percentage, or 30.2 percent.
Is the relationship between re-election rates and corruption levels u-shaped or does this
just reflect noise in the data? In Columns 5 and 6, we fit the linear model presented in
32
the first two columns to the subset of municipalities that had no more than 5 corrupt
violations, thus excluding 11 observations (5 from treatment and 6 from control). These
observations represent not only less than 3 percent of the sample, but corruption levels that
are almost 3 standard deviations away from the mean. With the removal of these outliers, the
point estimates increase substantially to almost double the original estimates, and become
statistically significant at the 10 percent level. The estimate on the interaction term is -0.071
(standard error 0.041; see Column 5), implying that for every additional corrupt violation
reported, the release of the audits reduced the incumbent’s likelihood of re-election by 17
percent. If we restrict the sample further, excluding municipalities with more than 5 corrupt
violations - less than 6 percent of sample - the point estimate on the interaction increases
even more to -0.090 (standard error = 0.042; see Column 7).
The remaining rows of columns 5-8 contain the estimated counterfactual relationship
between re-election rates and corruption. These estimates, which are close to zero and
statistically insignificant, expectedly reflect the fact that voters are uninformed about their
mayor’s corruption activities before voting at the polls. Moreover, comparing the estimates
in column 1 to those in column 5, we see that including these 6 highly corrupt mayors
in the sample creates a negative relationship between re-election rates and corruption in
control municipalities. In sum, with such few observations and the absence of a well-defined
relationship in the control municipalities, it appears that the lack of a statistically significant
effect reported in Columns 1 and 2 is mostly due to noise.
The Effect of the Audit Policy on Other Measures of Electoral Outcomes
Table 4 presents a series of models similar to those reported in Table 3, but estimate the
effects of the policy on other measures of electoral performance. These other electoral
that ran for re-election.33
Columns 1-3 of Panel A present three different models estimating the impact of the
policy on the probability of re-election for this selected sample of politicians. The linear
model estimated with a full set of controls is shown in Column 1, the quadratic model is
displayed in Column 2, and Column 3 reports the linear model but estimated among the
municipalities with no more than 5 corrupt violations. Columns 4-6 of Panel A re-estimate
these models using the incumbent’s margin of victory as the dependent variable. Panel B,
which is formatted similarly, presents the effects of the policy on the incumbent’s vote share
(Columns 1-3) and change in vote share (Columns 4-6).
Overall the coefficients of the key variables reported in Table 4 tell a similar story.
Dis-closing corruption had a negative effect on re-election rates, even among this select group
of incumbents. For an additional corrupt violation, the audits reduced the likelihood of
re-election by 14 percent (see Columns 1-3 of Panel A) from the baseline means. When we
estimate the effects of the audit policy on the other measures of electoral performance, the
re-sults remain consistent and statistically significant.34
For example, the estimates in Column
4 of Panel A imply that reporting an additional corrupt violation reduced the incumbent’s
margin of victory by 3.4 percentage points among municipalities that were audited prior to
the elections relative to those that were audited afterwards.
Additional Specification Checks
Political manipulations
The credibility of our research design stems from the fact that municipalities were audited
randomly together with the timing of the municipal elections. Even though it is unlikely that
the selection of municipalities was manipulated, one potential concern could lie in the actual
33
Interestingly, we find no evidence that the audit policy reduced the probability that the mayor would run for re-election. Results are available upon request.
34
audit process itself.35
If the audits conducted before the elections differed systematically to
those conducted after the elections, then our research design would be compromised.
The most obvious concern is if the auditors themselves were corrupt. This would
poten-tially cause systematic differences across the two groups because relative to mayors audited
after the elections, those audited before the elections would have a higher incentive to bribe
auditors for a more favorable report.36
There are at least four reasons why this is unlikely
to be the case. First, auditors are hired based on a highly competitive public examination,
and are well-paid public employees. Moreover, each team of auditors - and there is typically
one team per state - reports to a regional supervisor. Second, according to program officials,
there has never been an incidence in which auditors have even been offered bribes.37
Third,
had there been any manipulations of the audit findings, it is unlikely that the corruption
levels would have been balanced. But, as shown in Figure 1, the levels of corruption across
the two groups were well-balanced not only on average but at each point of the distribution.
Finally, the effects of the audit are identified using within-state variation. Given that there
is typically one team per state, we control for any potential differences in the audit process
across states.
If however the audits could be manipulated, then we might expect mayors that were
politically affiliated with either the federal or state governments to receive more favorable
audit reports, and particularly if audited before the elections. To test for this possibility,
Column 1 of Table 5 reports a model that regresses the number of corruption violations on
whether or not the municipality was audited prior to the elections, whether the mayor is
member of the governor’s political party, party dummies, and a full set of interaction terms.
35
Each random drawing was done jointly with the national lottery and witnessed by members of the media and government officials. As we also pointed out, the comparison of municipal and mayor characteristics does support the randomized selection.
36
This argument of course assumes that mayors audited after the elections do not have further re-election incentives.
37
From the results presented in Column 1, we do not find any evidence that mayors from the
same political party as the state governor or the federal government received a differential
audit (point estimate = -0.155, standard error = 0.256).38
Moreover, there are no differential
effects for any of the six major parties (P-value = 0.97).
Another possibility is that incumbents who won by narrow victories in the previous
election and thus have greater incentives to bribe the auditors received differential reports.
To test for this hypothesis, we extend the model presented in column (1) to control for
the incumbent’s margin of victory in the 2000 election and its interaction with whether the
municipality was audited prior to the elections. Again, we do not find any evidence that a
mayor’s level of political support influenced the audit process and in fact the point estimate
is of the opposite sign (coefficient -0.638 and standard error 0.865).
The remaining columns of Table 5 provide further evidence of the robustness of our
results. Columns 3-8 report the same set of models presented in Table 3, except that the
models control for the various political variables and interaction terms seen in Columns 1
and 2. These specifications allow us to examine whether these differences in corruption levels
- even if statistically insignificant - affect the estimated impact of the audit policy. However,
as seen in the table, the estimates of the effects of the program across corruption levels are
very similar to those presented in Table 3.
Placebo analysis
Table 6 presents another specification check of the research design. If the audit policy
had an effect on the 2000 electoral outcomes, then it would suggest that unobserved
char-acteristics of the municipality that determine the association between re-election rates and
corruption are driving the results presented in Table 3. Columns 1-4 report the differential
effect of the audit policy on the incumbent’s vote share in the 2000 elections, and columns
38
5-8 report the differential effect on the incumbent’s win margin in the 2000 elections.39
The
estimates presented in Table 6 suggest that the policy did not affect electoral outcomes in
2000. In each specification, the point estimates are close to zero and in some cases even
slightly positive.
To summarize, re-election rates are lower among municipalities that were reported to
have had higher level of corruption and were audited before the elections compared to
mu-nicipalities with similar corruption levels but were audited only after the elections. These
findings are robust to the inclusion of various municipal controls and are consistent using
alternative measures of electoral performance. We also do not find any evidence that the
audit process was politically manipulated. Overall, these findings suggest that the disclosure
of corruption practices, as produced by the audit policy, had a significant negative impact
on the electoral performance of incumbent mayors found to be corrupt.
5.3
Testing for Differential Effects of the Audits by Corruption
Levels and Media Availability
Thus far, we have demonstrated that the audit policy had a negative effect on the re-election
success of the mayors that were found to be corrupt. This reduced-form effect of the policy,
while well identified from a randomized design, does not reveal the underlying mechanisms
through which the policy operated. In this section however, we provide strong evidence
consistent with voters updating their beliefs and punishing corrupt politicians.
39
5.3.1 The Role of Media
Table 7 presents the estimation results from a variety of specifications based on the regression
model defined in equation 8. These specifications test whether the audit policy had a
differ-ential effect by both the level of corruption reported and the presence of local media, where
our measure of local media is the number of AM radio stations in the municipality. Radio is
the single most important source of information for local politics, and local programming is
mostly broadcasted on AM stations. With the exception of the additional interaction terms,
the columns correspond to the same set of specifications presented in Table 3.
The first set of rows shows how the effects of the audits varies by both the level of
corruption reported in the audit and the number of radio stations in the municipality. The
estimated effect is significant at conventional levels and suggests that the effects of audits
were much more pronounced in a municipalities that have both higher levels of reported
corruption and more radio stations.40
From the specification in Column 1, which excludes additional control variables but
does include state intercepts, the audit policy decreased the likelihood of re-election by 17.8
percentage points (F(1, 345)= 3.72, P-value=0.05), among municipalities with a radio station
and where the audits reported 3 corrupt violations. Although radio exacerbates the audit
effect when corruption is revealed, it also helps to promote non-corrupt incumbents. When
corruption was not found in a municipality with local radio, the audit actually increased the
likelihood that the mayor was re-elected by 18 percentage points (Column 1). Column 2
demonstrates that our estimates are robust to the inclusion of several municipal and mayor
characteristics.41
40
We find similar results when we use other measures of electoral performance and restrict the sample to mayors that ran for re-election.
41
Columns 3-8 provide further evidence that radio played a significant and complementary
role. The estimated effects of the audit are insensitive to both functional form and the
exclu-sions of the corruption outliers. In Column 3, the OLS estimates imply that at sample means,
the audits reduced re-election rates by 52 percent among municipalities with a radio station.
When the sample is restricted to municipalities with no more than 5 corrupt violations, the
point estimate on the triple interaction term increases to -0.14 (standard error=0.064).
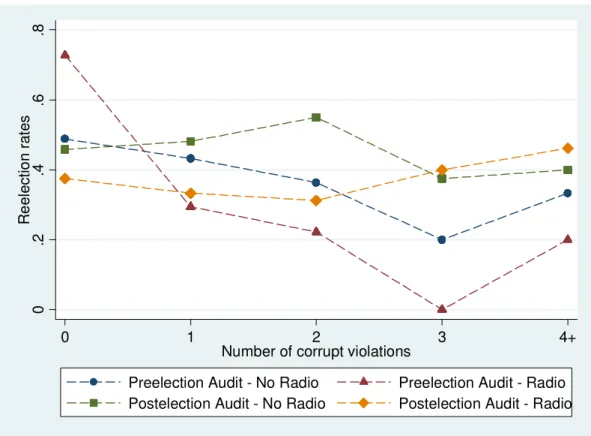
To get an even better sense for these estimates, Figure 4 plots the 2004 re-election rates
among eligible mayors against the number of corrupt violations found in the audit,
distin-guishing the relationship for four groups of municipalities: those with and without local radio
that were audited before and after the elections. For municipalities that were audited prior
to the election but are without a local radio station (depicted by a circle), there is slight
negative association between re-election rates and corruption, consistent with the effects
of the audit. However, when compared to municipalities audited prior to the election and
with local radio, we see clearly the significant role radio played in disseminating the audit
information. Among these municipalities (depicted by a triangle), re-election rates fall
dras-tically as the number of corruption violations increase. In fact, there exists a 47 percentage
point difference in re-election rates between non-corrupt mayors and mayors with at least
4 corruption violations. In comparing these two relationships, we also observe the electoral
advantage non-corrupt mayors of municipalities with local radio receive with an audit, as
there exists a 29 percentage point difference in re-election rates between municipalities with
and without local radio.
For municipalities audited post-election, there is little distinction by radio. Among these
municipalities, the relationship between re-election rates and corruption is relatively flat,
independent of the existence of radio. Only a level difference, consistent with an expected
positive association between media and electoral competition, distinguishes these two groups