This paper investigated the influence of the amount of superplasticizer and mineral adding - silica fume and basaltic filer - in plastic shrinkage and cracking of self-compacting concrete (SCC) mortars. Initially analysis was performed of the rheological behavior of cement paste and mor
-tars phases of the compositions of SCC. Then the deformations of mor-tars were measured by the effect of shrinkage and evaluation of cracking. On plastic shrinkage and cracking, the composition with silica fume showed superior results, independent of wind and superplasticizer content, relative to the composition with addition of basalt filler. However, the composition with silica fume showed superior results only in the tests with imposed ventilation at vertical plastic deformation. The rheological behavior affected directly the plastic shrinkage and cracking at early ages, fact confirmed by the analysis of capillary pressures of mortars tested.
Keywords: SCC, mortar rheology, plastic shrinkage, cracking.
Este artigo investigou a influência do teor de aditivo superplastificante e da adição mineral - sílica ativa e filer basáltico - na retração plástica e na fissuração de argamassas do concreto auto-adensável (CAA). Numa primeira fase foi realizada a análise do comportamento reológico das fases pasta e argamassa das composições de CAA. Em seguida, foram mensuradas as deformações das argamassas pelo efeito da retra
-ção plástica e avaliada sua fissura-ção. Tanto na retra-ção plástica quanto na fissura-ção, a composi-ção com adi-ção de sílica ativa apresentou resultados superiores, independente da ação do vento e teor de superplastificante. No entanto, no assentamento plástico, a composição com sílica ativa apresentou resultados superiores somente nos ensaios com ventilação imposta. O comportamento reológico afetou diretamente a retração plástica e fissuração nas primeiras idades, fato confirmado pela análise das pressões capilares das argamassas ensaiadas. Palavras-chave: CAA, argamassa, reologia, retração plástica, retração.
Rheological behavior study of plastic shrinkage
and cracking of self-compacting concrete mortars
Avaliação do comportamento reológico na retração
plástica e na fissuração de argamassas de concreto
auto-adensável
L. S. GIROTTO a girotto3@hotmail.com M. P. BARBOSA b mbarbosa@dec.feis.unesp.br G. F. MACIEL b maciel@dec.feis.unesp.br
a Departamento de Engenharia Mecânica, Universidade Estadual Paulista, Ilha Solteira, SP, Brasil. b Departamento de Engenharia Civil, Universidade Estadual Paulista, Ilha Solteira, SP, Brasil.
Received: 11 Feb 2013 • Accepted: 21 Jan 2014 • Available Online: 13 Feb 2014
Abstract
1. Introduction
1.1 Justification
The study of factors affecting the shrinkage of self-compacting concrete, such as the amount of fines, the low water/fine (w/f) ratio, the dosage of superplasticizer and the water/cement (w/c) ratio is important in the prevention of pathologies and the preservation of the lifetime of reinforced concrete structures.
The type of shrinkage - plastic, drying or autogenous - is one of the cracking causes in concrete structures, affecting their lifetime, de
-sign strength and increasing interference from aggressive agents. Concrete has a very low tensile strength at early ages and cracks may easily appear. The shrinkage is called plastic shrinkage when it occurs still in plastic state in concrete before setting time in the cement starts.
There is little information concerning the study of plastic shrink
-age cracking in self-compacting concrete. The main difficulties are caused by the lack of appropriate tests to obtain measurement of shrinkage and cracking due to the low range in which they occur. Some studies in this area, such as Turcry [1] and Vita [2], investi
-gated plastic and autogenous shrinkage on CAA.
This study investigated plastic shrinkage and cracking in CAA’s mor
-tar, aiming to investigate the influence of mineral additions (fine) with distinct reactivity and content of superplasticizer in the compositions, which are factors related to the materials composing the CAA and may directly intervene in plastic shrinkage cracking, ie, that occurs in plastic state, before the end of the material setting time.
The study was conducted using two strands: the first was dedi
-cated to the rheological study of paste and mortar phases, trying to verify with the rheology which rheological parameters are involved in determining the dosage of mineral admixture and superplasti
-cizer of paste and mortar of the CAA; the second was a study of shrinkage and cracking of mortar in plastic phase in two different climatic conditions: with and without wind.
1.2 Self-compacting concrete
It is called self-compacting concrete (SCC) the concrete which can fill the mold cavities with flow without segregation and thicken only by the gravity effect without any vibration or compaction.
Both viscosity and cohesion work together in order to prevent the occurrence of mixture segregation. The way concrete flows be
-tween the armor is provided by fluidity.
The self-compactability of SCC in fresh state can be characterized essentially by the following functional requirements: filling capac
-ity, resistance to the occurrence of segregation and ability to switch in narrow spaces [3].
The technology applied in the dosage and application of SCC is very widespread due to the constant research on the material. In 2010, the Brazilian standard on the SCC established application criteria, the NBR 15823:2010 [4].
Among the available measurement methods, the Repette-Melo
method [5], which was used in this work, stands out.
1.3 Paste and mortar rheology
Rheology is the science of materials which are called complex and can not be classified only as a gas, liquid or solid, aiming
to predict the force required to cause a deformation or flow in a material [6].
The monitoring of shear stress and/or shear rates applied to the material adds an important optic rheological to its characterization, especially when dealing with pastes and mortars.
Mortars are concentrated suspensions composed predominantly of fine aggregates mixed with reactive ones and water with content enough to be implemented in a fluid state. In some cases, inert fine, fibers and chemical additives are also incorporated into the compositions [7].
The concept of workability is employed to adjust the mortar dos
-age. However, since these materials may show different rheologi
-cal behavior, it is evident that the development of a methodology in formulating mortars based on microstructural/rheological concepts requires the definition of workability to be converted into measur
-able rheological quantities [7]. Thus, the characterization and the work ranges of materials would be best defined making reference to the greater reliability of the results obtained reducing the error
under the operator.
The rheological characterization techniques have as their basic principle to undergo fluids to efforts or controlled deformations [8]. Rheological methods can be classified as single point tests, which characterize the fluids in a single request condition, and multipoint tests, submitting systems to different requests [9].
Currently for multipoint tests, a rotational rheometer and “Squeeze
-flow” techniques are the most suitable in rheological characteriza
-tion of mortars. [9]
In this work it will be used rotational rheometer for rheological anal
-ysis and characterization of mortars.
The rotational rheometer is based on the analysis of viscosity and yield stress according to other variables such as temperature, time, etc. Mortar in the fluid state is described as heterogeneous biphasic suspensions with large particle size range (particles with 0.1 to 2000 μm range), whose rheological behavior is very complex due to the presence of forces with different natures in the system. [7] The biphasic nature of the mortar according to Agarwala [10] and Oliveira [11] is a result of the presence of particles in the field of intermolecular forces. Thus, the flow properties of the mortar are governed by the interaction of the set of large grains immersed in the fluid matrix.
The rheological characteristics of the material may influence its desired characteristics from hardening to cool stages. The rheo
-logical analysis of the mortar phase of SCC’s may explain the pa
-rameters that influence shrinkage and cracking.
1.4 Plastic shrinkage and cracking
Shrinkage is the reduction of volume in the case of concrete caused by water loss. There is no single type of retraction and this is the biggest complication. The shrinkage can happen from the first minutes of the material mixing or the structure lifetime [12]. The complexity of the issue is due to the shrinkage types, its causes and consequences, structures which are more susceptible to suf
-fer damage from shrinkage as well as the means to minimize it. Generally the features that combined make the concrete retract are: geometry of the structure, dosage of the material and cli
-matic conditions.
The concrete shrinks in two distinct moments: first in the plastic
2. Experimental program
2.1 Dosage study
The dosage was based on the Repette-Melo method [5] to produce two lines of self-compacting concrete mortar, one mortar with basal
-tic filer addition and another with silica fume addition. This method allows a production of pastes and mortars with a rational dosage of their constituents. Thus, the following steps were performed based on the experimental procedure described in the methodology: selec
-tion and characteriza-tion of material, determina-tion of the w/c ratio, rheological studies of the cement paste and mortar.
The starting point of the Repette-Melo methodology [5] to deter
-mine the water/cement ratio is by the association of resistance to compressive strength at 28 days of a conventional concrete com
-position, obtained by “dosage diagram” proposed by Helene [19] to Portland cement concrete.
The initial strength desired was 40 MPa, it removed the chart of
dosage on the 28th day for a composition made with cement CP II E-32 and w/c ratio of 0.44.
2.2 Pastes rheology
The silica fume and filer basaltic optimal proportions incorporated in the mixtures were found through fluidity test with Marsh Funnel and rheometric analysis using R/S Rheometer with coaxial cylin
-der geometry, controlling stress and therefore ensuring noninter
-ference on paste cohesion and flow properties. Temperature and relative humidity were kept strictly constant at 24 ± 1 °C and 40 ± 10%, respectively.
Silica fume and filler additions were made with percentage in
-crease over the weight of cement adding 2% at each step. How
-ever, after the passage of 10%, the increase used for filler addition points was 5% due to high fluidity in the first points of this addition. This procedure was repeated until there was no more flow into the Marsh funnel test.
A mortar and paste mixer with three speeds, a propeller paddle model, elevator bowl, and shift gear transmission was used for the mixtures. After 5, 15 and 30 minutes after the incorporation time of the ad
-ditive into the mix, conventional rheological tests and tests with Rheometer R/S were performed in order to verify the occurrence of fluidity loss, possible change in the saturation point and curve fitting supplied by the Rheo2000 software to a more appropriate rheological model.
2.3 Mortar rheology
Once defined the paste composition, the second step of the Repette-Melo methodology is the definition of mortar phase. Thus, the content of fine aggregate relative to the total volume of cement and the superplasticizer content were defined.
Mortar mixtures were prepared and the tests with mini-cone of abate
-ment, “V” funnel and rheometer tests were done - using the Vane propel
-ler for every composition which made it possible to obtain the rheological parameters and further adjustment of the curves to a rheological model. The amount of fine aggregate was altered at 40, 42.5 and 45% in relation to the total volume of mortar in order to determine an opti
-mum point for suitable deformability. When concrete is still in the plastic phase, quick drying in the fresh
state causes shrinkage when the rate of water loss from the sur
-face by evaporation exceeds the exudation of the water rate avail
-able [13]. This shrinkage is called plastic shrinkage as it occurs in the plastic state before the start of the cement setting time. The original mechanism for the plastic shrinkage to occur includes aspects involving evaporation and mass loss, capillarity, internal temperature, and consolidation of the material, thus being vertical deformations and longitudinal observed on the samples.
The consolidation and evaporation influence the angle of friction among the solid particles of the cementitious material as well as other parameters such as grain size and cement hydration, chang
-ing the shrinkage kinetics of the material.
The material internal temperature and the mass loss during shrink
-age also influence the kinetics of this phenomenon. In the first case the temperature discontinuity in relation to the outdoor temperature and the temperature of aggregates may lead to a temperature dif
-ferential that interferes in the shrinkage kinetics.
Another important factor in the analysis of shrinkage longitudinal deformation is the effect of chemical and minerals additives. Ac
-cording to Neville [14], setting retardant additives can result in higher concrete shrinkage in a plastic state.
As the shrinkage may happen due to free water removal of hydra
-tion or can be caused by fast drying of the surface due to inad
-equate protection, which can generate significant pressures on the capillary pores, these tensions among the material molecules may be enhanced by adding materials with very small diameters such as silica fume [15].
According to Holt and Leivo [16] the use of silica is one of the main reasons for shrinkage cracking. Its use is often tied to gain resis
-tance by decreasing the water/cement ratio, causing a shortage of water in cement chemical reactions which consequently generates high capillary pressures.
The crack in the early age is a result of material shrinkage. Neville [14] states the concrete is a fragile material to small perturbations in the early ages, both external and related to physical-chemical re
-actions of its components and this may cause premature cracking in the material. The author argues higher rates of cement in the mix and a higher water/cement ratio contribute for plastic shrinkage. In addition, when concrete temperature is in a high level compared to external temperature, the evaporation rate increases and plastic shrinkage may occur even though the relative humidity is high. Soroushian [17] states that plastic shrinkage cracking increases permeable void networks, exposing larger surface areas of con
-crete to aggressive environmental agents. It is known that the phe
-nomenon of plastic shrinkage cracking is dramatically influenced by exposure of the concrete surface to elements like wind, low relative humidity and increased temperature.
The Brazilian Standard DNIT 061/2004-TER [18] - “plastic shrinkage cracks are shallow cracks with small aperture (less than 0.5 mm) and limited length. Its incidence is usually random and it develops forming an angle of 45° to 60° with the longitudinal axis of the plate.” The plastic shrinkage cracking is a pathology more carefully stud
-ied and analyzed when it comes to SCC mortar. Because of its composition additives superplasticizers, setting retarders, among others, and the mortar has the embedded finest contents higher than in conventional concrete, just to suit the self-compacting char
height (Figure 2). The mass loss was accompanied with the read
-ing of the sample weight on a digital scale with 0.01 g precision. The superplasticizer and fine content have been adjusted to con
-form to the plasticity criteria adopted - Mini-cone abatement (op
-erating range between 200 mm and 280 mm) and flow time “V” Funnel (operating range between 5 and 10 s) [20].
The test environment had the same control and conditions during the procedure of cement paste. The same mixer was used to mix mortar. In order to characterize the phenomenon of plastic shrinkage and cracking based on rheological parameters, it was proposed to study the levels below and above the optimum levels obtained.
2.4 Plastic shrinkage
The horizontal and vertical deformation measurement device was based on the equipment used by Turcry [1].
The mold used for plastic shrinkage tests - Figure 1a - consists of a rectangular steel box with internal dimensions of 7x7x28 cm, perfo
-rated at their ends. Internally the mold receives a PVC jacket with a thickness of 0.3 cm and a polyethylene plastic covering 21 x 28 cm. The device has thin PVC plates which are 6.8 cm wide, 7.0 cm high and 0.3 cm thick at both ends. Three laser sensors - 2 mm range, 0.5 m resolution and response frequency ranging from 10 kHz to 15 kHz - make the measurement of transverse and vertical displacement - The metal mold allows water flow - controlled within its walls - with the aid of a heat bath TC-602 with digital control of water temperature (Figure 1b) - 24°C ± 1°.
The overall plastic shrinkage is determined by the sum of vertical displacement (settlement plastic) and horizontal displacement. The horizontal displacement is measured as soon as the mortar
is released in the mold. The side plates adhered to the mold sides
moving while the shrinkage occurs. This deformation is captured
by the laser sensors sides.
A thin 1x1-cm teflon plate is positioned to determine the vertical offset on the mortar surface. The relative accuracy of deformation is ± 0.01 µm.
The evolution of the mass loss by evaporation is also monitored during the measurement of plastic shrinkage. The test was per
-formed by filling a cylindrical shape with 10 cm diameter by 7 cm
Figure 1 – Device for measuring deformations of the effect of plastic shrinkage.
(a) Plastic shrinkage form, (b) thermal bath to water temperature control
A
B
The mortar temperature is controlled from a temperature sensor
immersed in the samples.
The device shown in Figure 3 was used to measure mortars capil -lary pressure.
A porous ceramic (Figure 3 (a)) connected to the pressure sensor by a silicone cylindrical tube was placed 35 mm from the sample surface which has the same dimensions as the mass loss test. The connection between the pressure sensor and its connecting pipe and ceramics were filled with water.
The tests began about 20 minutes after addition of water in the mixing process, and the data (plastic shrinkage, plastic settlement, internal temperature and capillary pressure) were recorded by a universal data acquisition module with intervals of 20 seconds, and mass loss with intervals of 2 seconds.
The test was performed during the setting time of samples for plastic shrinkage determination. The device PROCTOR was used
to determine the setting time of the SCC mortars, respecting the Brazilian standard NBR NM 9/2002 [21] concerning the method of penetration resistance.
The tests were conducted in an air-conditioned room with constant control of temperature and relative humidity at 24 ± 10 ° C and 40 ± 10%, respectively, in two different situations: with and without wind action on the shrinkage device (wind speed of approximately 5,0 m/s). The test time for the evaluation of plastic shrinkage was determined according to the material setting time.
2.5 Cracking
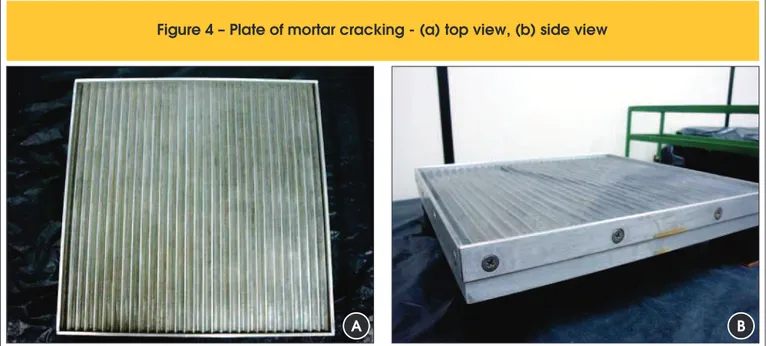
The equipment used for the evaluation of SCC mortar cracking consists in a metal plate of 20 cm² and 1 cm thick (Figs. 4a, 4b).
The bottom plate is symmetrically notched each tooth with 0.5 cm. The teeth favored the stimulus for cracking.
Figure 3 – Device for capillary pressure - (a) Details, (b) capillary pressure equipment test
o
B
Figure 4 – Plate of mortar cracking - (a) top view, (b) side view
The test preparation followed four steps: 1) Production SCC mor
-tar; 2) Launch of the mortar onto the plate; 3) Surface leveling; 4) Framework surface exposed and photo archival of each zone and areas most affected after the material setting time.
The measurement of the total area of the cracks was performed using the Image Tool software.
Besides the measurement of the crack characteristics, recordings were made of the cracking test from the launch time of the mortar until the end of the material setting time.
The filming was edited using the process called “time-lapse”. This is a cinematographic process in which each film frame is taken at a much slower rate than that in which the film was played.
The film preparation begins with the fixation of the camera - Nikon D90 - via tripod leveling bubble in two directions (Figures 5a, 5b). Then, the device adjustment is made - Wireless Shutter Boss Tim
-er Remote - Nikon DC-2 Connection - connected to the cam-era that fires a frame in every time set. The framework of the cracking mold and focus are manually done and then the film from mortar cracking is edited using Windows Movie Maker.
There is no standardization to establish the threshold for shrinkage cracks, corrosion, alkali-aggregate reaction, or any other due to chemical and physical phenomena related to the durability and struc
-ture lifetime, so two types of cracks were assumed: Type 1 - cracks down to 0.25 mm thick and Type 2 - cracks larger than 0.25 mm thick.
3. SCC Composition
3.1 Materials constituents
The fine aggregate used was medium sand from the river bed and the coarse aggregate was a basaltic rock (16mm), both from North
-western São Paulo. The sand had a measured density of 2.61 g/ cm³, with a characteristic maximum dimension of 4.75 mm and fineness modulus of 2.15 mm, according to ABNT NM 49/2001 [22] and NBR 7211/2009 [23], respectively. The basalt rock showed the density of 2.86 g/cm³, determined according to ABNT NM 53/2009 [24], with a characteristic maximum dimension of 19 mm and fine
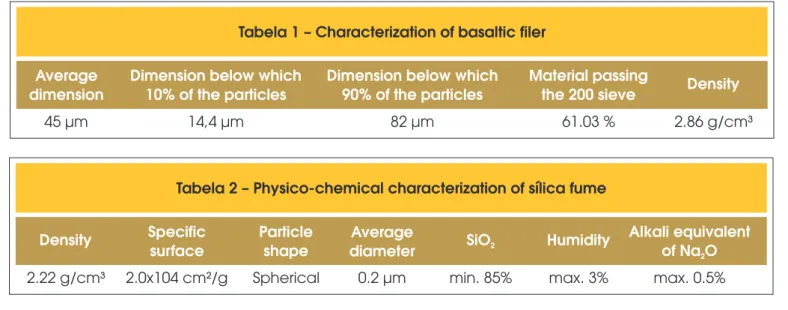
-ness modulusof 6.74 mm, according to NBR 7211/2009 [23]. Two types of mineral admixtures have been used in the manu
-facture of mortars: an inert addition - basalt filler - and silica fume addition arising from the manufacturing process of the metal silico or iron silico, with spherical and smooth microstructure and poz
-zolanic properties. Tables 1 and 2 show respectively the filer and silica psycho-chemical characteristics.
Figure 5 – Images capture equipment for time-lapse edition
A
B
Tabela 1 – Characterization of basaltic filer
Average
dimension
Dimension below which
10% of the particles
Dimension below which
90% of the particles
Material passing
the 200 sieve
Density
45 µm
14,4 µm
82 µm
61.03 %
2.86 g/cm³
Tabela 2 – Physico-chemical characterization of sílica fume
Density
Specific
The cement used was a CP II E-32. Table 3 shows the results of the cement characterization tests. The additive used was a third generation superplasticizer based on polycarboxylic ether whose technical data are presented in Table 4.
3.2 Dosage
As noted above, the SCC’s compositions were developed based on the Repette-Melo methodology [5], the first sample being elab
-orated with the basaltic filler addition and the second with silica fume addition. Both compositions were developed with equivalent
dosages varying only the amount of mineral admixture for compari
-son analysis of shrinkage and cracking. Table 5 summarizes the samples ratios mixtures and the compressive strength.
4. Results and discussion
4.1 Study of cement paste
Figures 6a and 6b show results of the Marsh Funnel test flow curve as a function of time vs. the percentage of silica fume and filler ad
-dition respectively. Note in these figures a change in slope for each curve determined in relation to the three periods of 5, 15 and 30 minutes, characterizing the loss of fluidity.
Based on the application and material work rate, the behavior of the rheological curves was fitted to a shear rate range between
50 and 150s-1. After analysis, the choice for Bingham rheological model was the best adhered to the results of cement pastes. Thus, the characterization is limited to this shear rate range which may vary according to the application type of the material.
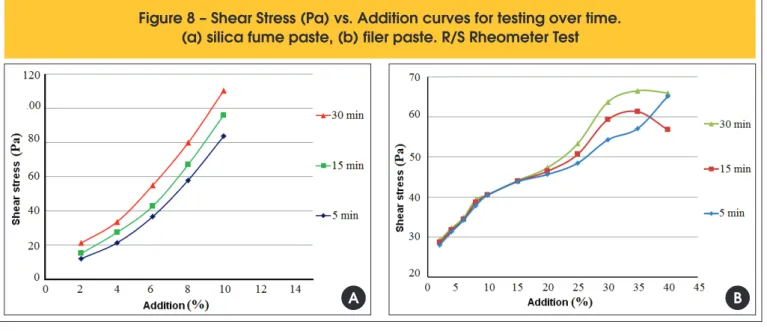
Figures 7 and 8 show the apparent viscosity curves due to the mineral addition levels of the cement pastes. The curves were ob
-tained with the R/S rheometer. The tests show the percentage in
-Tabela 3 – Physico-chemical characterization of CP II E-32
Fire loss
Sieve 200
(% retained)
(% retained)
Sieve 325
Blaine
Density
Absolute
density
setting (h:min:s)
Beginning of
Al2O3
End of
setting (h:min)
Expansion
autoclave
Stress (MPa)
3 days
Stress (MPa)
7 days
Stress (MPa)
28 days
w/c
Insoluble
CaO
SiO
2MgO
Fe O
2 3SO
3Na O
2K O
2Alkali equivalent
of Na O
2Free lime
on CaO
Chemical
analisys (%)
Physical and
mechanical
properties
4.33
4.43
16.8
4031 cm /g
21.04 g/cm
33.05 g/cm
3.05 g/cm
3302:43:00
8.05
04:06:00
0.032 %
14.4
24.4
32.1
0.48
1.63
57.45
20.75
1.84
2.24
2.44
0.26
0.26
0.26
1.64
Tabela 4 – Technical data of superplasticizer
Analisys
Specifications
Data
Visual
pH (20ºC)
Density (g/cm³)
Líquido Âmbar
4.40 – 4.90
1.07 – 1.09
–
4.42
1.08
Tabela 5 – Dosage of SCC mortars
Legend
w/c ratio
Cement
(kg/m³)
Silica fume
(kg/m³)
(kg/m³)
Filer
(kg/m³)
Sand
Superplasticizer
(l)
fc 28 days
(MPa)
crease of mineral addition. There was an increase of viscosity and shear stress for the two types of mineral admixtures.
Analyses of the rheological behavior for 5, 15 and 30 minutes with filer compositions (Figures 7b, 8b) from 20% addition on diverge, while in the composition with silica fume (Figures 7a, 8a) this divergence hap
-pens since the beginning of the incorporation of the active mixture. A pooled analysis of Marsh Funnel tests (Figure 6) and carried out in a rheometer (Figures 7, 8) enabled the choice for the optimum levels points, which were, respectively, 6% and 15% for silica fume and basaltic filer.
4.2 Study of mortar
The sand content chosen - as elucidated in item 2.3 - was 42.5% for both mineral additions, as well as the superplasticizer content of 0.4%. The fine aggregate incorporation interfered directly in
rheology behavior for both mineral additions. In the case of filer composition, this influence was bigger due to the non-reactive be
-havior, and the rheological behavior of this mineral admixture gov
-erned by the physics molecular characteristic and interaction with the sand particles.
The spreading tests with mini-cone (Figure 9) and flow tests with “V” funnel (Figure 10) for mortars characterization were not suf
-ficient to analyze the compositions. It is imperative to use the rhe
-ometer with basaltic filer composition.
The mortar analyses were analogous to the pastes about the use of the same rheological model and the same working range for rhe
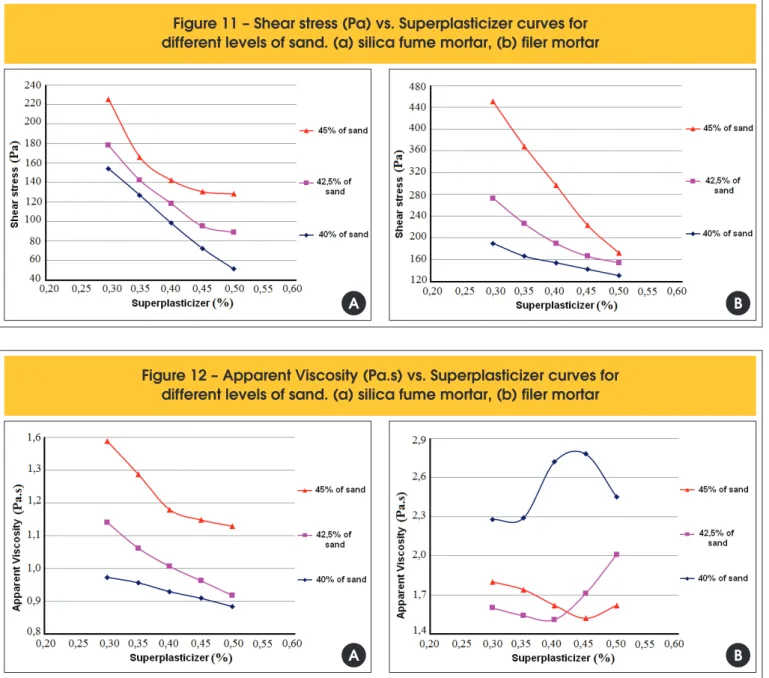
-ological curves. There was a decrease of yield stress and viscosity of the fluid jointly with an increase of the superplasticizer amount used regardless of the mineral admixture dosage (Figures 11, 12). Thus, the mortar phase results qualify to be used as SCC’s mortar ensuring the desired flow properties.
Figure 6 – Flow time (s) vs. Addition curves to testing over time.
(a) silica fume paste, (b) filer paste. Marsh Funnel Test
A
B
Figure 7 – Apparent viscosity (Pa.s) vs. Addition curves for testing over time.
(a) silica fume paste, (b) filer paste. R/S Rheometer Test
A
B
Figure 9 – Scattering (mm) vs. Superplasticizer curves for different levels of sand.
(a) silica fume mortar, (b) filer mortar
A
B
Figure 10 – Flow time (s) vs.% Superplasticizer curves for different levels of sand.
(a) silica fume mortar, (b) filer mortar
netics of deformation curves for settlement and plastic shrinkage. The stabilization of deformation without wind happens later than stabilization of deformations with wind.
The stabilization of deformation occurs later as the content is in
-creased from 0.3% to 0.5% in case of superplasticizer content. There was a decrease of plastic shrinkage with an increase of the superplasticizer content and a decrease of shear stress in both compositions. The biggest shear stress was obtained with basalt filler addition, which provided the smallest plastic shrinkage values compared to the silica fume composition.
4.3 Study of plastic shrinkage
Table 6 shows the setting time results for each SCC’s mortar composition. The mortars were prepared with two different superplasticizers lev
-els - 0.3% and 0.5% - in order to analyze the shrinkage influence. The change in additive content - 0.3% and 0.5% - barely alters the start and end of setting times, so a fixed time for the study of plastic shrinkage and cracking was adopted.
The tests with and without wind have different amplitude and ki
-Figure 11 – Shear stress (Pa) vs. Superplasticizer curves for
different levels of sand. (a) silica fume mortar, (b) filer mortar
A
B
Figure 12 – Apparent Viscosity (Pa.s) vs. Superplasticizer curves for
different levels of sand. (a) silica fume mortar, (b) filer mortar
A
B
Tabela 6 – Setting time of SCC Mortars
Mineral addition
Beginning setting time (h:min)
Ending setting time (h:min)
Basaltic filer
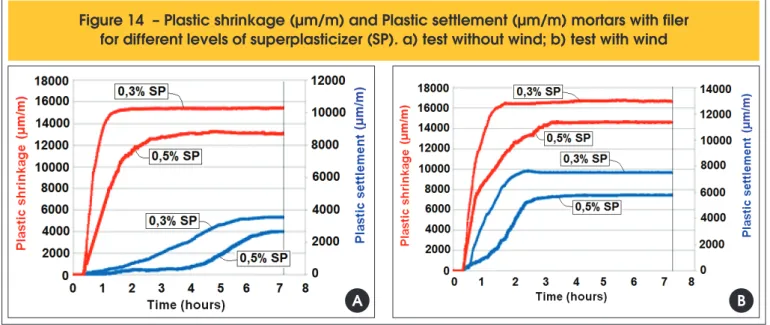
The mortars with silica fume (Figure 13) confer larger amplitudes of plastic shrinkage in relation to basalt filler composition (Figure 14) independently of the wind influence or the superplasticizer content. However, the wind gave a greater results range for the silica fume composition in relation to plastic settlement.
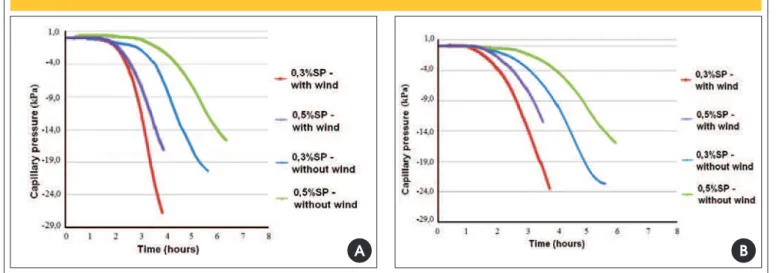
The plastic shrinkage decreasing while the superplasticizer con
-tent increased can be analyzed using results of capillary pressure (Figure 15). These results showed the capillary pressure decreas
-ing as the superplasticizer content increased regardless of the mineral additions utilized and also a higher capillary pressure for the silica fume composition.
Figures 13 and 14 show the plastic settlement behavior similar to the plastic shrinkage behavior, ie, as the superplasticizer content increased, the plastic settlement decreased. The highest shear stresses of the composition were obtained with the addition of ba
-salt filler. This composition showed the highest values of plastic
settlement compared with the silica fume composition in the tests without wind.
There is a significant influence on the plastic settlement analysis with ventilation imposed. While the values were higher for filler composition in tests without wind (Figures 13a, 14a), the opposite occurs in tests with it (Figures 13b, 14b).
4.4 Study of cracking
The fissured area is bigger to the silica fume composition in both cracking tests at early ages - with and without wind - regardless of the superplasticizer content (Table 7).
The composition with basaltc filler shows no type 2 cracks in tests without wind action (Table 8). Moreover, the superplas
-ticizer content increased has an influence on the decrease of cracks.
Figure 13 – Plastic shrinkage (µm/m) and Plastic settlement (µm/m) mortars with silica fume
for different levels of superplasticizer (SP). a) test without wind; b) test with wind
A
B
Figure 14 – Plastic shrinkage (µm/m) and Plastic settlement (µm/m) mortars with filer
for different levels of superplasticizer (SP). a) test without wind; b) test with wind
Figure 15 – Comparison between the compositions basaltc filer and silica fume for different levels
of superplasticizer and wind action on capillary pressure tests - (a) Basaltc filer; (b) Silica fume
A
B
Tabela 7 – Total area (mm²) and total cracking area/mortar area (%) for each sample
Mineral addition
Wind action
Superplasticizer
(%)
area (mm²)
Cracking
Total cracking area/
mortar area (%)
Basaltic filer
Sílica fume
without
0.3
0.5
0.3
0.5
0.3
0.5
0.3
0.5
78.7
43.4
220.4
100.2
209.3
127.5
334.9
178.5
0.2
0.11
0.55
0.25
0.52
0.32
0.84
0.45
with
without
with
The influence of the wind on the cracking, regardless of the super
-plasticizer content can be observed in Table 8. The wind action provides increase on the fissured area and thickness of the cracks. The increase of superplasticizer content in tests without the wind action promotes a more effective reduction of cracking in the com
-position with basaltic filler.
The cracking was shorter with the increase of superplasticizer con
-tent. This phenomenon had a greater effect on the composition with basaltic filler regardless of the wind action.
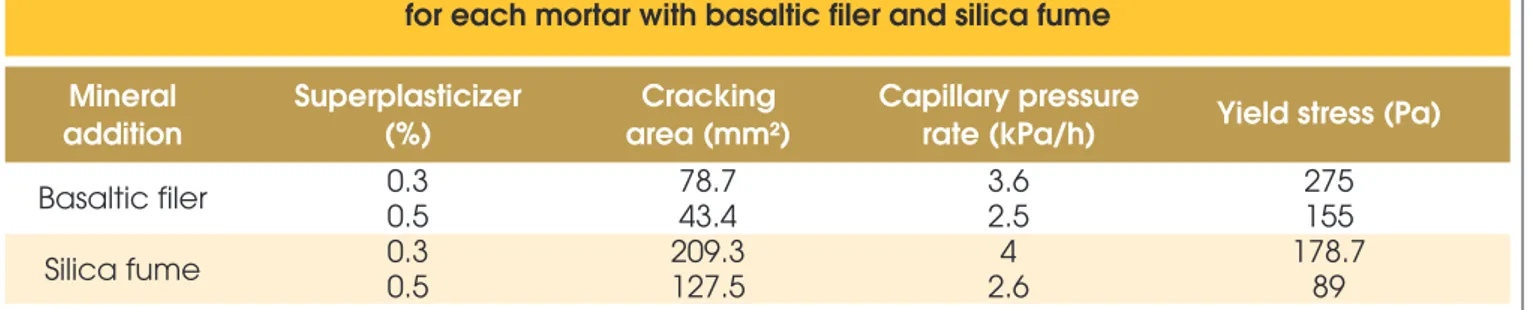
Table 9 lists fissured area, capillary pressure rate and yield stress for each mortar rehearsed.
The cracking is higher for the composition with silica fume, which also has a higher capillary pressure rate and a lower
yield stress.
The individual analysis for each mineral addition shows that with the decrease of the yield stress, a decrease of cracking occurs.
5. Conclusion
The mortars with silica fume conferred larger amplitudes of plastic shrinkage compared to the composition with basaltic filer re
-gardless of the influence of the wind action or superplasticizer content.
The wind action conferred greater amplitude of plastic settle
-ment results to compositions with silica fume.
The tests with and without the wind action presented different amplitude and kinetics of deformation curves for plastic settle
-ment and plastic shrinkage. The stabilization of deformation without the wind action happened later than stabilization of de
-formations in tests with wind.
The stabilization of deformation occurs later in lower super
-plasticizer content tests.
The superplasticizer content increase dropped shear stress and apparent viscosity of samples inducing the capillary pres
-sure reduction. This behavior may explain the amplitude de
-crease on the plastic shrinkage and plastic settlement. It is possible to conclude about the analyses of cracking at early ages that the cracked area is greater for the composition with silica fume in both tests with and without wind, regardless of the superplasticizer content. The wind action increased the cracking of the samples and it was more effective for the com
Tabela 8 – Total area (mm²) and total cracking area/mortar area (%) for each sample – cracking types
Mineral addition
Wind action
Superplasticizer
(%)
Cracking
ratio
Cracking types
Basaltic filer
Sílica fume
without
0.30
0.50
0.30
0.50
0.30
0.50
0.30
0.50
AF* (mm²)
RAF** (%)
AF (mm²)
RAF (%)
AF (mm²)
RAF (%)
AF (mm²)
RAF (%)
AF (mm²)
RAF (%)
AF (mm²)
RAF (%)
AF (mm²)
RAF (%)
AF (mm²)
RAF (%)
1
2
78.7
0.19
43.4
0.11
178.5
0.45
93.19
0.23
190.46
0.48
123.68
0.31
241.12
0.61
162.44
0.41
–
–
–
–
41.87
0.1
7.01
0.02
18.84
0.05
3.83
0.01
93.77
0.23
16.07
0.04
with
without
with
*AF: Cracking area
Tabela 9 – Cracking, capillary pressure rate and yield stress
for each mortar with basaltic filer and silica fume
Mineral
addition
Superplasticizer
(%)
area (mm²)
Cracking
Capillary pressure
rate (kPa/h)
Yield stress (Pa)
Basaltic filer
0.3
0.5
0.3
0.5
78.7
43.4
209.3
127.5
3.6
2.5
4
2.6
275
155
178.7
89
Silica fume
The increase of the superplasticizer content produced less cracking and it was more effective for the composition with basaltic filer regardless of the wind action. The fact that the composition with silica fume results are larger than the composi
-tion with the basaltic filer - cracking results - can be explained by analyzing the capillary pressure, which was greater for composi
-tion with the silica fume and because the flow tensions of composi
-tion with silica fume are minor.
There is a clear difference in the results among the great content for SCC mortars. The differences are significant for both mortars with silica fume and basaltic filer.
The results showed the sensitivity of these materials, either by its rheological behavior or by the evaluation of plastic shrinkage and cracking, even when it comes from a study on a domain, specific and controlled conditions.
The results indicate a greater need to use the material rheology as a tool to assist in the quality control of materials preventing the occurrence of future pathologies.
The rheological study of pastes and mortars can help understand SCC plastic shrinkage and cracking.
6. Acknowledgements
We thank the UNESP Civil Engineering Laboratory, Ilha Solteira campus and São Paulo Energy Company - CESP - for availability and assistance. The Holcim Brazil company, which supplied the cement used in the concrete manufacture. The GRACE of Brazil by providing the superplasticizer used in research. FAPESP for the financial support of the research project.
7. Bibliography
engenharia civil) - Ecole Centrale de Nantes, Nantes, Fran
-ça, 2004.
[02] VITA, M. O. Estudo da retração plástica e da fissuração do concreto auto-adensável nas primeiras idades: avaliação da influência dos tipos de adições minerais. Dissertação (Mes
-trado em engenharia mecânica) - Faculdade de Engenharia, Universidade Estadual Paulista, Ilha Solteira, 2011.
[03] OKAMURA, H.; OUCHI, M. Self-compacting concrete. Jour
-nal of advanced concrete technology, 2003. v.1. Number 1.
p. 5-15.
[04] ABNT. Concreto auto-adensável. NBR15823. Rio de Janei -ro, 2010.
[05] MELO, K. A. Contribuição à dosagem de concreto auto-ad
-ensável com adição de filer calcário. 2005. 180 f. Disserta
-ção (Mestrado em engenharia civil) - Universidade Federal de Santa Catarina, Florianópolis, 2005.
[06] REIS, J. F. A. Determinação de parâmetros reológicos de concretos através do ensaio de abatimento de tronco de cone modificado: estudo de caso. Dissertação (Mestrado em engenharia mecânica) – Faculdade de Engenharia, Uni -versidade Estadual Paulista, Ilha Solteira, 2008.
[07] PILEGGI, Rafael G.; CINCOTTO, Maria A.; JOHN, Vander
-ley M., Conceitos reológicos aplicados no desenvolvimento de argamassas. Revista de Ciência e Tecnologia de Mate
-riais de Construção Civil Vol. 3, n. 2, p. 62-76, Novembro 2006.
[08] STEIN, H.N.. Rheological behavior of suspensions. In: CHEREMISINOFF, N.P. (Ed.) Encyclopedia of fluid mechan
-ics: slurry flow technology. Houston: Gulf Publishing, 1986. [09] BANFILL, P. F. G. The rheology of fresh mortar – a review.
ANAIS, Florianópolis, VI SBTA, 2005. p. 73-82.
[10] AGARWALA, M. K.; PATTERSON, B. R.; CLARCK, P. E. Rheological behavior of powder injection molding model slurries. Journal of Rheology, v. 36, n. 2, p. 319-334, 1992. [11] OLIVEIRA, I. R. et al. Dispersão e empacotamento de
partículas: princípios básicos e aplicações em processa
-mento cerâmico. São Paulo, 2000. 224 p.
[12] AÏTCIN, P. C. Concreto de alto desempenho. São Paulo: Pini, 2000. 667p.
[13] PELISSER, F.; NETO, A. B. S. S.; ROVERE, H. L.; PINTO, R. C. A. Effect of the addition of synthetic fibers to concrete thin slabs on plastic shrinkage cracking. Construction and building materials, 2010. v. 24. p. 2171-2176.
[14] NEVILLE, A. M. Propriedades do concreto. São Paulo: Pini,
1997. 828p.
[15] JENSEN, O. M; HANSEN P.F. Autogenous deformation and change of the relative humidity in silica fume modified ce
-ment paste. ACI Materials Journal, 1996, v. 93. p. 539-543. [16] HOLT, E.; LEIVO, M. E. Cracking risks associated with early
age shrinkage. Cement & Concrete Composites, Kidlington, v. 26, p. 521-530, 2004.
[17] SOROUSHIAN, P. MIRZA, F. ALHOZAIMY, A. M. (a) Plastic Shrinkage Cracking of Polypropylene Fiber Reinforced Con
-crete. ACI Materials Journal, V.92, No.5, 1995. p. 553-560. [18] DEPARTAMENTO NACIONAL DE INFRA ESTRUTURA DE
TRANSPORTES – DNIT 061/2004 – TER – Pavimento rígi
-do – Defeitos - Terminologia. Rio de Janeiro: DNIT, 2004.] [19] HELENE, P. Dosagem dos concretos de Cimento Portland.
In: ISAIA, G. C. (Ed.). Concreto: ensino, pesquisa e realiza
-ções. São Paulo: IBRACON, 2005. v. 2, p. 439-471. [20] GOMES, P. C. C. Optimization and characterization of
high-strength self-compacting concrete. 2002. 223 f. Tese (Doutorado em engenharia civil) - Escola Técnica Supe
-rior D`Enginyers de Camins, Universitat Politécnica de
Catalúnya, Catalúnya, 2002.
[21] ASOCIACIÓN MERCOSUR DE NORMALIZACIÓN - AMN. NM 9: concreto e argamassa - determinação dos tempos de pega por meio de resistência à penetração. Rio de Janeiro: ABNT, 2002. 6 p.
[22] ASOCIACIÓN MERCOSUR DE NORMALIZACIÓN - AMN. NM 49: agregado miúdo - determinação de impurezas orgânicas. Rio de Janeiro: ABNT, 2001. 3 p.
[23] ASSOCIAÇÃO BRASILEIRA DE NORMAS TÉCNICAS - ABNT. NBR 7211: Agregados para concreto - Especificação. Rio de Janeiro: ABNT, 2009. 9p.
[24] ASOCIACIÓN MERCOSUR DE NORMALIZACIÓN - AMN. NM 53: agregado graúdo - determinação de massa especí