UNIVERSIDADE ESTADUAL PAULISTA – UNESP
CÂMPUS DE JABOTICABAL
AVALIAÇÃO DE FITASES MICROBIANAS EM DIETAS DE
FRANGOS DE CORTE
Gabriel Villela Dessimoni Pinto
ZootecnistaUNIVERSIDADE ESTADUAL PAULISTA – UNESP
CÂMPUS DE JABOTICABAL
AVALIAÇÃO DE FITASES MICROBIANAS EM DIETAS DE
FRANGOS DE CORTE
Gabriel Villela Dessimoni Pinto
Orientadora: Profa. Dra. Nilva Kazue Sakomura
Tese apresentada à Faculdade de Ciências Agrárias e Veterinárias – Unesp, Câmpus de Jaboticabal, como parte das exigências para a obtenção do título de Doutor em Zootecnia
Pinto, Gabriel Villela Dessimoni
P659a Avaliação de fitases microbianas em dietas de frangos de corte. / Gabriel Villela Dessimoni Pinto. – – Jaboticabal, 2015
xvii, 106 p. ; 28 cm
Tese (doutorado) - Universidade Estadual Paulista, Faculdade de Ciências Agrárias e Veterinárias, 2015
Orientadora: Nilva Kazue Sakomura
Banca examinadora: Júlio César Carrera Carvalho, Leilane Rocha Barros Dourado, Luciano Hauschild, Antônio Sérgio Ferraudo.
Bibliografia
1. Fitato. 2. Desempenho. 3. Nutrientes. 4. Custo. 5. Multivariada. 6. Tíbia. I. Título. II. Jaboticabal-Faculdade de Ciências Agrárias e Veterinárias.
CDU 636.084.52:636.5
DADOS CURRICULARES DO AUTOR
“Feliz o homem que encontrou a sabedoria, o homem que alcançou o entendimento! Ganha-la vale mais do que a prata, e seu lucro mais do que o ouro. É mais valiosa do que as pérolas; nada que desejas a iguala. Em sua direita: longos anos; em sua esquerda: riqueza e honra! Os seus caminhos são deliciosos, e os seus trilhos são prosperidade. É uma árvore de vida para os que a colhem, e felizes são os que a retêm!”
DEDICATÓRIA
Dedico primeiramente a Deus pela oportunidade e até mesmo pelos obstáculos colocados em meu caminho para que eu pudesse vence-los e me tornar mais forte a cada dia.
A toda a minha família e em especial aos meus pais por estarem sempre ao meu lado. Mesmo estando longe, o seu apoio sempre se fez presente. Aos meus avós, que tenho certeza estarem muito orgulhosos pela minha vitória.
A minha esposa Aline pela força, apoio, companheirismo e compreensão. Aos companheiros de trabalho que me ajudaram de alguma forma para a condução deste estudo.
AGRADECIMENTOS
Agradeço em especial a Profa. Nilva Kazue Sakomura, pela oportunidade e confiança.
Ao professor Antônio Sérgio Ferraudo pela atenção desprendida, lições de vida e ensinamentos.
A todos os professores que participaram da minha formação profissional, pelas disciplinas ministradas.
A todos da equipe do LAVINESP - Laboratório de Avicultura da UNESP pela ajuda nos estudos, amizade e companheirismo, em especial a Daniella Donato.
Agradeço também, todos os funcionários da instituição que me ajudaram direto ou indiretamente a conduzir os estudos.
As empresas Nutron (Cargil) pelas doações de produtos comerciais (premixes). Ao CNPQ, pela concessão da bolsa de estudos.
SUMÁRIO
RESUMO... XII ABSTRACT ... XIV ABREVIAÇÕES ... XVI
CAPÍTULO 1 – CONSIDERAÇÕES GERAIS ... 1
1.1. Introdução ... 1
1.2. Revisão de Literatura ... 2
1.2.1. Fitase e seus benefícios ... 3
1.2.2. Tipos de fitases ... 4
1.2.3. Fósforo e suas implicações ... 7
1.2.4. Fator antinutricional do fitato... 8
2. REFERÊNCIAS ... 12
CAPÍTULO 2 - COMPARISON OF AN Escherichia coli AND A Buttiauxella PHYTASES ON PHOSPHORUS BIOAVAILABILITY, LITTER COMPOSITION AND FEED COSTS ... 17
ABSTRACT ... 17
1. Introduction ... 18
2. Materials and Methods ... 19
2.1. Birds and housing ... 19
2.2. Experimental design ... 19
2.3. Experimental diets ... 20
2.4. Performance ... 22
2.5. Analysisoftibias ... 22
2.6. Analysisof nutrients in thelitter ... 23
2.7. Phosphorus bioavailability ... 23
2.8. Cost of diets analysis ... 24
2.9. Statisticalanalysis ... 24
3.0 Results ... 25
3.1 Phytase to maximize the performance of broilers ... 25
3.2. Effects of phytases on composition and quality of bone ... 27
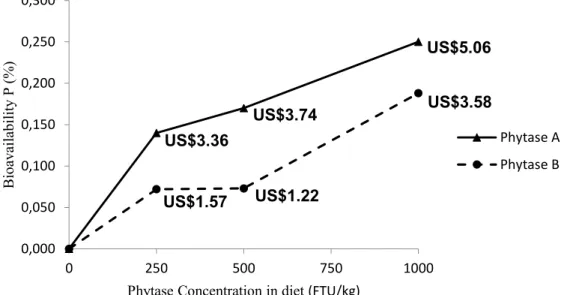
3.4. Bioavailability of phosphorus ... 29
3.5. Cost of diet analysis ... 33
4. Discussion ... 34
5. References ... 39
CAPÍTULO 3 - PHYTASE AFFECTS THE PERFORMANCE, NUTRIENTS DIGESTIBILITY, MINERALS OF TIBIA AND DIET COST ... 43
ABSTRACT ... 43
1. Introduction ... 44
2. Materials and Methods ... 45
2.1. Birds and housing ... 45
2.2. Experimental design ... 46
2.3. Experimental diets ... 46
2.4. Performanceparameters ... 48
2.5. Digestibility of nutrients ... 48
2.6. Analysisoftibias ... 49
2.7. Phosphorus bioavailability ... 49
2. 8. Cost analysis ... 50
2.9. Statisticalanalysis ... 50
3. Results ... 51
3.1. Performance ... 51
3.2. Digestibility... 52
3.3. Minerals deposition in tibias ... 53
3.4. Bioavailability of phosphorus ... 54
3.5. Economic analysis ... 55
4. Discussion ... 56
5. References ... 61
CAPÍTULO 4 - STUDY OF SUPPLEMENTAL PHYTASE DERIVED FROM Escherichia coli IN SMALL CONCENTRATIONS ON THE PERFORMANCE AND BONE MINERALIZATION OF BROILERS ... 65
ABSTRACT ... 65
1. Introduction ... 66
2.1. Birds and housing ... 67
2.2. Experimental design ... 68
2.3. Experimental diets ... 68
2.4. Performance ... 70
2.5. Analysis of tibias ... 70
2.6. Phosphorus Bioavailability ... 70
2.7. Cost analysis ... 71
2.8. Statistical analysis ... 72
3. Results ... 73
3.1. Performance ... 73
3.2. Tibias ... 75
3.3. Phosphorus bioavailability ... 75
3.4. Economic analysis ... 75
4. Discussion ... 80
5. References ... 84
CAPÍTULO 5 - EXPLORATORY ANALYSIS FOR EVALUATION OF DIFFERENT PHYTASES ORIGINS ... 88
ABSTRACT ... 88
1. Introduction ... 89
2. Material and Methods ... 90
2.1. Birds and housing ... 90
2.2. Experimental design ... 90
2.3. Experimental diets ... 91
2.4. Performance characteristics evaluated ... 93
2.5. Analysis of tibias ... 93
2.6. Phosphorus bioavailability ... 93
2.7. Statistical analysis ... 94
3. Results and discussion ... 96
4. Conclusion ... 101
5. References ... 103
AVALIAÇÃO DE FITASES MICROBIANAS EM DIETAS DE FRANGOS DE CORTE
para ganho de peso e consumo de ração em concentração de 500 FTU/kg, em relação a fitase E. coli, com 1000 FTU/kg. Ambas as fitases reduziram teores de fósforo total e fósforo solúvel na cama. A biodisponibilidade calculada com base no teor de cinzas da tíbia e ganho de peso, indicou que a fitase E. coli é mais eficaz em depositar minerais nos ossos, enquanto que a fitase Buttiauxella sp é a mais eficaz para o deposição de peso. O conteúdo mineral dos ossos (P, Zn e cinzas) e força de deflexão das tíbias foram melhoradas pela adição de ambas as fitase. As fitases utilizadas a uma concentração de 1000 FTU/kg resultaram em melhor relação custo/benefício, considerando o preço fosfato bicálcico de U$ 0,50/kg. No segundo estudo, a adição de fitase E. coli aumentou 7,0 e 5,3% o consumo de ração, 8,9 e 8,8% o ganho de peso e melhorou 2 e 5 pontos da conversão alimentar nas fases iniciais e de crescimento, respectivamente em relação a dieta CN. A inclusão "on top" de fitase (adição no CP), melhorou 2 pontos na conversão alimentar, em relação a dieta CP. A inclusão de fitase em dieta com redução nutricional melhora a digestibilidade da matéria seca (MS), proteína bruta (PB), fósforo (P), energia digestível aparente na matéria natural (ED na MN) e na matéria seca, em relação a dieta sem fitase, bem como os teores de cinzas, cálcio e fósforo nas tíbias. A inclusão de fitase na dieta com total atendimento nutricional (“on top”) melhora a digestibilidade de PB, ED na NM, cálcio (Ca) e P, em relação a mesma dieta, sem a enzima. A deposição de cinzas nas tíbias das aves alimentadas com adição “on top” de fitase é superior às que não receberam fitase. Considerando o custo da fonte de fósforo inorgânico, foi obtido uma economia de U$ 3,72 / tonelada de ração, com a inclusão da fitase. No terceiro estudo, a fitase E. Coli (expressa em Pichia pastoris), demonstrou ser eficiente, melhorando o ganho de peso, consumo de ração, conversão alimentar, viabilidade e as características ósseas das aves alimentadas com redução de P na dieta. No entanto, os níveis mais próximos ao teor máximo estudado (240 OTU) apresentaram os melhores resultados. A substituição de fosfato bicálcico por fitase foi economicamente viável quando o custo por OTU/g não excedeu U$0,000014, U$0,000012 e U$0,000010, para as concentrações de 120, 180 e 240 OTU, respectivamente. No último experimento, com base na análise multivariada: análise de agrupamento pelo método hierárquico, análise de componentes principais e análise discriminante confirmaram que a dieta controle positivo e controle negativo tem propriedades muito específicas e contrastantes. As fitases fúngicas (F1 e F2) apresentam um mesmo padrão de respostas, bem como fitases bacterianas (B1 e B2). Ambas as fitases foram superiores, quando comparado ao controle negativo, no entanto, eles não foram capazes de igualar às respostas da dieta controle positivo. As fitases bacterianas foram mais eficientes em recuperar as respostas de desempenho, sendo mais semelhantes à dieta controle positivo. Todas as fitases foram efetivas, conforme suas avaliações, entretanto, a forma de utiliza-las dependerá do objetivo de cada produção.
EVALUATION OF MICROBIAL PHYTASES IN BROILER DIETS
ABSTRACT - The objective of this study was to evaluate phytases from different microorganisms on performance, bone characteristics, excretion and digestibility of nutrients, as well as phosphorus bioavailability and costs. The standard curve method was used to obtain the phosphorus bioavailability in response of performance and bone mineralization. The study was divided in four trials. In the first study were evaluated phytases from Buttiauxella sp (A; expressed in Trichoderma reesei) and E. coli (B; expressed in S. pombe) origins. A total of 2,160 male day-old Cobb 500 chicks were distributed in a completely randomized design to nine treatments and eight replicates containing 30 birds each. The treatments were: T1 - Positive Control (PC) – meeting all requirements of the birds; T2 - Negative Control 1 (NC1) – reduction of 0.14% P and 0.13% Ca; T3 - Negative Control 2 (NC2) - reduction of 0.17% P and 0.16% Ca; T4 - NC2 + phytase A (250 FTU/kg); T5 - NC2 + phytase A (500 FTU/kg); T6 - NC2 + phytase A (1000 FTU/kg); T7 - NC2 + phytase B (250 FTU/kg); T8 - NC2 + phytase B (500 FTU/kg); T9 - NC2 + phytase B (1000 FTU/kg). Regressions were performed on performance data, bone mineralization and excretion of nutrients to determine the optimal level inclusion of each phytase. A second trial was conducted to evaluate the response of the inclusion of a new bacterial phytase (E. Coli) supplemented on diets meeting all requirements of the birds, or with nutritions reduction. A total of 896 male day-old Cobb 500 broilers were divided into 32 experimental units, each unit consisting of 28 birds. The design was completely randomized with four treatments and eight replications. The treatments were: Positive Control (PC) - diet meeting the nutritional requirements of the birds; Negative Control (NC) – reduction of 100kcal ME/kg; 0.14% avP and 0.11% Ca; NC + Phy (500FTU/kg);
PC + Phy (500FTU/kg). The third trial was conducted to evaluate the inclusion of E. coli phytase (expressed in Pichia pastoris). A total 1890 male day-old Cobb 500 chicks were assigned to six treatments and seven replicates with 45 birds each, distributed in a completely randomized design. The treatments were: Positive Control (PC) - diet meeting the nutritional requirements of the birds; Negative Control (NC1) - reduction of 0.06% avP; Negative Control 2 (NC2) - reduction of 0.12% avP; NC2 + Phytase (120
FTU); NC2 + Phytase (180 FTU); NC2 + Phytase (240 FTU). At the fourth trial four phytases were compared, being two fungal (F1 and F2) and two bacterial (B1 and B2), supplemented in a corn and soybean meal based diets. A total of 2,205 male day-old Cobb 500 chicks were assigned to seven treatments and seven replicates containing 45 birds and were distributed in a completely randomized design. The treatments were: Positive Control (PC) - diet meeting the nutritional requirements of the birds; Negative Control 1 (NC1) - reduction of 0.06% avP; Negative Control 2 (NC2) - reduction of
0.12% avP; NC2 + Fungal Phytase 1 (F1); NC2 + Fungal Phytase 2 (F2); NC2 +
weight gain, indicated that E. coli phytase is more efficient in depositing minerals in the bones, while Buttiauxella sp phytase is more efficient for body weight gain. Mineral contents (P, Zn and Ash) and deflection force of tibias were improved by adding both phytases to the diets. The phytases in concentration of 1000 FTU/kg resulted in better cost/benefit ratio, considering the dicalcium phosphate price of $0.50. In the trial 2, the E. coli phytase addition increased (p<0.05) of 7.0 and 5.3% in FI, 8.9 and 8.8% in BWG and improved 2 and 5 points in the FCR in initial and growth phases, respectively, when compared to NC. The inclusion "on top" of phytase (PC + PHY) provided an improvement of 2 points in FCR in comparison to PC diet. Phytase supplementation in diets with reduced nutritional diets improves dry matter (DM), crude protein (CP), apparent digestible energy (ADE) in DM, ADE in natural matter (NM), and phosphorus (P) digestibility when compared to NC diet. Phytase supplementation on top (in PC diet) improved digestibility of CP, ADE in NM, Ca and P, when compared to the same diet with no phytase supplementation. Ash deposition on tibia of broilers fed diets with phytase supplementation on top is higher than those who does not received phytase. Considering the costs of the sources of inorganic phosphorus, it was achieved a saving of U$ 3.72/ton of produced feed with phytase supplementation. In the third study, the E. coli phytase (expressed in Pichia pastoris) showed to be efficient, improving body weight gain, feed intake, feed conversion, viability and bone characteristics of birds fed diets P-deficient. However, the levels closest to the maximum content studied (240 OTU) showed the best results. The substitution of dicalcium phosphate for phytase economically viable when the cost per FTU/g did not exceed U$0.000014, U$0.000012 and U$0.000010, to concentrations of 120, 180 and 240 OTU, respectively. In the last trial the multivariate analysis: cluster analysis by hierarchical method, principal component analysis and discriminant analysis confirmed that the positive and negative control has very specific and contrasting properties. Fungal phytases (F1 and F2) showed the same pattern, as well as bacterial phytases (B1 and B2). Both phytases showed a superior process when compared to the negative control, therefore they were not able to equalize to the positive control diet. Bacterial phytases were more efficient to recover the performance of broilers, being more similar to positive control diets. All phytases were effective, according to their evaluations. However, its supplementation method will depend on the purpose of each production.
ABREVIAÇÕES
A Phytase - Phytase extracted from bacteria of the genus Buttiauxella;
Ash (21) – Tibia Ash at 21 Days;
Ash (35) – Tibia Ash at 35 Days;
B Phytase - Phytase extracted from bacteria of the genus E. Coli;
B1 – Bacterial phytase (produced by Escherichia coli);
B2 – Bacterial phytase (produced by Escherichia coli);
BWG - Body Weight Gain;
BWG (21) - Body Weight Gain at 21 Days;
BWG (35) - Body Weight Gain at 35 Days;
Ca – Calcium;
tCa – Total calcium;
DDTW (21) - Defatted Dry Tibia Weight at 21days;
DDTW (35) - Defatted Dry Tibia Weight at 35days;
DTW - Defatted Dry Weight;
F1 – Fungal phytase (produced by Peniophora lyci);
F2 – Fungal phytase (produced by Aspergillus niger);
FCR - Feed Conversion Reeder
FI – Feed Intake;
FI (21) - Feed Intake at 21 Days;
FI (35) - Feed Intake at 35 Days;
FI (21) - Feed Efficience at 21 Days;
FI (35) - Feed Efficience at 35 Days;
G1 - Group one;
G2 - Group two;
ISP - intake of supplementary phosphorus;
L - Linear Model;
Mg - Magnesium;
tN - Total Nitrogen;
Na - Sodium;
NC1 - Negative Control 1;
NC2 - Negative Control 2;
P -Phosphorus;
avP - Available phosphorus; tP - Total Phosphorus;
PB –Phosphorus Bioavailability;
PB (21) – Phosphorus Bioavailability at 21 Days;
PB (35) – Phosphorus Bioavailability at 35 Days;
PC - Positive Control;
PCOM - Principal Components;
PR - Phosphorus Released;
Q - Quadratic Model;
QP - Quadratic Plateau Model;
VIA - Viability;
WSP - Water Soluble Phosphorus;
CAPÍTULO 1 – CONSIDERAÇÕES GERAIS
1.1. INTRODUÇÃO
A principal fonte de armazenamento de fósforo (P) em grãos e cereais é na forma de fitato que, nos vegetais, tem a função de reserva e previne o estresse oxidativo, impedindo a morte do embrião. O fitato, apesar de ser uma molécula rica em P, apenas um terço deste nutriente é disponível para não ruminantes (FERKET et al., 1993).
O termo fitato é comumente descrito pelos nutricionistas como a molécula de ácido fítico complexada com nutrientes. Quando presente no trato digestório, tem um efeito antinutricional de reduzir a biodisponibilidade dos nutrientes e se complexar com enzimas gástricas digestivas. Entretanto, a molécula de ácido fítico possui algumas características de acordo com o local e estado onde se encontram.
De uma forma mais simples, poderíamos dizer que a molécula presente nos ingredientes de origem vegetal, que constituem as rações, é denominada de fitina. Esta, por sua vez, constitui a forma de armazenamento de fósforo para as plantas. Tem como característica se solubilizar em pH baixo, presente no início do trato gastrointestinal dos não ruminantes, passando a forma livre, o ácido fítico. O fato do ácido fítico ser solúvel em pH baixo, cria condições para a sua hidrólise, através da fitase que deve atuar de maneira consistente nestas condições. À medida que o bolo alimentar prossegue pelo trato gastrointestinal, ocorre o aumento do pH, principalmente a partir do duodeno, pela liberação do suco pancreático. Então, o ácido fítico forma cristais complexando com os nutrientes e se precipita (SELLE et al., 2006).
A fitase cliva a cadeia de myo-inositol hexafosfato do ácido fítico, liberando inositol e fosfato inorgânico no estômago. Esta hidrólise evita que a molécula se ligue a moléculas carregadas positivamente, formando quelatos em pH mais básico (duodeno), melhorando a disponibilidade de Ca, Fe, Mg, Zn e Cu, proteína e energia (NAHM, 2007), bem como a atividade das enzimas endógenas.
este mercado tem um crescimento de 10 a 15% ao ano. Com o alto custo das fontes inorgânicas de fósforo e estudos que comprovam a eficácia da enzima e sua viabilidade econômica, a aplicação de fitase tem sido uma ferramenta aplicada em quase a totalidade das formulações de dietas para aves.
Com o advindo da engenharia genética, diversas fitases tem sido produzidas, havendo uma crescente demanda para suas avaliações. Existe uma busca para fitase com pH de atuação mais amplo e melhor termoestabilidade (BESLIN, 2014). Desta forma, o presente estudo objetivou avaliar diferentes fitases sobre o desempenho, características ósseas, excreção e digestibilidade dos nutrientes, bem como a biodisponibilidade do fósforo. E ainda, uma abordagem utilizando análises multivariadas exploratórias para comparação entre fitases fúngicas e bacterianas.
1.2. REVISÃO DE LITERATURA
A partir de 1857, Louis Pasteur notou haver uma relação entre fermentação e atividade biológica das leveduras. A partir deste momento, as enzimas vem sendo amplamente estudadas (LEHNINGER, 1994).
1.2.1. Fitase e seus benefícios
A fitase foi descoberta em 1907 por Suzuki, porém, somente na década de 90, seu emprego na produção animal tornou-se economicamente viável. Produzida a partir Aspergillus niger, essa foi a primeira fitase a surgir no mercado (SELLE; RAVINDRAN, 2008).
Sua atividade é expressa como sendo a quantidade de enzima que hidrolisa 1 micromol de fósforo inorgânico por minuto, proveniente de 1,5 micromol de fitato de sódio em pH 5,5 à temperatura de 37ºC (ENGELEN et al., 1994).
A fitase deve ser capaz de hidrolisar a molécula de fitato durante a digestão, antes de chegar ao duodeno, local onde o fitato se quela com cátions e se precipita, tornando sua hidrólise impraticável. Desta forma, segundo Igbasan (2010), para uma fitase atuar de maneira eficaz, ela deve apresentar estabilidade em pH, resistência ao processo de produção da ração, resistência à ação proteolítica e estabilidade no trato digestivo.
Diversos estudos apontam que a fitase é capaz de melhorar a digestibilidade do fósforo, aminoácidos, proteína e energia (RUTHERFORD et al., 2003; SANTOS et al., 2008), assim como de outros minerais como Ca, Na e Cu (CHUNG et al., 2013).
Um estudo realizado por Fukayma et al. (2008), aplicando-se fitase em concentrações de 500 a 1000 FTU em dietas com redução de energia metabolizável, cálcio e fósforo, observaram que a adição de 750 FTU proporcionou o máximo desempenho e os melhores resultados de mineralização e resistência ósseas de frangos de corte aos 20 dias de idade.
Rutherford et al. (2012), trabalhando com níveis de suplementação de 1000 e 2000 FTU de fitase, verificaram melhoras de até 16% na digestibilidade ileal aparente total, um aumento de até 35% no teor mineral das tíbias, além de melhora na digestibilidade aparente ileal dos aminoácidos treonina, tirosina e histidina em 14, 9 e 7%, respectivamente, após a inclusão de fitase.
(2004) estudando a suplementação de uma fitase E. coli (500 FTU) em dietas a base de milho e farelo de soja deficiente em Ca (4,8 g/kg) com fitase de E. coli (500 FTU/kg) concluíram que a fitase liberou em média 0,90 g de Ca/kg de ração com base nas cinzas da tíbia.
Khodambashi et al. 2013, avaliando a inclusão de 500 FTU de fitase em dietas com redução de Ca e P, também observaram um maior teor de cinzas nas tíbias, além de melhor relação altura das vilosidades e profundidade de cripta no duodeno, jejuno e íleo de frangos de corte, em comparação com frangos alimentados com a dieta contendo total atendimento nutricional.
Diversos estudos também indicaram que a suplementação de fitase melhora o desempenho de frangos de corte, proporcionando melhores resultados no ganho de peso, consumo de ração, eficiência alimentar (DENBOW et al, 1995; MITHCELL; EDWARDS, 1996; SINGH; KHATTA, 2003; KARIM, 2006; SELLE; RAVINDRAN, 2007; COWIESON; COWIESON, 2011; LIU et al., 2014).
1.2.2. Tipos de fitases
As fitases disponíveis no mercado são denominadas fúngicas ou bacterianas, de acordo com o microrganismo que são produzidas. Podem também ser classificadas de acordo com a Comissão de Nomenclatura da União Internacional de Bioquímica e Biologia Molecular (NCIUBMB) e pela Nomenclatura Bioquímica (JCBN), de acordo com o local da primeira hidrólise na molécula do fitato como: mio-inositol hexaquifosfato 3-fosfohidrolase, denominada 3-fitase e mio-inositol hexaquifosfato 6-fosfohidrolase, denominada 6-fitase ou fitato 6-fosfatase. A 3-fitase hidrolisa o fosfato na posição D-3 (L1) do anel do mio-inositol presente na molécula do fitato, enquanto a 6-fitase hidrolisa o fosfato na posição L-6 (D4) (RAGON et al., 2008).
permitem um alto rendimento e produção em maior escala, tornando-se amplamente utilizadas na indústria (KIM; MULLANEY; PORRES, 2006).
Segundo Nascimento (2011), poucas espécies selvagens de bactérias são utilizadas para produção de fitase, principalmente devido ao baixo rendimento e por apresentarem uma faixa ótima de pH não adequada ao sistema digestivo dos monogástricos. Por isso, a busca concentra-se mais nas bactérias termo-ácidas-tolerantes ou fungos.
A indústria da fitase abrange diversos produtos que apresentam características particulares, resultados de engenharia genética específicas de cada empresa. Sendo as maiores diferenças provenientes das variações de microrganismos, bem como dos processos de produção e extração. Por consequência, as fitases atuam de forma distintas, influenciadas pelo pH do estômago, ação de enzimas digestivas, tempo de atuação e estabilidade dentro do sistema digestivo.
O processo de produção de fitases mais comumente utilizados, são realizados por dois métodos: fermentação líquida submersa e fermentação em estado sólido. A fermentação líquida submersa nada mais é que o cultivo de microrganismos em um meio líquido rico em substrato que utilizam os nutrientes e excretam as enzimas para o meio de cultura. A fermentação em estado sólido é o crescimento do microrganismo em substratos sólidos na ausência de líquido na forma livre (PANDEY et al., 2003). A fermentação no estado sólido é uma técnica mais econômica devido a utilização de resíduos agroindustriais como substrato, maior facilidade em separar a fitase, maior produtividade e menor utilização de água. Geralmente são utilizados como substratos os farelos, cascas e bagaços (PANDEY et al., 2003).
Para aplicação da técnica de fermentação em estado sólido, deve-se escolher adequadamente o microrganismo, pois os fungos são capazes de crescer em ambiente com escassa água e alta concentração de sólidos (GUTIÉRREZ – ROJAS, et al. 1995). Segundo Salmon, 2011, a produção de fitases fúngicas se mostra mais vantajosa pela facilidade de extração da enzima do ponto de vista industrial, já que os fungos sintetizam enzimas extracelulares que são lançadas em um substrato externo e, portanto, elimina-se a etapa de rompimento celular de enzimas intracelulares.
microrganismo a produza extracelularmente. Além disso, as fitases também podem ser produzidas industrialmente por fermentação submersa utilizando a tecnologia do DNA recombinante com micro-organismos geneticamente modificados (SALMON, 2011). Desta maneira, muitas empresas utilizam desta tecnologia para expressar os genes, principalmente de bactérias, em organismos com parede celular, como os fungos.
Outro fator importante que deve-se levar em consideração é a estabilidade da fitase. Heinzl (1996) demonstrou que a fitase atua otimamente em pH 5 a 6,5 (mantendo-se estável na faixa de pH 2 a 7), bem como a 60ºC com amplo limite de temperatura.
O que se pode observar, através das pesquisas, é que as fitases de origem bacteriana tem uma maior estabilidade no sistema digestivo das aves, sofrendo menor degradação por parte das enzimas digestivas gástricas, além de uma faixa mais ampla de atuação no trato digestivo (WYSS et al., 1999; AUGSPURGER et al., 2003; PILLAI et al., 2006).
Augspurger et al. (2003) observaram uma maior liberação do P por fitase produzida por E. coli quando expressa em levedura em comparação com a fitases fúngicas para pintos jovens e suínos. De acordo com o autor, a maior liberação de P por E.coli foi proveniente do pH ideal de atuação desta enzima ser mais baixo que as fúngicas.
1.2.3. Fósforo e suas implicações
O elemento fósforo é um não-metal originários das rochas, pertencente ao grupo XA da tabela periódica, com massa atômica de 31u. É o único macro nutriente inexistente na atmosfera, em sua forma natural.
O fósforo das rochas, que se mineraliza no solo, é incorporado nas plantas pelas raízes passando a participar da cadeia trófica dos consumidores. Através dos excrementos ou pela morte dos animais, o mesmo é devolvido ao solo. No entanto, parte deste fosforo é transportado para o lençol freático por lixiviação, incorpora-se na cadeia trófica de rios e lagos, até chegar ao mar. Uma parte se perde nos solos profundos, não sendo mais aproveitado, a menos que haja o aparecimento de algas que o reincorpore na cadeia trófica.
O fósforo é um nutriente associado ao combustível biológico de alta energia dos seres vivos, tais como ATP, ADP e fosfocreatina, bem como às moléculas de glucose-6-fosfato e glicerol fosfato. Ele também é constituinte dos ácidos nucleicos e dos fosfolípidos, que têm um papel vital na construção de membrana plasmática das células. É um componente das coenzimas NAD e FAD, participando no metabolismo de carboidratos, lipídios e proteínas.
É um dos principais constituintes dos componentes estruturais dos tecidos esqueléticos. Atua também como principal tampão intracelular no corpo e está envolvido no equilíbrio ácido-base do plasma (CROMWELL, 1996). O fósforo também participa da homeostase do cálcio no organismo. É um regulador da excreção renal e também auxilia na utilização de vitaminas. Tanto o excesso quanto a deficiência interferem na absorção de cálcio no metabolismo (MCDOWELL, 2003).
É um mineral indispensável para a agricultura e nutrição animal. Todavia, há uma preocupação por parte dos ambientalistas quanto a sua utilização inconsciente em grande escala. Segundo Lana (2009), as reservas conhecidas e de exploração a baixo custo podem se esgotar em um prazo de quarenta a cem anos. Desta forma, a utilização consciente deste nutriente se torna cada vez mais necessária, devido ao ritmo acelerado de seu consumo.
tornam acima dos requeridos pelas culturas. Este fato leva também a elevadas e contínuas perdas de P por escoamento superficial e drenagem. Segundo Lelis et al. (2009) o fósforo e nitrogênio presentes no solo em forma de ácido fítico é disponibilizado pela microbiota do solo, e por lixiviação, contaminam os mananciais de água, beneficiando o crescimento de algas aquáticas. Ao serem decompostas, as algas aumentam a demanda por oxigênio na água, podendo levar a morte de animais aquáticos.
1.2.4. Fator antinutricional do fitato
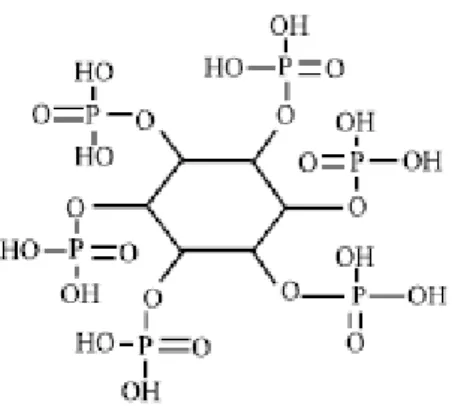
O fitato (C6H18O24P6) é uma molécula cíclica simples, carreando seis fosfatos,
com teor de fósforo de 28,16%. Apresenta algumas características específicas de acordo com o ambiente em que se encontram. Em pH ácido o fitato poderá estar levemente carregado negativamente ou em pH neutro/alcalino, fortemente carregado negativamente, conforme demonstrado nas figuras 1 e 2, respectivamente.
Figura 2. Etrutura do ácido fítico em pH básico, elucidando o encontrado a partir do duodeno em aves (Adaptado de COULIBALY et al., 2011)
Conforme demostrado nas figuras, o pH influencia a afinidade do fitato por cátions no trato gastrintestinal. Este fato está correlacionado com a constante de dissociação da molécula (SANTOS, 2012). A fitase deve ser capaz de hidrolisar a molécula de fitato durante o processo digestivo caracterizado pela fase ácida do trato das aves (proventrículo e moela) e suínos (estômago). Nestas condições o ácido fítico se encontra solúvel porém associado às proteínas que tem seus pontos isoelétricos na faixa de 4,5. Quando o pH no trato digestivo fica abaixo do ponto isoelétrico da proteína, ela fica carregada positivamente, permitindo que o ácido fítico (ânion) se ligue a ela, alterando-a e tornando-a insolúvel (REDDY et al., 1989). Esta interação fitato-proteína, acarreta em menor digestibilidade, pois reduz a atuação das proteases digestivas, resultando no aumento de secreção de pepsina, acarretando em perdas endógenas (VAINTRAUB; BULMAGA, 1991, KONIETZNY; GREINER, 2002, KIES et al., 2006, COWIESON; SELLE; RAVINDRAN, 2008).
O fitato tem uma maior afinidade por íons de cobre e zinco em pH básico (SELLE & RAVINDRAN, 2007). No entanto, em dietas com concentrações altas de cálcio há formação de complexos Ca-fitato formando sais que se precipitam e reduzem a disponibilidade dos minerais, em pH básico (LEI & PORRES, 2003).
Segundo Selle, Cowieson e Ravindran (2009), é improvável que o Ca esteja ligado com o fitato nos ingredientes de origem vegetal, uma vez que eles possuem baixa concentração desse mineral. Entretanto, como as aves tem uma exigência maior de Ca, fontes externas deste mineral fazem parte da formulação das dietas, passando a existir formação significativa de complexos no trato gastrointestinal. Nestas condições, estima-se que aproximadamente um terço do Ca dietético forme complexos com o fitato durante a passagem da ração pelo intestino (NAVES, 2014).
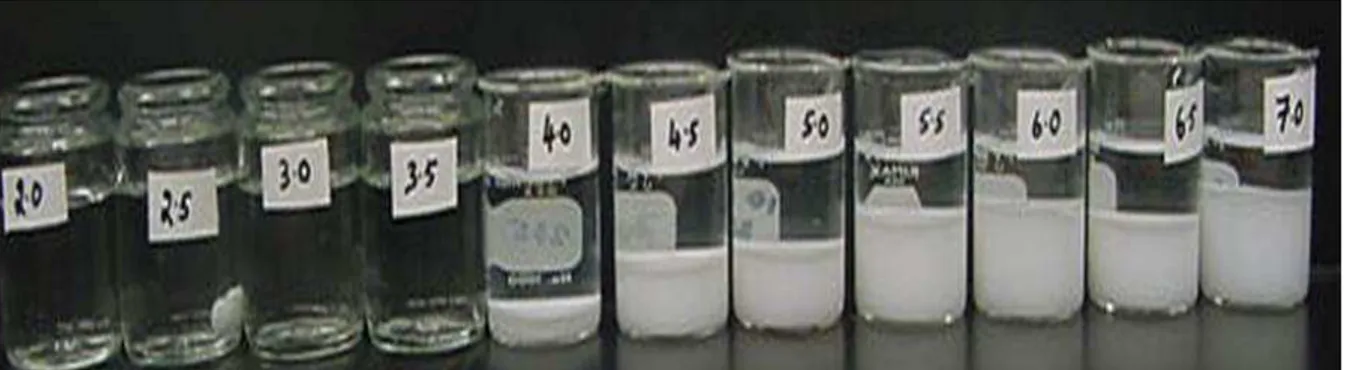
Podemos observar a partir da figura 3 como a molécula de ácido fítico aumenta a afinidade por cátions a medida que o pH se torna mais básico.
Figura 3 – Solubilidade do fitato em pH de 2,0 a 7,0 na presença de Ca em concentração similar ao encontrado no trato gastrintestinal dos animais (Fonte: Universidade de Maryland, dados não publicados; citado por Gomes, 2013)
De acordo com Cowieson e Cowieson (2011), o fitato diminui a solubilidade da proteína através da interação eletrostática, fazendo com que os nutrientes apresentem menos água ao seu redor, reduzindo sua solubilidade e consequentemente a digestibilidade.
2. REFERÊNCIAS
AUGSPURGER, N. I.; BAKER, D. H. Phytase improves dietary calcium utilization in chicks, and oyster shell, carbonate, citrate, and citrate malate forms of calcium are equally bioavailable. Nutrition Research. v. 24, p. 293-301, 2004.
AUGSPURGER, N. I.; WEBEL D. M.; LEI X. G.; BAKER, D D. H. Efficacy of an E. coli phytase expressed in yeast for releasing phytate-bound phosphorus in young chicks and pigs. J. Anim. Sci. v. 81, p. 474–483, 2003.
BESLIN, J. J. Phytase - A Key to Unlock Phytate Complex. Int. J. Pure App. Biosci. v.2 n.6, p.304-313, 2014.
BITAR, K.; REINHOLD, J.G. Phytase and alkaline phospatase activities in intestinal mucosae of rat, chicken, calf and man. Biochimica Biophysica Acta. v.268, p.442-52, 1972.
CAMPESTRINI E.; SILVA V. T. M.; APPELT M. D. Utilização de enzimas na alimentação animal. Revista Eletrônica Nutritime, v. 6, n. 2, p.254-267, 2005.
CHUNG, T. K.; RUTHERFURD S. M.; THOMAS D. V.; MOUGHAN, P. J. Effect of two microbial phytases on mineral availability and retention and bone mineral density in low-phosphorus diets for broilers. British Poultry Science, v.54, p.362-373, 2013.
COULIBALY, A.; B. KOUAKOU AND J. CHEN. Phytic acid in cereal grains: Structure, healthy or harmful ways to reduce phytic acid in cereal grains and their effects on nutritional quality. Am. J. Plant Nutr. Fertiliz. Technol, v.1, p. 1-22, 2011.
Cowieson, A.J.; Acamovic, T.; Bedford, M.R. The effect of phytase and phytic acid on the endogenous loss from broiler chickens. British Poultry Science, v. 45, p. 101 – 108, 2004.
COWIESON, A.J.; COWIESON, N.P. Phytate and the thermodynamics of water. Australian Poultry Symposium, p. 11, 2011.
COWIESON, A.J.; SELLE, P.H. E RAVINDRAN, V. Uso de Fitase e suas implicações na digestão e absorção de nutrientes. Anais... Conferência APINCO, 2008.
CROMWELL, G.L. Metabolism and role of phosphorus, calcium, and vitamin D3 in swine nutrition. Phytase in Animal Nutrition and Waste Management. p. 101- 110, 1996.
Engelen, A. J.; Van Der Heeft F. C.; Randsdorp, P. H.; Smit E. L. Simple and rapid determination of phytase activity. Journal of AOAC International, v.77, p.760-764, 1994.
FERKET, P. R. Pratical use of feed enzymes for turkeys and broilers. Journal Applied of Poultry Research, v.2, p.75-81, 1993
FUKAYAMA, E. H.; SAKOMURA, N. K.; DOURADO, L. R. B.; NEME, R.; FERNANDES, J. B. K.; MARCATO, S. M. Efeito da suplementação de fitase sobre o desempenho e a digestibilidade dos nutrientes em frangos de corte. Revista Brasileira de Zootecncia, v.37, n.4, p.629-635, 2008.
GAUTHIER, R. Intestinal health, the key to productivity: the case of organic acids. Em: CONVENCION ANECA-WPDC. Anais… Puerto Vallarta. WPDC, p. 1-14, 2002.
GOMES, G. A. 2013. Fitase e suas implicações na digestão e absorção de nutrientes. [S.l.]: Engormix Web Site, 2013. http://pt.engormix.com. Acesso em 09 fev. 2015.
GUTIÉRREZ-ROJAS, M; AURIA, R.; BENET,J.C.; REVAH, S. A mathematical model for solid state fermentation of mycelial fungi on inert support. The Chemical Engineering Journal, v. 60, p. 189-198, 1995.
HEINZL, W. Technical specifications of natuphos. BASF Technical Syniposium. World Congress Center, Atlanta, Georgia. January 23, p. 39-70, 1996.
IGBASAN, F. A.; MÄNNER, K; MIKSCH, G.; BORRISS R.; FAROUK, A.; SIMONE, O. Comparative studies on the in vitro properties of phytases from various microbial origins, Archiv für Tierernaehrung, v. 53, p. 353-373, 2000.
KARIM, A. Responses of broiler chicks to non-phytate phosphorus levels and phytase supplementation. International Journal of Poultry Science, v.5, p.251-254, 2006.
KHODAMBASH N.; EMAMI I.; ZAFARI NAEINI S.; RUIZ-FERIA C. A. Growth performance, digestibility, immune response and intestinal morphology of male broilers fed phosphorus deficient diets supplemented with microbial phytase and organic acids. Livestock Science,v. 157, n. 2, p. 506 – 513, 2013.
KIES, A.K.; DE JONGE, L.H.; KEMME, P.A.; JONGBLOED, A.W.. Interaction between protein, phytate, and microbial phytase. In vitro studies. J. Agric. Food Chem. v.54, p.1753–1758, 2006.
KIM, T.; MULLANEY, E. J.; PORRES, J. M. Shifting the ph profile of Aspergillus niger phy A phytase to match the stomach ph enhances its effectiveness as an animal feed additive. Applied and Environmental Microbiology. v.72, n.6, p. 4397-4403, 2006.
LANA, R. P. Uso racional de recursos naturais não-renováveis: aspectos biológicos, econômicos e ambientais. Revista Brasileira de Zootecnia, v. 38, p. 330-340, 2009.
LAURENTIZ, A. C.; JUNQUEIRA, O. M.; FILARDI, R. S.; DUARTE, K. F.; ASSUENA, V.; SGAVIOLI, S. Desempenho, composição da cama, das tíbias, do fígado e das excretas de frangos de corte alimentados com rações contendo fitase e baixos níveis de fósforo. Revista Brasileira de Zootecnia, v.38, n.10, p.1938-1947, 2009.
LEHNINGER, A. L. 1994. Principios de Bioquímica. Sarvie, São Paulo, Brasil.
LEI, X. G.; PORRES, J. M. Phytase enzymology, applications, and biotechnology. Biotechnology Letters, v.25, p.1787-1794, 2003.
LELIS, G.R.; ALBINO, L.F.T.; TAVERNARI, F.C. E ROSTAGNO, H.S. Suplementação dietética de fitase em dietas para frangos de corte. Revista Eletrônica Nutritime, v.6, n.2, p.875- 889, 2009.
LIU, S. Y.; CADOGAN D. J.; PÉRON A.; TRUONG H. H.; SELLE P. H. Effects of phytase supplementation on growth performance, nutrient utilization and digestive dynamics of starch and protein in broiler chickens offered maize, sorghum and wheat based diets. Anim. Feed Sci. Tech. v. 197, p.164–175, 2014.
MCCLEARY B.V. Analysis of feed enzymes. In: BEDFORD, M.R. & PARTRIDGE, G.G. Anais…Enzymes in farm animal nutrition. Oxford: CAB PUBLISHING, 2001.
MCDOWELL, L. Minerals in animal and human nutrition. Amsterdan: Elsevier Science, 2003. p. 235-270.
MITCHELL, R. D.; EDWARDS, H. M. Effect of phytase and 1,25 dihydroxycholecalciferol on phytate utilization and the quantitative requirement for calcium and phosphorus in young broiler chickens. Poult. Sci., v. 75, p. 95-110, 1996.
NAHM, K.H. Efficient phosphurus utilization in poultry feeding to lessen the environmental impact of excreta. World´s Poultry Science Journal, v.63, p.625-645, 2007.
NASCIMENTO, J. C. S. Produção, caracterização bioquímica e purificação de fitase produzida por Aspergillus niger var. phoenicis URM 4924. 2011. 99 f. Dissertação (Mestrado em Biociência Animal) - Universidade Federal de Pernambuco, Recife, 2011.
NAVES, L. P. Efeito antinutricional do ácido fítico sobre o cálcio e uso de fitase em dietas de frangos de corte. Revista Eletrônica Nutritime. v.11, n. 03, p. 3399-3409, 2014.
PILLAI, P. B.; O’CONNOR-DENNIE, T.; OWENS C. M.; EMMERT, J. L. Efficacy of an Escherichia coli Phytase in Broilers Fed Adequate or Reduced Phosphorus Diets and Its Effect on Carcass Characteristics. Poultry. Science, v. 85, n. 10, p. 1737-1745, 2006.
RAGON, M.; AUMELAS, A.; CHEMARDIN, P.; GALVEZ, S.; MOULIN G.; BOZE H. Complete hydrolysis of myo-inositol hexakisphosphate by a novel phytase from Debaryomyces castellii CBS 2923. Applied Microbiology and Biotechnology, v.78, p.47-53, 2008.
REDDY N. R., PIERSON M. D., SATHE S. K. AND SALUNKHE D. K. Phytates in cereals and legumes. CRC Press, Inc., Boca Raton, Florida, p. 152, 1989.
RODRIGUEZ, E.; PORRES, J. M.; HAN, Y.; LEI, X. G. Different sensitivity of recombinant Aspergillus niger phytase (rPhyA) and Escherichia coli pH 2.5 acid phosphatase (r-AppA) to trypsin and pepsin in vitro. Arch. Biochem. Biophys. v. 365, p. 262–267, 1999.
RUTHERFURD, S. M.; CHUNG, T. K.; MOREL, P. C. H.; MOUGHAN, P. J. Effect of Microbial Phytase on Ileal Digestibility of Phytate Phosphorus, Total Phosphorus, and Amino Acids in a Low-Phosphorus Diet for Broilers. Poultry Science, v. 83, p. 61–68, 2003.
RUTHERFURD, S. M.; CHUNG, T. K.; THOMAS, D. V.; ZOU, M. L.; MOUGHAN, P.J. Effect of a novel phytase on growth performance, apparent metabolizable energy, and the availability of minerals and amino acids in a low-phosphorus corn-soybean meal diet for broilers. Poult Sci. v.91, n. 5, p. 1118-1127, 2012.
SALMON, D.N.X. Desenvolvimento de um bioprocesso para a produção, caracterização e recuperação da fitase de Schizophyllum commune obtida por
fermentação em estado sólido. 2011. 107p. Dissertação (Mestrado em Processos
Biotecnológicos) - Universidade Federal do Paraná, Curitiba, 2011.
SANTOS, F. R.; HRUBY, M., PIERSON, E. E. M.; REMUS, J. C., SAKOMURA, N. K. Effect of Phytase Supplementation in Diets on Nutrient Digestibility and Performance in Broiler Chicks. J. Appl. Poult. Res. v. 17, p. 191–201, 2008.
SANTOS, T.T. Phytate: anti-nutrient for poultry and swine. Feedstuffs, v. 84p. 1-3., 2012.
SELLE, P. H.; COWIESON, A. J.; RAVINDRAN, V. Consequences of calcium interactions with phytate and phytase for poultry and pigs. Livestock Science, v. 124, p.126-141, 2009.
SELLE, P. H.; RAVINDRAN, V. Phytate-degrading enzymes in pig nutrition. Livestock Science, v.133, p. 9-122, 2008.
SELLE, P.H.; RAVINDRAN, V. Microbial phytase in poultry nutrition. Animal Feed Science and Technology, v. 135, p. 1-41, 2007.
SINGH, P. K.; KHATTA, V. K. Effect of phytase supplementation on the performance of broiler chickens fed wheat based diets. Indian J. Anim. Nutr., v.20, p.57-62, 2003.
SOTO-SALANOVA; M. F.; GARCIA, O.; GRAHAM, H. PACK, M. Uso de enzimas em dietas de milho e soja para frangos de corte. Em: CONFERÊNCIA APINCO DE CIÊNCIA E TECNOLOGIA AVÍCOLA, 1996, Campinas. Anais... Campinas: FACTA, p.71-76. 1996.
VAINTRAUB, I. A. AND V. P. BULMAGA. Effect of phytate on the in vitro activity of digestive proteinases. J. Agric. Food Chem. v.39, p. 859-861, 1991.
CAPÍTULO 2 - COMPARISON OF AN Escherichia coli AND A Buttiauxella PHYTASES ON PHOSPHORUS BIOAVAILABILITY, LITTER COMPOSITION, BONE CHARACTERISTICS AND FEED COSTS
ABSTRACT - An experiment was conducted to evaluate the effects of two microbial phytases on performance, bioavailability of phosphorus, bone mineralization, nutrient excretion and economic evaluation in diets for broiler chickens. A total 2,160 Cobb 500 male day old chicks were assigned to nine treatments and eight replicates containing 30 birds each were distributed in a completely randomized design. The treatments were: T1 - Positive Control (PC); T2 - Negative Control 1 (NC1) – reduction of 0.14% P and 0.13% Ca; T3 - Negative Control 2 (NC2) - reduction of 0.17% P and 0.16% Ca; T4 - NC2 + phytase A (250 FTU/kg); T5 - NC2 + phytase A (500 FTU/kg); T6 - NC2 + phytase A (1000 FTU/kg); T7 - NC2 + phytase B (250 FTU/kg); T8 - NC2 + phytase B (500 FTU/kg); T9 - NC2 + phytase B (1000 FTU/kg). Standard curve method was utilized to obtained the bioavailability of P in response of performance variables and bone mineralization. Regressions were performed on performance data, bone mineralization and excretion of nutrients to determine the optimal level inclusion of each phytase. The phosphorus content in bone proved to be the best parameter to evaluate bioavailability. Phytase A have a higher efficiency for body weight gain and feed intake in concentrations around 500 FTU/kg, while phytase B, around 1000 FTU/kg. There was reductions in levels of total phosphorus and soluble phosphorus with the addition of phytase in the diet. Through the bioavailability calculated by ash content and tibia weight gain, was also observed that phytase B is more efficient in depositing ash in the bones and in reducing nutrient excretion in litter, while the phytase A is most effective for body weight gain. Mineral contents as P, Zn and Ash and deflection force of tibias were improved by adding phytase to the diets. Both phytases in concentrations of 250 FTU/kg generated greater return, estimated using the dicalcium phosphate price of $0.50.
1. INTRODUCTION
The phosphate reserves in the world that can be explored at low cost will soon become increasingly scarce (Lana, 2009). Therefore, there is an increasing trend in the cost of phosphorus sources. In this sense, the use of exogenous phytase in plant origin diets is an alternative to reduce the use of inorganic phosphate in feed formulation and to reduce the feed cost. In Brazil, due to high costs of phosphorus sources and their economic viability, phytase is the most common exogenous enzyme used in poultry feed. Today the total enzyme market is estimated to be about 3-5 billion dollars per year worldwide (Adeola and Cowieson, 2011).
Corn and soybean meal are commonly used in the diet of broilers and have around 66% their total phosphorus content in the form of phytate, making the phosphorus unavailable to birds (Ravindran et al., 1995). Inclusion of phytase in the diet can improve the availability of phosphorus and reduce P excretion by birds, and therefore reduces the contamination of the environment (Musapuor et al., 2006).
The poultry manure contaminates the ground and water because of its high level of phosphorus and nitrogen through a process called translocation (Conffey, 1992). The phosphorus that reaches the water sources, stimulates the growth of algae by a process called eutrophication. The decomposition of the algae affects the water quality, reducing its oxygen content and increasing the competition of plants and aquatic animals for oxygen, causing their death (Cromwell et al., 1995).
The importance of phytase on economic and environmental aspects is increasing in recent years, and the industries are searching for another way of producing phytase, such as different microorganisms (Kaur et al., 2009). So there is always the need to collect information on new phytases.
2. MATERIALS AND METHODS
2.1. Birds and housing
The trial was conducted at the Laboratory of Poultry Sciences, Department of Animal Science, Faculty of Agriculture and Veterinary Sciences - UNESP, Jaboticabal, Brazil.
All experimental procedures were approved by the Ethics Committee on Animal Use (CEUA - 013022/14).
A total 2,169 Cobb 500 male day old chicks were housed in an experimental facility, with tunnel type system to control the environment. The control of temperature, humidity and air exchange were performed automatically by exhaust fans and climate control system, according to the age of the birds (COBB, 2006). During the starter phase incandescent lamps were used as heating source according to the needs of poultry. New shaving litter was used in all experimental plots. Nipple drinkers were used during all rearing phases. Infant tubular feeders were used until 14 days of age, then replaced to adult tubular feeders.
Water and feed were offered ad libitum during all the trial period. The lighting program was set at 24 hours of light.
The birds were vaccinated against coccidiosis on the 1st day of life (via ocular), against Gumboro disease at six days old (low strain), New Castle disease at 11 days old and strengthening Gumboro at 16 days of age (strong strain), administered via water.
2.2. Experimental design
The birds were weighed (53 ± 1g) and distributed in a completely randomized design with nine treatments and eight replicates of 30 chicks each. Each treatment had similar body weight means.
- reduction of 0.17% avP and 0.16% tCa; T4 - NC2 + phytase A (250 FTU/kg); T5 - NC2
+ phytase A (500 FTU/kg); T6 - NC2 + phytase A (1000 FTU/kg); T7 - NC2 + phytase B (250 FTU/kg); T8 - NC2 + phytase B (500 FTU/kg); T9 - NC2 + phytase B (1000 FTU/kg).
2.3. Experimental diets
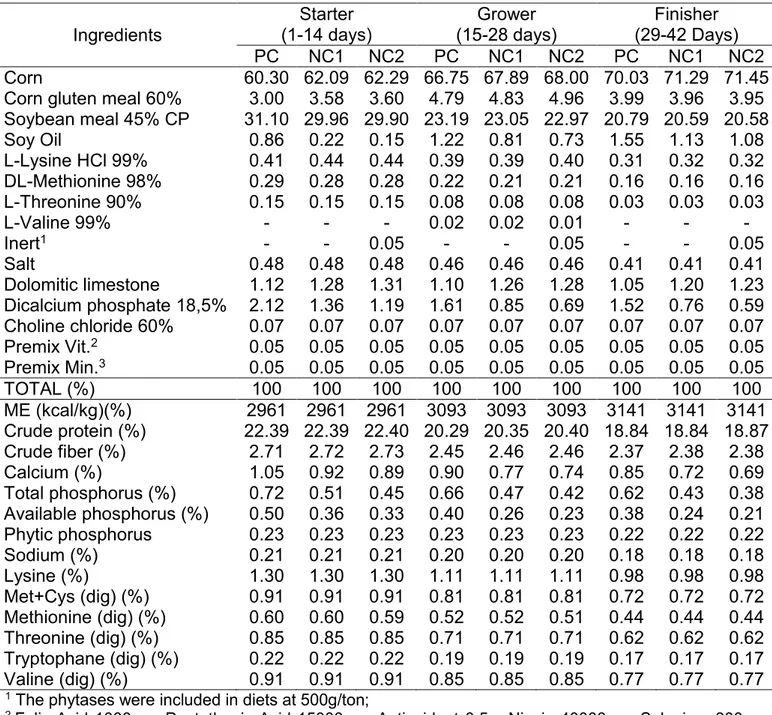
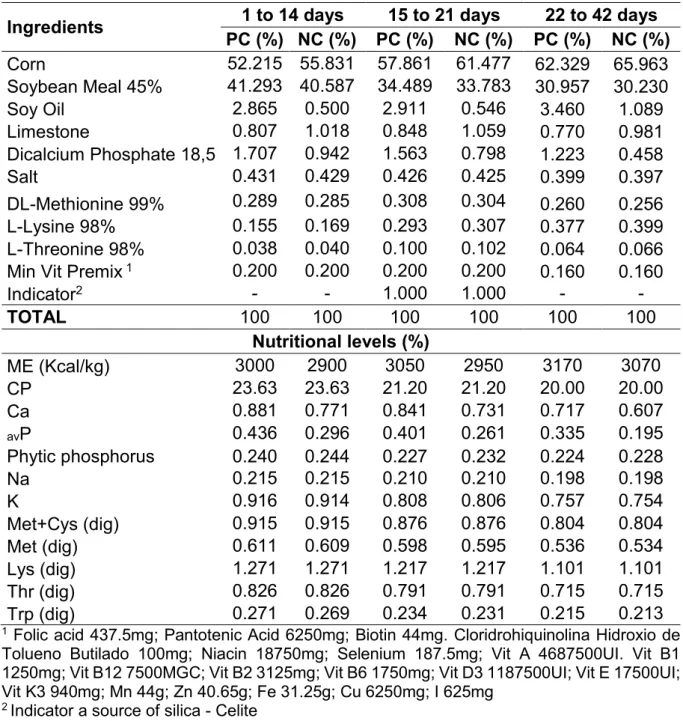
The positive control diet was formulated to meet the nutritional requirements of broilers (NRC, 1994), except for energy and amino acids, which were reduced based on the phytase matrix for all diets (reduction 62 kcal/kg ME and aminoácids: lysine, methionine, methionine + cysteine, threonine, tryptophane and valine, based on 500 U/kg contribution from phytase B) The negative control diets had also reduced levels of Ca and avP. The Table 1 describes the control diets and their nutritional compositions
Table 1.Compositionof experimental diets and calculated nutritional values
Ingredients (1-14 days) Starter (15-28 days) Grower (29-42 Days) Finisher PC NC1 NC2 PC NC1 NC2 PC NC1 NC2 Corn 60.30 62.09 62.29 66.75 67.89 68.00 70.03 71.29 71.45 Corn gluten meal 60% 3.00 3.58 3.60 4.79 4.83 4.96 3.99 3.96 3.95 Soybean meal 45% CP 31.10 29.96 29.90 23.19 23.05 22.97 20.79 20.59 20.58 Soy Oil 0.86 0.22 0.15 1.22 0.81 0.73 1.55 1.13 1.08 L-Lysine HCl 99% 0.41 0.44 0.44 0.39 0.39 0.40 0.31 0.32 0.32 DL-Methionine 98% 0.29 0.28 0.28 0.22 0.21 0.21 0.16 0.16 0.16 L-Threonine 90% 0.15 0.15 0.15 0.08 0.08 0.08 0.03 0.03 0.03
L-Valine 99% - - - 0.02 0.02 0.01 - - -
Inert1 - - 0.05 - - 0.05 - - 0.05
Salt 0.48 0.48 0.48 0.46 0.46 0.46 0.41 0.41 0.41 Dolomitic limestone 1.12 1.28 1.31 1.10 1.26 1.28 1.05 1.20 1.23 Dicalcium phosphate 18,5% 2.12 1.36 1.19 1.61 0.85 0.69 1.52 0.76 0.59 Choline chloride 60% 0.07 0.07 0.07 0.07 0.07 0.07 0.07 0.07 0.07 Premix Vit.2 0.05 0.05 0.05 0.05 0.05 0.05 0.05 0.05 0.05
Premix Min.3 0.05 0.05 0.05 0.05 0.05 0.05 0.05 0.05 0.05
TOTAL (%) 100 100 100 100 100 100 100 100 100 ME (kcal/kg)(%) 2961 2961 2961 3093 3093 3093 3141 3141 3141 Crude protein (%) 22.39 22.39 22.40 20.29 20.35 20.40 18.84 18.84 18.87 Crude fiber (%) 2.71 2.72 2.73 2.45 2.46 2.46 2.37 2.38 2.38 Calcium (%) 1.05 0.92 0.89 0.90 0.77 0.74 0.85 0.72 0.69 Total phosphorus (%) 0.72 0.51 0.45 0.66 0.47 0.42 0.62 0.43 0.38 Available phosphorus (%) 0.50 0.36 0.33 0.40 0.26 0.23 0.38 0.24 0.21 Phytic phosphorus 0.23 0.23 0.23 0.23 0.23 0.23 0.22 0.22 0.22 Sodium (%) 0.21 0.21 0.21 0.20 0.20 0.20 0.18 0.18 0.18 Lysine (%) 1.30 1.30 1.30 1.11 1.11 1.11 0.98 0.98 0.98 Met+Cys (dig) (%) 0.91 0.91 0.91 0.81 0.81 0.81 0.72 0.72 0.72 Methionine (dig) (%) 0.60 0.60 0.59 0.52 0.52 0.51 0.44 0.44 0.44 Threonine (dig) (%) 0.85 0.85 0.85 0.71 0.71 0.71 0.62 0.62 0.62 Tryptophane (dig) (%) 0.22 0.22 0.22 0.19 0.19 0.19 0.17 0.17 0.17 Valine (dig) (%) 0.91 0.91 0.91 0.85 0.85 0.85 0.77 0.77 0.77
1 The phytases were included in diets at 500g/ton;
2 Folic Acid 1000mg, Pantothenic Acid 15000mg; Antioxidant 0.5g; Niacin 40000mg, Selenium 300mg,
Biotin 60mg, Vit B11800mg, Vit B12 12000mg; Vit B2 6000mg, Vit B6 2800mg, Vit D3 2,000,000 IU; Vit E
15000mg, Vit K3 1800mg;
2.4. Performance
At 42 days old, birds and feed leftovers were weighed. The performance parameters evaluated were: feed intake (FI), body weight gain (BWG) and feed conversion rate (FCR). Mortality was recorded daily and was used to adjust the total number of chicks to determine feed intake and feed conversion ratio (Sakomura e Rostagno et al., 2007).
2.5. Analysisoftibias
At 28 days of age, three birds from each replicate were sampled based on the average weight (± 5%), slaughtered by electro-narcosis followed by exsanguination and had their tibias removed, placed in labeled plastic bags according to the experimental pen and frozen. Once thawed, the tibias were stripped, identified and dried in a ventilated oven at 100ºC for 24 hours. The excess of fat of the tibias were removed by immersion in ethyl ether, until the total disappearance of fat. They were dried in a ventilated oven again at 100°C for 24 hours. After that, the tibias were individually weighed on a precision scale and then were ground in a ball mill ahead of determination of dry matter, ether extract, ash, calcium, phosphorus and zinc (Silva and Queiroz, 2009).
The weight of the defatted tibia was determined as the percentage of dry tibia after ether extraction. The ash percentage was determined based on the weight of ash from the dry defatted tibia. Calcium (Ca), Phosphorus (P) and Zinc (Zn) were determined from defatted dry tibia by nitro perchloric digestion (Silva and Queiroz, 2009).
velocity (10 mm/sec), with 80mm of distance between the support. The result was obtained considering the time to break the bone.
2.6. Analysisof nutrients in thelitter
At 42 days, samples of litter were collected at three points of each experimental pen. These points were standardized, far from feeders and drinker areas. The three sub-samples for each experimental unit were mixed and thoroughly homogenized.
All samples were processed on the day of collection in a knife mill with a sieve of one millimeter. Total and soluble phosphorus were determined using spectrophotometric molybdate-vanadate, after nitro-perchloric digestion, as described by Leytem et al. (2007). Nitrogen was determined according to the methodology of Silva and Queiroz (2009) and corrected for dry matter.
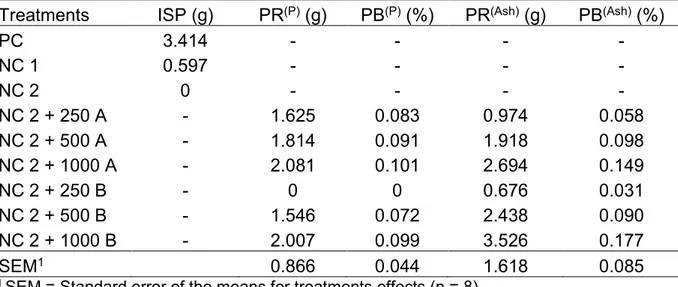
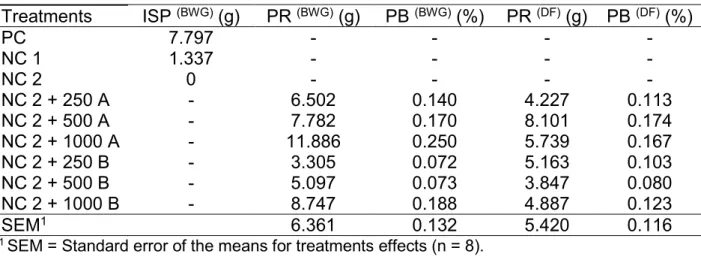
2.7. Phosphorus Bioavailability
Phosphorus bioavailability was calculated using standard curve concept. To establish the standard curve, the intake of supplementary phosphorus (ISP) of treatments PC, NC1 and NC2 were calculated, according to formula:
feed intake g
suplementary dietary P %
ISP g100
Supplementary dietary P was considered null in the most deficient treatment (NC2); 0.03 for NC1; and 0.17% for PC; being these values the difference of avP
between NC2 and the other treatments.
The results of performance and bone characteristics variables of the treatments with phytase addition were confronted with their respective standard curve, in order to obtain the total phosphorus released (PR) in grams. The formula below demonstrates the calculation to obtain the nutritional matrix (bioavailability) of avP of the phytase
enzyme, being considered the feed intake of the bird and the phosphorus released.
PR g
BP % 100
FI g
2.8. Cost of diets analysis
The cost analysis of the diets was performed to determine the economy of including phytases at different levels. For these calculations data of phosphorus bioavailability of BWG and the dicalcium phosphate cost were used.
The calculation of the amount of inorganic dicalcium phosphate which could be replaced by phytases inclusions (250, 500 and 1000 FTU) in the diet, based on the bioavailability found for these phytases inclusions.
The price of dicalcium phosphate was recorded on first quarter of 2015, with a valueof US$0.50/kg (MFRural, 2015). The prices of phytase A and B were considered as US$17.00 and US$15.00, respectively.
2.9. Statisticalanalysis
Data were analyzed by GLM method (general linear model) of SAS 9.0 (SAS Institute, 2002). The errors in the statistical models were normally and independently distributed with constant variance. Three orthogonal contrasts were constructed in order to verify the effectiveness of phytases for the evaluated variables in this study:
C2 = T3 vs (T4, T5, T6, T7, T8, T9), to verify how much of the evaluated variables responses is due to phytase supplementation.
C3 = (T4, T5, T6) vs (T7, T8, T9), to verify if there are diferences between both phytases inclusion in diets with reduced levels of Ca and P.
Regression analyses were fitted on performance, litter quality parameters, and bone minerals data to determine utilization level of phytases, using T3 as the zero level of phytase inclusion, T4 and T7, T5 and T8, T6 and T9, as levels 250, 500 and 1000 FTU/kg for phytases A and B, respectively. Linear (L), quadratic (Q) and quadratic-plateau (QP) models were used to analyse the different enzymes levels on the variables responses.
The QP model was adjusted according to Robbins et al. (2006),
2
i i
Y L U R Phy , i = 1,2...n1, n1+1,...,n; in which (R - Phyi)2 = 0 for i ≥ n1 +
1, n1 is the number of observations up to the breaking point, n is the number of
observation pairs, estimated by the equation. The Yi is the response of the estimated
variable to the phytase level in the diet; Phyi is the level of phytase in the diet; L is asymptotic response of the function; U is slope at the breaking point; and R is the phytase level estimated by the breaking point.
3.0 RESULTS
3.1 Phytase to maximize the performance of broilers
Table 2. Feed intake (FI), body weight gain (BWG) and feed conversion (FCR), of broilers submitted to phytase at different concentrations at 42 days and contrast analysis
Treatments n FI (g) BWG (g) FCR (g:g)
T1 - PC 8 4586.6 2660.7 1.720
T2 - NC 1 8 4455.5 2579.1 1.728
T3 - NC 2 8 4315.5 2511.9 1.718
T4 - NC 2 + 250 A 8 4529.3 2649.2 1.710
T5 - NC 2 + 500 A 8 4539.5 2666.5 1.703
T6 - NC 2 + 1000 A 8 4639.6 2722.2 1.705
T7 - NC 2 + 250 B 8 4443.1 2605.8 1.706
T8 - NC 2 + 500 B 8 4489.7 2630.1 1.707
T9 - NC 2 + 1000 B 8 4569.0 2679.6 1.705
SEM1 131.6 82.4 0.021
p-value 0.0040 0.0023 0.2478
P-VALUE CONTRAST
CONTRASTS FI (g) BWG (g) FCR
C1: T1 vs (T4, T5, T6, T7, T8, T9) 0.1061 0.3657 0.1296 C2: T3 vs (T4, T5, T6, T7, T8, T9) 0.0004 0.0002 0.1219 C3: (T4, T5, T6) vs (T7, T8, T9) 0.1060 0.1257 0.9711
1 SEM = Standard error of the means for treatments effects;
n = number of observations.
The C2 contrast, which evaluates phytase action, showed significant effect (p≤0.01) to feed intake and body weight gain. The C1 and C3, which compare PC and the NC2 with phytase, and the comparison between both phytase groups, were not significant for any of the performance variables evaluated (p>0.05).
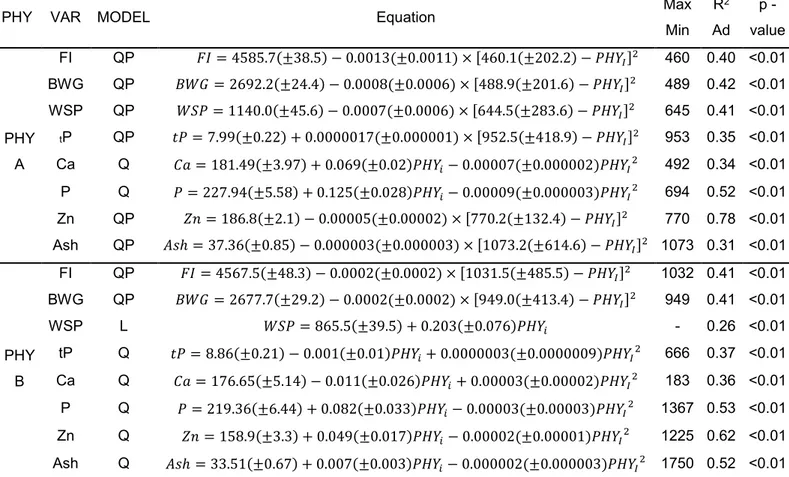
To obtain the concentration of phytase that leads to the maximum response of broilers, the L, Q and QP models were adjusted to describe the gradual inclusion of enzymes in the diet (Table 7). No model was adjusted to feed conversion since there was no response in function of the phytases concentrations studied.
The equations obtained to BWG and FI of phytases A and B were adjusted to QP, and are shown in Table 7. For Phytase A, the higher BWG (2,692g) occurred at a concentration of 489 FTU/kg and the maximum FI (4,586g) at 460 FTU/kg.
3.2. Effects of phytases on composition and quality of bone
In the evaluation of a phytase, it is important to consider the minerals that were available to animal. In this case, bones are an excellent criteria because the highest concentrations of Ca, P and Zn.
Table 3 presents the data of mineral composition and deflection force of tibias, and statistical results.
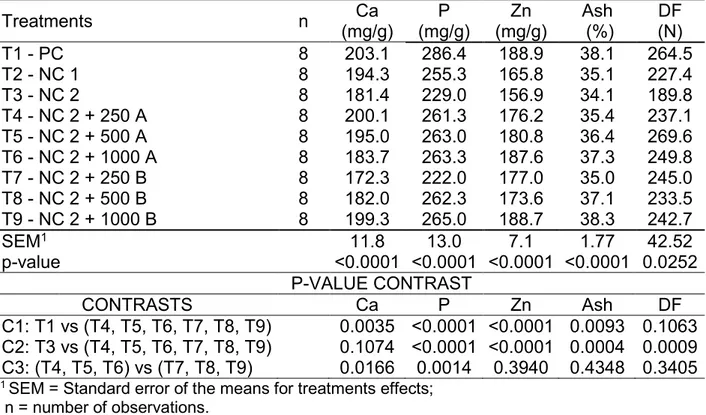
Table 3. Results of composition: calcium (Ca) phosphorus (P), zinc (Zn) and ash (Ash) of 28 days and deflection force (DF) of 42 days of broilers tibias and contrast analysis
Treatments n (mg/g)Ca (mg/g) P (mg/g) Zn (%) Ash (N) DF
T1 - PC 8 203.1 286.4 188.9 38.1 264.5
T2 - NC 1 8 194.3 255.3 165.8 35.1 227.4
T3 - NC 2 8 181.4 229.0 156.9 34.1 189.8
T4 - NC 2 + 250 A 8 200.1 261.3 176.2 35.4 237.1 T5 - NC 2 + 500 A 8 195.0 263.0 180.8 36.4 269.6 T6 - NC 2 + 1000 A 8 183.7 263.3 187.6 37.3 249.8 T7 - NC 2 + 250 B 8 172.3 222.0 177.0 35.0 245.0 T8 - NC 2 + 500 B 8 182.0 262.3 173.6 37.1 233.5 T9 - NC 2 + 1000 B 8 199.3 265.0 188.7 38.3 242.7
SEM1 11.8 13.0 7.1 1.77 42.52
p-value <0.0001 <0.0001 <0.0001 <0.0001 0.0252 P-VALUE CONTRAST
CONTRASTS Ca P Zn Ash DF
C1: T1 vs (T4, T5, T6, T7, T8, T9) 0.0035 <0.0001 <0.0001 0.0093 0.1063 C2: T3 vs (T4, T5, T6, T7, T8, T9) 0.1074 <0.0001 <0.0001 0.0004 0.0009 C3: (T4, T5, T6) vs (T7, T8, T9) 0.0166 0.0014 0.3940 0.4348 0.3405
1 SEM = Standard error of the means for treatments effects;
n = number of observations.
Trough C2 (p≤0.05), both phytases increased P, Zn and Ash deposition, and showed higher DF in comparison to NC. However, the levels of Ca, P, Zn and Ash were lower than those observed to PC (p≤0.05), as demonstrated by C1.
When comparing different enzymes groups (C3), it is possible to verify that enzyme A showed 4.5 and 5.1% higher deposition of Ca and P, respectively, than phytase B. C3 was not significant (p>0.05) to Zn, Ash and DF.
7. According to the fitted models, the maximum levels of Ca (198.5 mg/g), P (271.3 mg/g), Zn (186.8 mg/g) and ash (37.4 %) were obtained with concentrations of 492, 694, 770 and 1073 FTU/kg, respectively, from phytase A. Models fitted for phytase B showed that the maximum levels of P (275.4 mg/g), Zn (188.9 mg/g) and ash (39.6%) would be obtained with 1367, 1225, 1750 FTU/kg of phytase B, respectively. The derivation of the equation obtained for Ca showed a minimum value of 175.6 mg/g of bone at the concentration of 183 FTU/kg of phytase B.
3.3. Litter composition
It is well known that the phytase used in cereal-based diets for broilers promotes the breaking of the bonds of phytate chain, releasing minerals, carbohydrates and amino acids, making them available to the animals. Thus, there is an increase in the bioavailability of these nutrients, which affects the excreta profile of birds. Data of litter composition at 42 days are expressed on Table 4.
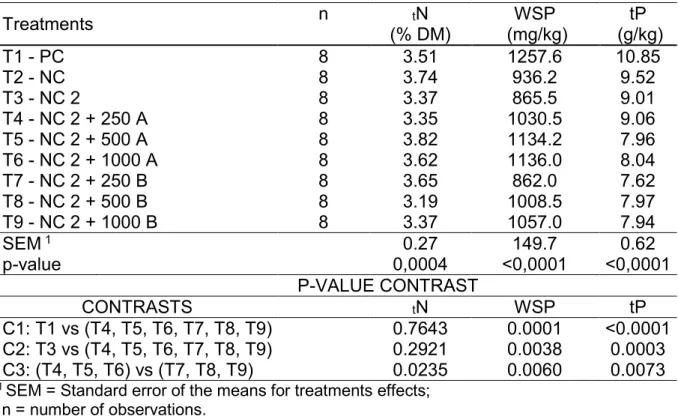
Table 4. Total nitrogen (tN), water soluble phosphorus (WSP) and total phosphorus
(tP) in litter of broilers fed different levels of phytase and contrast analysis results
Treatments n (% DM) tN (mg/kg) WSP (g/kg) tP
T1 - PC 8 3.51 1257.6 10.85
T2 - NC 8 3.74 936.2 9.52
T3 - NC 2 8 3.37 865.5 9.01
T4 - NC 2 + 250 A 8 3.35 1030.5 9.06
T5 - NC 2 + 500 A 8 3.82 1134.2 7.96
T6 - NC 2 + 1000 A 8 3.62 1136.0 8.04
T7 - NC 2 + 250 B 8 3.65 862.0 7.62
T8 - NC 2 + 500 B 8 3.19 1008.5 7.97
T9 - NC 2 + 1000 B 8 3.37 1057.0 7.94
SEM 1 0.27 149.7 0.62
p-value 0,0004 <0,0001 <0,0001
P-VALUE CONTRAST
CONTRASTS tN WSP tP
C1: T1 vs (T4, T5, T6, T7, T8, T9) 0.7643 0.0001 <0.0001 C2: T3 vs (T4, T5, T6, T7, T8, T9) 0.2921 0.0038 0.0003 C3: (T4, T5, T6) vs (T7, T8, T9) 0.0235 0.0060 0.0073
1 SEM = Standard error of the means for treatments effects;
From C3 it is possible to observe that tN in litter was higher to the birds that
received diets supplemented with phytase A. However, none model was able to describe the responses with gradative phytase inclusion. C1 and C2 analysis showed that the inclusion of phytases reduce WSP and tP excretion, reducing, their concentrations in litter. With C3 analysis, it is observed that phytase B presents lower
tN and tP excretion than phytase A. In the other hand, phytase A presents lower WSP
excretion, when compared to phytase B.
To evaluate the effect of different phytase on nutrients excretion, litter composition data were analyzed by Q, QP and L models (Table 7). Results showed that the maximum WSP excretion (1,140 mg/kg of litter) was at 645 FTU/kg of phytase A. For Pt, the same enzyme in the concentration of 953 FTU/kg, resulted in a lower excretion of Pt in litter (7.99 g/kg of litter).
Increasing phytase B caused a linear increase of WSP in litter. Our results indicated that Pt had a quadratic effect, and its first derivative, set equal to zero, determined the concentration of the enzyme (666FTU/kg) which provided the smaller amount of Pt in litter (7.53 g g/kg of litter). Based on the results obtained here, the addition of phytase to broilers diets reduced the concentration of total phosphorus in litter, while there was an increasing trend in the concentrations of WSP with increasing phytase concentration in the diets.
The values of WSP and Pt in the diets supplemented with phytases were smaller when compared to PC diet without reducing Ca and P (without phytase). Nitrogen content in litter did not show any significant response.
3.4. Bioavailability of phosphorus
To obtain the standard curve, the parameters Ash and P, evaluated at 28 days, and BWG and DF, evaluated at 42 days, were used.
Linear response was obtained, considering phosphorus in the tibia (P), with the three increasing levels of ISP (PC, NC1 and NC2). The regression obtained was: 𝑃 =