ABSTRACT
Precise phosphorus nutrition is important for significant reductions in both P pollution and ration costs. The influence of different levels (%) of dietary nPP fed from 0 to 20 d (0.45, 0.40, 0.35, 0.30, 0.25, compared with feeding 0.20 nPP with and without 500 F.T.U. of phytase per kg of diet) and from 21 to 36 d of age (0.414, 0.364, 0.314, 0.264, 0.214, compared with 0.164 nPP with and without 500 F.T.U. of phytase per kg of diet) were evaluate using a total of 588 day-old commercial broiler chicks. Each treatment was replicated four times in a completely randomized design. Body weight (BW), daily gain (DG), feed intake (DFI), feed conversion ratio, plasma P level and bone characteristics were determined, and from these data the P equivalency of the phytase was estimated. Feeding diets containing less than 0.40% of nPP to birds between 0 and 20d resulted in inferior BW, DFI, plasma P level and bone characteristics compared with the control. However, optimum FCR and mortality was supported at lower levels of nPP (0.25%). Between 21 and 36 d, 0.364% was enough to optimise BW, DFI, and femur ash (%); whilst only 0.314% or greater was needed to support optimum DG, toe and tibia ash and only 0.214 to 0.264% was required to optimise shank, femur and tibia lengths; FCR and survivability. A broken line analysis also showed that the nPP (%) requirement ranged from 0.267 to 0.410 and 0.272 to 0.380% during 0 to 20 and 21 to 36 d, respectively. Phytase supplementation improved performance and bone criterion and its P equivalency, depending upon the response of interest and birds age, ranged from 0.00 to 0.110%. In conclusion, the results showed that the combination of a lower level of nPP and phytase may be used to increase dietary P utilization, without severe changes in performance and bone quality.
INTRODUCTION
Phosphorus (P) is one of the most important and expensive macro minerals required by poultry and plays a vital role in the development and maintenance of the skeletal system and in numerous biochemical reactions in the body. The role of phosphorus and determination of its requirement in broiler nutrition has received a great deal of attention, and continues to do so, especially in the context of pollution from phosphorus run-off from agricultural operations (Waldroup, 1999; Bedford, 2000; Kies et al., 2001; Adeola & Sands, 2003). An important aspect of phosphorus nutrition is the digestibility of phytate phosphorus, a form of phosphorus that naturally occurs in feedstuffs of plant origin. In legumes and grains, phytate phosphorus represents about 50 to 75 percent of the total phosphorus content. Swine and chickens lack sufficient endogenous phytase to meaningfully digest the phosphorylated cyclic sugar alcohols, or phytate, present in their nAuthor(s)
Karimi A Bedford MR Sadeghi Gh Ghobadi Z
University of Kurdistan
nMail Adress
A Karimi
Department of Animal Science Faculty of Agriculture University of Kurdistan Sanandaj, 66177-14381 Kurdistan, IRAN.
E-mail: [email protected]
nKeywords
Bone ash, broiler, phosphorous, phytate, phytase.
Submitted: September/2010 Approved: January/2011
nAcknowledgements
feed (Bedford, 2000; Adeola & Sands, 2003; Selle et al., 2006).
The poor utilization of phytin-bound P by monogastric animals and its consequences on diet cost, the environment, and digestibility of minerals and protein have lead to extensive research efforts to understand the process of phytic acid digestion (Bedford, 2000; Kies et al., 2001; Adeola & Sands, 2003; Powell et al., 2008). During the last decade, several alternative methods for reducing the aforementioned negative impacts of phytate P on the environment and poultry performance have been recommended. Feeding birds with diets formulated closer to their nPP requirements, coupled with use of microbial phytase, are among the most successful strategies that have attracted scientific and practical attention (Simons et al., 1990; N.R.C, 1994; Summers, 1997; Sohail & Roland, 1999; Waldroup, 1999). It has been shown that the supplementation of poultry diets with phytase increases trace mineral absorption and amino acid digestibility, and reduces the amount of phosphorus in the manure. The extent of the observed effects, however, will depend on diet type (i.e., main cereals/oilseed meals), phytase inclusion rate, degree of inorganic phosphorus replacement, and dietary phosphorus content relative to the animal needs (Correl, 1999; Waldroup, 1999; Bedford, 2000; Kies
et al., 2001; Adeola & Sands, 2003; Yan & Waldroup, 2006; Olukosi et al., 2007, 2008). With regards to the effect of dietary phosphorus, researchers have found that lower concentrations of dietary phosphorus tend to increase the utilization of phytate phosphorus (Kilburn & Edwards, 2001) even in the absence of phytase.
The first objective of this study was to evaluate the influence of dietary nPP level on the performance and bone length and mineralization of broilers. The second objective was to estimate inorganic P equivalency of phytase considering different performance and bone criteria as dependent variables.
MATERIALS AND METHODS
Birds, housing and management
Five hundred and eighty eight one-day-old Ross®
308 broiler chicks (mixed sex) were used in a 36-day trial. Chicks were housed in 28 floor pens (1.25x1.4m), with wood shavings used as litter, throughout the experiment. Lighting was continuous for the first day post hatching, after which a 23L: 1D schedule was maintained for the duration of the experiment.
Temperature was maintained between 30 and 32ºC at the beginning of the rearing period and was gradually decreased by 2 to 3 ºC each week to a final temperature of 22 ºC at the end of rearing period. Chicks were given free access to the mash diets and to water during the experimental period. Care and management of the chicks were in accordance with commercial guidelines and were approved by University of Kurdistan Animal Ethics Committee.
Treatments and experimental design
Seven treatments were applied with different nPP concentrations (%), with the lowest nPP level being offered with or without microbial phytase at 500 F.T.U./ kg feed. Each experimental treatment was replicated four times and each replicate pen contained 21 chicks in a completely randomized experimental design.
Nutritional composition of the diets
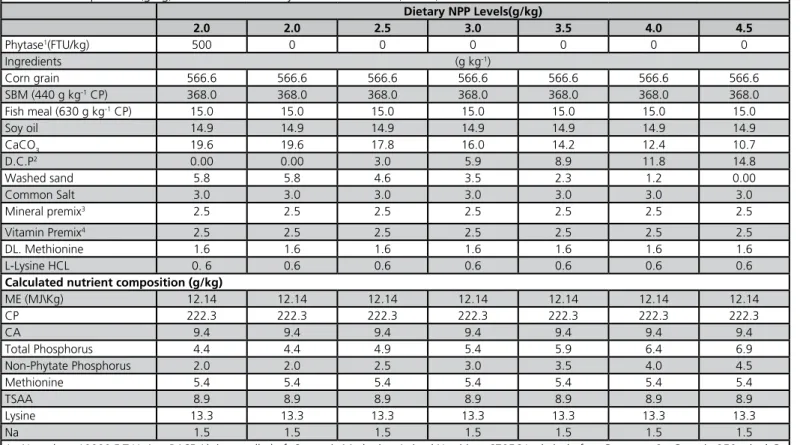
The corn-soybean meal-based starter diets were formulated to meet or exceed the requirements (NRC, 1994) for all nutrients, with the exception of nPP (Tables 1 and 2). Experimental diets formulated to contain different nPP levels (%) during 0 to 20 d (0.450, 0.400, 0.350, 0.300, 0.250, 0.200, and 0.200+500 F.T.U. kg-1 of phytase*) and 21 to 36 d (0.414, 0.364,
0.314, 0.264, 0.214, 0.164, and 0.164+500 F.T.U. kg-1 of phytase). Basal diets were formulated to be
isonitrogenous and isocaloric (Tables 1 and 2). The nutritional contents of the dietary ingredients were estimated from the feed composition tables of the National Research Council (1994); however, P and Ca contents in CaCO3 and DCP were measured by the supplier. The microbial phytase (EC 3.1.3.8; 10000 Ug-1, one unit of phytase activity is defined as the
quantity of enzyme required to produce 1 µmol of inorganic P/min from 5.1 mmol /L of sodium phytate at a pH of 5.5 and a temperature of 37 ºC) used in this study was an Aspergillus niger product (Natuphos, BASF) obtained from Vetaque company (BASF product distributor), P.O. Box 14655/ 174, Tehran, IRAN.
Parameters
Birds were weighed as a group on arrival and at 20 and 36 days of age on a pen basis. Feed intake recorded at 20 and 36 days. Feed conversion ratio (FCR) was calculated as feed intake/weight gain. Mortality was daily recorded and feed intake data
Table 1 - Composition (g/kg) and calculated analysis of starter diets (1-20d).
Dietary NPP Levels(g/kg)
2.0 2.0 2.5 3.0 3.5 4.0 4.5
Phytase1(FTU/kg) 500 0 0 0 0 0 0
Ingredients (g kg-1)
Corn grain 566.6 566.6 566.6 566.6 566.6 566.6 566.6
SBM (440 g kg-1 CP) 368.0 368.0 368.0 368.0 368.0 368.0 368.0
Fish meal (630 g kg-1 CP) 15.0 15.0 15.0 15.0 15.0 15.0 15.0
Soy oil 14.9 14.9 14.9 14.9 14.9 14.9 14.9
CaCO3 19.6 19.6 17.8 16.0 14.2 12.4 10.7
D.C.P2 0.00 0.00 3.0 5.9 8.9 11.8 14.8
Washed sand 5.8 5.8 4.6 3.5 2.3 1.2 0.00
Common Salt 3.0 3.0 3.0 3.0 3.0 3.0 3.0
Mineral premix3 2.5 2.5 2.5 2.5 2.5 2.5 2.5
Vitamin Premix4 2.5 2.5 2.5 2.5 2.5 2.5 2.5
DL. Methionine 1.6 1.6 1.6 1.6 1.6 1.6 1.6
L-Lysine HCL 0. 6 0.6 0.6 0.6 0.6 0.6 0.6
Calculated nutrient composition (g/kg)
ME (MJ\Kg) 12.14 12.14 12.14 12.14 12.14 12.14 12.14
CP 222.3 222.3 222.3 222.3 222.3 222.3 222.3
CA 9.4 9.4 9.4 9.4 9.4 9.4 9.4
Total Phosphorus 4.4 4.4 4.9 5.4 5.9 6.4 6.9
Non-Phytate Phosphorus 2.0 2.0 2.5 3.0 3.5 4.0 4.5
Methionine 5.4 5.4 5.4 5.4 5.4 5.4 5.4
TSAA 8.9 8.9 8.9 8.9 8.9 8.9 8.9
Lysine 13.3 13.3 13.3 13.3 13.3 13.3 13.3
Na 1.5 1.5 1.5 1.5 1.5 1.5 1.5
1 - Natuphos, 10000 F.T.U. /g , BASF Aktiengesellschaft Strategic Marketing Animal Nutrition, 67056 Ludwigshafen, Germany. 2 - Contain 250 g kg-1 Ca and 180 g kg-1 P. 3 - Provides per kg of diet: Vit. A, 9000 I.U.; Vit. D3, 2000 I.U.; Vit. E, 18 I.U.; Menadion, 2 mg; Thiamine, 1.8 mg; Riboflavin, 6.6 mg; Niacin, 30 mg; Pyridoxine, 3 mg; Vit B12, 15 mcg; D-Pantothenic acid , 100. mg; Folic acid, 1 mg; Biotin , 0.1 mg; Choline chloride, 500mg; Antioxidant, 100 mg. 4 - Provides per Kg of diet: Manganese, 100 mg; Zinc, 84.7 mg; Iron, 50 mg; Copper, 10 mg; Iodine, 1 mg; Se, 0.2 mg.
Table 2 - Composition (g/kg) and calculated analysis of grower diets (21-36d).
Dietary NPP Levels (g/kg)
Phytase1(FTU/kg) 1.64 1.64 2.14 2.64 3.14 3.64 4.14
Ingredients 500 0 0 0 0 0 0
Corn grain (g kg-1)
SBM (440 g kg-1 CP) 603.3 603.3 603.3 603.3 603.3 603.3 603.3
Fish meal (630 g kg-1 CP) 330.8 330.8 330.8 330.8 330.8 330.8 330.8
Soy oil 5.0 5.0 5.0 5.0 5.0 5.0 5.0
CaCO3 24.7 24.7 24.7 24.7 24.7 24.7 24.8
D.C.P2 19.6 19.6 17.8 16.1 14.3 12.5 10.7
Washed sand 0.00 0.00 2.9 5.9 8.8 11.8 14.8
Common Salt 5.9 5.9 4.7 3.6 2.4 1.2 0.00
Mineral premix3 3.1 3.1 3.1 3.1 3.1 3.1 3.1
Vitamin Premix4 2.5 2.5 2.5 2.5 2.5 2.5 2.5
DL. Methionine 2.5 2.5 2.5 2.5 2.5 2.5 2.5
L-Lysine HCL 1.9 1.9 1.9 1.9 1.9 1.9 1.9
0.7 0.7 0.7 0.7 0.7 0.7 0.7
Calculated nutrient composition (g/kg)
ME(KJ\kg) 12.56 12.56 12.56 12.56 12.56 12.56 12.56
CP 203.4 203.4 203.4 203.4 203.4 203.4 203.4
Ca 8.8 8.8 8.8 8.8 8.8 8.8 8.8
Total Phosphorus 3.98 3.98 4.48 4.98 5.48 5.98 6.48
Non-Phytate Phosphorus 1.64 1.64 2.14 2.64 3.14 3.64 4.14
Methionine 5.3 5.3 5.3 5.3 5.3 5.3 5.3
TSAA 8.0 8.0 8.5 8.5 8.5 8.5 8.5
Lysine 11.9 11.9 11.9 11.9 11.9 11.9 11.9
Na 1.5 1.5 1.5 1.5 1.5 1.5 1.5
were corrected for body weight of dead birds. Average body weight (BW), daily gain (DG), daily feed intake (DFI), and FCR were determined for each period and for the overall experiment. At the age of 20 and 36 days, four birds from each treatment, each as close to the pen average weight as possible, were selected for bone measurements. Birds were weighed, killed by cervical dislocation, and the whole left leg (including femur, tibia, shank) from each of the chicks was excised and defleshed without boiling. Legs were individually sealed in plastic bags to minimize moisture loss, and stored at -20 ºC until analysis. Legs were thawed before bone characteristics were determined. The femur, tibia and shank of each leg were excised by making a cut at the adjacent anterior and posterior joints. Femur, tibia and shank length was measured with a calliper with an accuracy of 0.001 cm. After removing the fat by extraction (femurs and tibias) in refluxing petroleum ether in a Soxhlet apparatus and drying at 105 ºC until a consistent weight was obtained, bone ash was determined by ashing in tarred ceramic crucibles for 12h at 605 ºC (AOAC,1990). The ash content was expressed as grams of ash per 100 grams of the defatted dry weight. The middle toe ash content was also determined at 36 d following the procedure above; but without defatting.
On 20d, blood samples were taken from four birds per dietary treatment to determine the phosphorus level of plasma, using an enzymatic kit produced by Zist Chimie Company (Tehran, Iran).
Statistical analysis
Pen average was used as the experimental unit for statistical analysis. Data were analyzed according to the General Linear Models (GLM) procedure of SAS statistical package (SAS institute, 1991) as a completely randomized experimental design. Mortality data were transformed to Öx+1 prior to analysis. Significant differences among treatments were determined at p<0.05 using Duncan’s new multiple range tests. In addition, nonlinear regression analysis was conducted to estimate nPP levels (inflection points) required for maximum performance parameters and bone characteristics using the PROC NLIN procedure of SAS (SAS Institute Inc., 1991), incorporating the SAS macro of Robbins (1979, 1986). Linear (Y=a+bx), logarithmic (Y= a+ln(x)) and quadratic (Y=ax2+bx+c) equations were
derived from nPP (%) concentration (x as independent variable) and the variables of interest (Y as dependent variable). These equations were solved to calculate optimal nPP concentrations and P equivalency values
of the phytase. The relationship between nPP level and performance and bone characteristics was studied using the CORR procedure of SAS (SAS institute, 1991).
RESULTS AND DISCUSSION
Effect of nPP level
The results of the experiment are summarized in Tables 3 to 9.
Starter period (0 to 20 d)
BW, DG, DFI, and plasma P level were significantly (p<0.05) reduced when diets containing less than 0.40 % nPP were offered (Table 3). FCR, on the other hand, significantly (p<0.05) deteriorated only when dietary nPP level was lower than 0.30%, whilst mortality increased only when nPP levels were as low as 0.2%. Feeding the 0.20% nPP diet had severe negative impacts on all assessed performance parameters.
Bone ash content and length was also significantly affected by reducing dietary nPP levels during the 0 to 20d period (Table 3). Tibia and femur ash content (%) deteriorated when dietary nPP was reduced below 0.40%. The length of different parts of the leg, including shank, tibia and femur, was also reduced (p<0.05) when dietary nPP level was reduced. The femur (optimal nPP level not lower than 0.45%) was more sensitive than the shank (0.40% or more required), which in turn was more sensitive than the tibia (0.35%).
Non-linear regression analysis (Table 8) showed that while 0.38 to 0.40 % nPP was sufficient to support most performance parameters between 0 and 20 d, higher nPP levels (>0.41%) were needed to maintain bone ash content and length. Pearson correlation analysis (Table 6) also demonstrated a highly positive correlation between dietary nPP level and most performance and bone parameters, while significant negative correlations were observed between dietary nPP level and feed conversion ratio and mortality rate during this period.
Grower period (21-36 d)
Table 3 - Effect of nPP levels and phytase supplementation on performance and bone characteristics of broiler chicks from 0 to 20 d fed corn-soybean meal based diet.
NPP (%) Phytase (F.T.U./kg)
BW, g (20 d)
DG, g
DFI, g
FCR, (g/g)
Plasma P level
Shank length (mm)
Tibia Femur
Length (mm)
Ash (%)
Length (mm)
Ash (%)
Mort. (%)
0.45 0 605a 28.5a 48.6a 1.71c 6.90a 54.5a 68.8a 36.5a 53.5a 38.2a 6.0b
0.40 632a 29.6a 50.1a 1.70c 5.79ab 53.6ab 67.1ab 36.6a 50.8b 34.0ab 7.1b
0.35 557b 26.1b 44.1b 1.69c 5.27b 52.3bc 66.1abc 33.8b 50.6b 31.58bc 6.0b
0.30 498c 23.2c 40.6bc 1.75c 4.68b 51.6bc 64.3bcd 29.3dc 47.9c 26.9dc 4.8b
0.25 415d 18.9d 41.1bc 2.18b 4.53b 51.8bc 63.2cde 30.1c 46.6c 25.8d 7.1b
0.20 312e 13.0e 37.3c 2.54a 4.51b 48.7d 61.0e 26.7d 43.9d 22.7d 25.0a
0.20 500 428d 19.2d 42.3b 2.21b 4.92b 50.6dc 62.7ed 28.6dc 45.8dc 26.1d 9.5b
P- value 0.0001 0.0001 0.0001 0.0001 0.0141 0.0004 0.0002 0.0001 0.0001 0.0001 0.0001
SEM 13.016 0.570 1.431 0.057 0.461 0.729 0.982 1.026 0.828 1.828 2.220
BW, body weight; DG, daily gain; DFI, daily feed intake; FCR, feed conversion ratio; Mor., mortality.
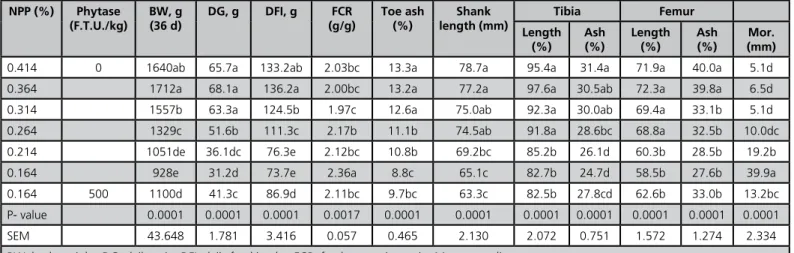
Table 4 - Effect of nPP levels and phytase supplementation on performance and bone characteristics of broiler chicks from 21 to 36 d
fed corn-soybean meal based diet.
NPP (%) Phytase (F.T.U./kg)
BW, g (36 d)
DG, g DFI, g FCR (g/g)
Toe ash (%)
Shank length (mm)
Tibia Femur
Length (%)
Ash (%)
Length (%)
Ash (%)
Mor. (mm)
0.414 0 1640ab 65.7a 133.2ab 2.03bc 13.3a 78.7a 95.4a 31.4a 71.9a 40.0a 5.1d
0.364 1712a 68.1a 136.2a 2.00bc 13.2a 77.2a 97.6a 30.5ab 72.3a 39.8a 6.5d
0.314 1557b 63.3a 124.5b 1.97c 12.6a 75.0ab 92.3a 30.0ab 69.4a 33.1b 5.1d
0.264 1329c 51.6b 111.3c 2.17b 11.1b 74.5ab 91.8a 28.6bc 68.8a 32.5b 10.0dc
0.214 1051de 36.1dc 76.3e 2.12bc 10.8b 69.2bc 85.2b 26.1d 60.3b 28.5b 19.2b
0.164 928e 31.2d 73.7e 2.36a 8.8c 65.1c 82.7b 24.7d 58.5b 27.6b 39.9a
0.164 500 1100d 41.3c 86.9d 2.11bc 9.7bc 63.3c 82.5b 27.8cd 62.6b 33.0b 13.2bc
P- value 0.0001 0.0001 0.0001 0.0017 0.0001 0.0001 0.0001 0.0001 0.0001 0.0001 0.0001
SEM 43.648 1.781 3.416 0.057 0.465 2.130 2.072 0.751 1.572 1.274 2.334
BW, body weight; DG, daily gain; DFI, daily feed intake; FCR, feed conversion ratio; Mor., mortality.
Table 5 - Effect of nPP levels and phytase supplementation on
performance and bone characteristics of broiler chicks from 0 to 36 d fed corn-soybean meal based diet.
NPP (%) Phytase
(F.T.U./kg) DG, g DFI, g (g/g)FCR Mor. (%) 0-20 d 21-36d
0.45 0.414 0 44.6ab 85.2a 1.91c 10.7d
0.40 0.364 46.1a 87.1a 1.89c 13.1d
0.35 0.314 42.2b 78.8b 1.87c 10.7d
0.30 0.264 35.5c 71.1c 2.01bc 14.3dc
0.25 0.214 26.1d 55.9d 2.14b 25.0b
0.20 0.164 19.5e 50.3e 2.56a 54.8a
0.20 0.164 500 28.3d 60.7d 2.15b 21.4bc
P- value 0.0001 0.0001 0.0001 0.0001
SEM 0.918 1.753 0.054 2.800
BW, body weight; DG, daily gain; DFI, daily feed intake; FCR, feed conversion ratio; Mor., mortality.
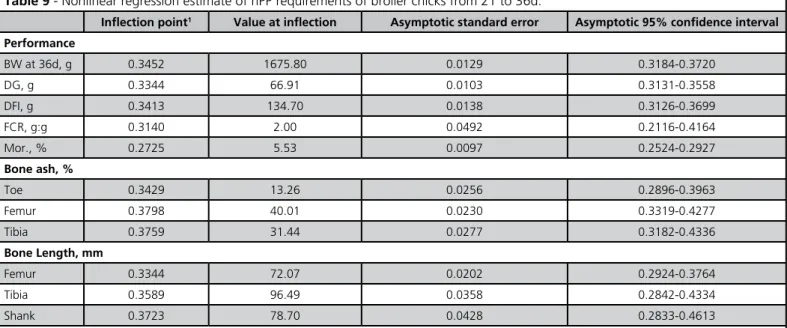
Whilst feeding a diet containing 0.314% of nPP was enough to sustain toe and tibia ash (%, Table 4), a higher nPP level was required to maintain femur ash content (0.364%) as compared to the control. Bone length data showed that less nPP was required to support the length of different leg segments (0.264% nPP) as compared to ash. Nonlinear regression estimates of the nPP requirement between 21 and 36d (Table 9) also showed that, as compared to 0 to 20d, less nPP was required to maintain BW, DG, DFI, and bone characteristics. However, the amount of nPP (%) required for optimal FCR and bird survival remained approximately at the same level during the 0 to 20 d growth period.
Table 6 - Correlation (Pearson) coefficients matrix between nPP level and performance & bone parameters.
Criteria 0 to 20 d 21 to 36 d p-value Coefficient p-value Coefficient
Performance
BW, g 0.9355 0.0001 0.9253 0.0001
DG, g 0.9355 0.0001 0.9262 0.0001
DFI, g 0.8183 0.0001 0.9202 0.0001
FCR, g.g-1 -0.8096 0.0001 -0.6398 0.0008
Mor. -0.5771 0.0003 -0.8066 0.0001
Bone ash, %
Toe - 0.8461 0.0001
Femur 0.8727 0.0001 0.9146 0.0001
Tibia 0.8789 0.0001 0.8794 0.0001
Bone length, mm
Femur 0.8883 0.0001 0.8621 0.0001
Tibia 0.8242 0.0001 0.7972 0.0001
Shank 0.7817 0.0001 0.7663 0.0001
Blood serum P 0.6750 0.0003
-BW, body weight; DG, daily gain; DFI, daily feed intake; FCR, feed conversion ratio; Mor, mortality.
Table 7 - Calculated phosphorus releasing ability (equivalency) of phytase using different performance and bone parameters as
assess-ment criterion.
Criteria 0 to 20 d 21 to 36 d
Linear Logarithmic Quadratic Average Linear Logarithmic Quadratic Average
Performance
BW 0.06 0.06 0.06 0.060 0.04 0.04 0.04 0.040
DG 0.06 0.06 0.05 0.057 0.05 0.05 0.05 0.050
DFI 0.10 0.09 0.10 0.097 0.05 0.04 0.04 0.040
FCR 0.04 0.04 0.04 0.040 0.12 0.12 0.09 0.110
Mor. 0.12 0.12 0.08 0.107 0.13 0.12 0.09 0.110
Bone ash, %
Toe - - - - 0.03 0.03 0.03 0.030
Femur 0.06 0.06 0.07 0.063 0.11 0.11 0.11 0.110
Tibia 0.04 0.04 0.04 0.040 0.05 0.05 0.04 0.047
Bone length, mm
Femur 0.04 0.04 0.04 0.040 0.05 0.06 0.06 0.057
Tibia 0.04 0.04 0.04 0.040 0.00 0.00 0.01 0.003
Shank 0.05 0.05 0.05 0.050 0.00 0.00 0.00 0.000
Blood serum P 0.09 0.08 0.11 0.093 - - -
-BW, body weight; DG, daily gain; DFI, daily feed intake; FCR, feed conversion ratio; Mor, mortality. Linear y=a+bx; logarithmic y=a+ ln(x), quadratic y=ax2+bx+c.
between dietary nPP level and most measured traits and a negative correlation between dietary nPP and FCR and mortality rate.
Dietary nPP levels had significant effects on DG, DFI, FCR and mortality rate (%) over the whole study
period (Table 5). Chicks fed diets containing 0.40 % nPP between 1 to 21d, and 0.364% nPP between 21 to 36d had the best (p<0.05) DG and DFI. Feeding diets containing lower levels of nPP (0.25 and 0.214% during 0 to 20d and 21 to 36d, respectively) was adequate to minimize total mortality rate and FCR.
The fact that reducing nPP levels during the starter period to 0.40% did not adversely affect broiler performance, but further reduction to less than 0.35 % did, indicates that the broiler’s requirement for phosphorus is lower than current recommendations. Data from literature on nPP requirements during the various growth periods is equivocal, with some papers suggesting lower nPP levels than those recommended by the NRC (1994) are required to constrain growth (Sohail & Roland, 1999; Waldroup, 1999) and others suggesting these levels are already deficient (NRC, 1994).
Similar results were reported by Sohail & Roland (1999), in which neither performance nor bone strength was significantly influenced as a result of nPP reduction from 0.425 to 0.325% nPP fed to 3-to-6 wk broiler chicks, further supporting lower nPP requirements for broilers than those currently suggested by the NRC (1994). The current results suggest that feeding 0.40% followed by 0.35 % nPP diets during starter and grower periods respectively results in sufficient retainable phosphorus to support optimal live weight and feed intake, with such levels actually being in excess of that required
for maintaining feed conversion ratio or mortality rate comparable to controls.
The higher sensitivity of the femur as compared to the shank and tibia to reduced nPP levels mirrors the degree of maturation of these bones at the ages investigated. It also suggests that the selection of specific bones as indicators of bone development should take into account the age of the bird at the time of sampling. It is clearly of interest to ensure that the bone selected is still growing and mineralising to maximise the likelihood of detecting differences between treatments.
Table 8 - Nonlinear regression estimate of nPP requirements of broiler chicks from 0 to 20d.
Inflection point1 Value at inflection Asymptotic standard error Asymptotic 95% confidence interval
Performance
BW at 20d, g 0.3806 619.0 0.0105 0.3587-0.4025
DG, g 0.3745 29.03 0.0093 0.3551-0.3939
DFI, g 0.4040 48.59 0.0345 0.3323-0.4757
FCR, g:g 0.3076 1.70 0.0084 0.2901-0.3251
Mor., % 0.2667 5.95 0.0206 0.2239-0.3095
Bone ash, %
Femur 0.4793 39.23 . .
Tibia 0.4102 36.47 0.0274 0.3532-0.4672
Bone length, mm
Femur 0.3879 52.14 0.0282 0.3297-0.4466
Tibia 0.4482 68.81 0.0450 0.3546-0.5418
Shank 0.4443 54.53 0.0511 0.3381-0.5506
Serum P level, 0.3208 4.70 0.0525 0.2112-0.4304
1 - Defined as the break point of dietary nPP concentrations as a function of the selected variables according to a nonlinear least squares analysis (Robbins, 1989; SAS Institute, 1991). BW, body weight; DG, daily gain; DFI, daily feed intake; FCR, feed conversion ratio; Mor, mortality.
Table 9 - Nonlinear regression estimate of nPP requirements of broiler chicks from 21 to 36d.
Inflection point1 Value at inflection Asymptotic standard error Asymptotic 95% confidence interval
Performance
BW at 36d, g 0.3452 1675.80 0.0129 0.3184-0.3720
DG, g 0.3344 66.91 0.0103 0.3131-0.3558
DFI, g 0.3413 134.70 0.0138 0.3126-0.3699
FCR, g:g 0.3140 2.00 0.0492 0.2116-0.4164
Mor., % 0.2725 5.53 0.0097 0.2524-0.2927
Bone ash, %
Toe 0.3429 13.26 0.0256 0.2896-0.3963
Femur 0.3798 40.01 0.0230 0.3319-0.4277
Tibia 0.3759 31.44 0.0277 0.3182-0.4336
Bone Length, mm
Femur 0.3344 72.07 0.0202 0.2924-0.3764
Tibia 0.3589 96.49 0.0358 0.2842-0.4334
Shank 0.3723 78.70 0.0428 0.2833-0.4613
Phytase effect
The results of the present experiment suggest that between 0 and 20 d, the addition of 500 F.T.U. of phytase to the nPP deficient diet (0.20 % nPP) significantly (p<0.05) improved BW, DG, DFI and FCR, and decreased mortality rate (Table 3). However, the effects on plasma P level, bone length, and ash content were not significant (p>0.05). The addition of 500 F.T.U. of phytase to the diet between 21 and 36 d significantly (p<0.05) improved BW, DG, DFI, FCR, mortality rate, tibia and femur ash weights, but the effects on toe ash (%), shank length, tibia and femur lengths, and ash percentage were not significant (p>0.05) as compared to the control treatment (Table 4). Over the whole experimental period the addition of phytase significantly (p<0.05) improved DG, DFI, FCR, and decreased morality rate (Table 5).
The P equivalency of the phytase (500 F.T.U./ kg) was estimated using linear, logarithmic, and quadratic equations linking dietary nPP level with each performance and bone parameters of interest. Estimates of phosphorus equivalency of the phytase treatment (Table 7) varied and were dependent on the performance or bone characteristic used as the criterion for assessment. For example, during the 0 to 20 d growth period, whilst the phosphorus equivalency of phytase ranged between 0.04 and 0.06 when BW, DG and FCR, respectively, were used as assessment criteria, it increased to approximately 0.10% when DFI or mortality rate were considered. Furthermore, P equivalency of phytase for some variables such as DFI, FCR, and femur ash changed with age (some reducing and some increasing with age); for the remaining variables these values remained relatively constant.
The beneficial effects of phytase on broiler chicks have been reported previously by many researchers. Sohail & Roland (1999) observed that when the nPP level of diets fed to broiler chicks between 4-6 wk of age were set at 3.30 g kg-1, there was little, if any,
positive effect of added phytase on performance. The response to phytase became significant at lower nPP levels (2.25 g kg-1). Low nPP diets typically result in
reduced gain and feed intake and sometimes there is a mildly adverse effect on FCR. Performance is often restored with the addition of phytase (Simons et al., 1990; Sohail & Roland, 1999; Yan et al., 2001; Punna & Roland, 2001; Ravindran et al., 2001; Lan et al., 2002; Viveros et al., 2002; Yan et al., 2003; Shirley & Edwards, 2003; Karimi, 2006), provided the initial deficiency was not too severe and the addition rates of phytase were adequate.
The multifaceted effects of phytase in practical diets are increasingly appreciated. It is possible that the observed performance response may reflect the release of P, available amino acids, and energy, alone or in combination. Generally, an improvement of 1.5 to 3.0 percentage points in performance was often observed in piglets and broilers when phytase was included in the diet, even when the diet met the digestible/available P requirement (Kies et al., 2001), suggesting significant extra-phosphoric effects of this enzyme. Nevertheless, the response of broilers to phytase is still not predictable, because there are many factors, including, concentration and source of phytin, protein quality, concentrations of divalent cations, vitamin D, mineral chelators in the diet, along with animal factors such as species, genetics and sex, and even diet processing, that may potentially affect the bird’s response to dietary phytase supplementation (Kies et al., 2001; Adeola & Sands, 2003). The findings of this experiment indicate that the scale of the positive effect of phytase for broilers varies and is very much dependent upon the age and assessment criterion employed. Caution is therefore needed when utilising a phytase product, and it must be taken into account that P equivalency of a phytase is not a constant that can be used in practical diet formulation.
In conclusion, the results of this experiment showed that feeding low nPP diets reduced bird performance and bone mineralization; however, the response to nPP level is not constant and depends on the measured trait and/or bird age. In addition, though supplementation of phytase is effective in offsetting at least some of the negative effects of lowering dietary nPP level, caution must be taken when setting rigid P equivalency values for a phytase product in practical diet formulation. Despite the numerous studies that have been undertaken to assess the effectiveness of phytase in broiler nutrition, more research is needed to determine more accurately P equivalency of phytase under different nutritional and management practices.
REFERENCES
Adeola O, Sands JS. Does supplemental dietary microbial phytase improve amino acid utilization? A perspective that it does not. Journal of Animal Science 2003; 81(E Suppl 2):E78- E85.
AOAC. Official methods of analysis. 15th ed. Arlington: Association of Official Analytical Chemists; 1990.
Correll D. Phosphorus: a rate limiting nutrient in surface waters. Poultry Science 1999; 78:674-682.
Karimi A. Responses of broiler chicks to non-phytate phosphorus levels and phytase supplementation. International Journal of Poultry Science 2006; 5:251-254.
Kies AK, Van Hemert KHF, Sauer WC. Effect of phytase on protein and amino acid digestibility and energy utilisation. World’s Poultry Science Journal 2001; 57:109-126.
Kilburn J, Edwards Jr HM. The response of broilers to the feeding of mash or pelleted diets containing maize of varying particle sizes. British Poultry Science 2001; 42:484-492.
Lan GQ, Abdullah N, Jalaludin S, Ho YW. Efficacy of supplementation of a phytase-producing bacterial culture on the performance and nutrient use of broiler chickens fed corn-soybean meal diets. Poultry Science 2002; 81:1522-1532.
NRC. Nutrient requirements of poultry. Nutrient requirements of domestic animals. 9th ed. Washington: National Academy Press; 1994.
Olukosi OA, Cowieson AJ, Adeola O. Age-related influence of a cocktail of xylanase, amylase, and protease or phytase individually or in combination in broilers. Poultry Science 2007; 86:77-86.
Olukosi OA, Cowieson AJ, Adeola O. Energy utilization and growth performance of broilers receiving diets supplemented with enzymes containing carbohydrase or phytase activity individually or in combination. British Journal of Nutrition 2008; 99:682-690.
Powell S, Johnston S, Gaston L, Southern LL. The effect of dietary phosphorus level and phytase supplementation on growth performance, bone-breaking strength, and litter phosphorus concentration in broilers. Poultry Science 2008; 87:949-957.
Punna S, Roland Sr DA. Influence of dietary phytase supplementation on incidence and severity in broilers divergently selected for tibial dyschondroplasia. Poultry Science 2001; 80:735-740.
Ravindran V, Selle PH, Ravindran G, Morel PCH, Kies AK, Bryden WL. Microbial phytase improves performance, apparent metabolizable energy, and ileal amino acid digestibility of broilers fed a lysine-deficient diet. Poultry Science 2001; 80:338-344.
Robbins KR, Norton HW, Baker DH. Estimation of nutrient requirements from growth data. Journal of Nutrition 1979; 109: 1710-1714.
Robbins KR. A method, SAS program, and example for fitting the broken-line to growth data. Greeneville: University of Tennessee Agricultural Experiment Station Research Report; 1986. p.89.
SAS Institute. SAS® User’s guide: statistics, Version 6.03 edn. Cary: SAS Institute; 1991.
Selle PH, Ravindran V, Bryden WL, Scott T. Influence of dietary phytate and exogenous phytase on amino acid digestibility in Poultry: A review. The Journal of Poultry Science 2006; 43:89-103.
Shirley RB, Edwards Jr HM. Graded levels of phytase past industry
standards improves broiler performance. Poultry Science 2003; 82: 671-680.
Simons PCM, Versteegh HAJ, Jongbloed AW, Kemme PA, Slump P, Bos KD, Wolters MGE, Beudeker RF, Verschoor GJ. Improvement of phosphorus availability by microbial phytase in broilers and pigs. British Journal of Nutrition 1990; 64:525-540.
Sohail SS, Roland Sr DA. Influence of supplemental phytase on performance of broilers four to six weeks of age. Poultry Science 1999; 78:550-555.
Summers JD. Precision phosphorus nutrition. The Journal of Applied Poultry Research 1997; 6:495-500.
Viveros A, Brenes A, Arija I, Centeno C. Effects of microbial phytase supplementation on mineral utilization and serum enzyme activities in broiler chicks fed different levels of phosphorus. Poultry Science 2002; 81:1172-1183.
Waldroup P. Nutritional approaches to reducing phosphorus excretion by poultry. Poultry Science 1999; 78:683-691.
Yan F, Kersey JH, Fritts CA, Waldroup PW. Phosphorus requirements of broiler chicks six to nine weeks of age as influenced by phytase supplementation. Poultry Science 2003; 82:294-300.
Yan F, Kersey J, Waldroup PW. Phosphorus requirements of broiler chicks three to six weeks of age as influenced by phytase supplementation. Poultry Science 2001; 80:455-459.