1
Abstract — Using real mechanical controls, this paper studied strength and reversibility of direction-of-motion stereotypes and response times for most common control-display configurations in human-machine interface. The effect of instruction of change (I) of display value and control plane (P) on movement compatibility for various control-display configurations were analyzed with precise quantitative measures of strength and reversibility index of stereotype. Comparisons on the mean stereotype strengths and indexes of reversibility among the rotary control-circular display, rotary control-digital counter, rotary control-horizontal scale, rotary control-vertical scale, four-way lever-circular display and four-way lever-digital counter combinations were examined and analyzed. The results showed that the best control-display configuration was the rotary control-circular display combination. The performance of the rotary control-digital counter, rotary control-horizontal scale and the four-way lever-circular display configurations were of comparable magnitude. The poorest configurations found in this study were the four-way lever-digital counter and the rotary control-vertical scale combinations. In general, subjects’ response times were found to be generally longer when there were no clear movement stereotypes. The results of this study provide significant implications for the industrial design of control panels used in human-machine interfaces for improved human performance.
Index Terms— movement compatibility, circular display, digital counter, linear scale, rotary control, lever control, stereotype reversibility
Manuscript received Apr 27, 2007. The work described in this paper was supported by the Direct Allocation Grant 7100004 from the City University of Hong Kong.
W.H. Chan is now with the Department of Business Services and Management, Hong Kong Institute of Vocational Education (Tsing Yi), 20 Tsing Yi Road, Hong Kong (e-mail: [email protected]).
Alan H.S. Chan is now with the Department of Manufacturing Engineering and Engineering Management, City University of Hong Kong, Kowloon Tong, Hong Kong (phone: (852) 27888439; fax: (852) 27888432; e-mail: [email protected]).
I. INTRODUCTION
Displays and controls provide the means of communication between people and machines in human-machine systems. Displays provide information about operational status, and control devices enable operators to take necessary actions and change the states of a human-machine system [1]. When people operate a control they have expectations about what it will do and what effect it will have on a display. The relationship between a control movement and the effect most expected by a population is known as a population stereotype or direction-of-motion stereotype, and such a relationship is said to be compatible. Although it is possible to train people to operate systems that do not follow the stereotypes, this will take a much longer training time and their performance may deteriorate when placed in an emergency situation. It was suggested that the trained behaviors do not replace the old behaviors which were learned as a result of past experiences and expectation - they merely overlay them. Certain situations may then arise in which the old behaviors may be stronger and habit regression [2] will occur when the operators’ motivation is decreased, or when they are fatigued and subjected to some changes in the working situation. Research on control and motion relationships has been ongoing for a long time. There have been studies on linear indicators with translatory controls [3], linear indicators with rotary controls [4-7], circular indicators with translatory controls [8], circular indicators with rotary controls [9-10], circular indicators with lever controls [11-12], digital counter with rotary control [13], and digital counter with lever control [14]. Nevertheless, no comprehensive research in comparing the movement compatibility among the common control-display configurations using real hardware tests has been reported.
To determine if any response preference or population stereotype exists, Chi-square tests are usually used to demonstrate statistical significance between proportions of different responses [8]. The majority proportion of responses (≥ 50%) for a testing condition is a measure of the strength of stereotype. A value of 50% indicates no choice preference while a value of 100% indicates a
Movement stereotypes for common
control-display configurations in
human-machine interface
W.H. Chan and Alan H.S. Chan
IAENG International Journal of Computer Science, 33:2, IJCS_33_2_8
______________________________________________________________________________________
perfect stereotype. Other than the strength of stereotype, reversibility of stereotypes is another important factor for consideration in industrial design for improved human performance. In the context of movement compatibility, reversibility is a term for describing the situation where, for example, a population that lifts a lever up to move a device up will also push it down to move the device down. Previous research on movement compatibility has shown that a person’s expectations are not always reversible. In a study of the operation of water taps, Hoffmann et al. [15] used a quantitative measure, Index of Reversibility (IR) ‘for measuring the likelihood that the response for closure of a tap is opposite to that used for opening the tap, independent of the expected direction of rotation of the tap for opening.’ In this water tap example, the IR was evaluated from the sum of two products. One product was derived from the proportion of anticlockwise responses for increasing the flow and the proportion of clockwise responses for decreasing the flow. The other product was derived from the proportions of the opposite pair of responses. The index ranges from a value of zero indicating absolute non-reversibility to a value of unity for perfect reversibility, which occurs when the response to 'increasing the flow' is opposite to the response to 'decreasing the flow'. Stereotypes are not always reversible and this is an important factor when considering movement compatibility. Designers of human-machine interfaces should use stereotypes with a reasonable degree of reversibility to reduce confusion and enhance efficiency and safety.
The present study aimed at examining the similarities and differences in response preferences among different combinations of some common controls and displays, viz. rotary control-circular display [10], rotary control-digital counter [13], four-way lever-circular display [12], four-way lever-digital counter [14], rotary control-vertical scale and rotary control-horizontal scale. Detailed comparisons of results in strength and reversibility of stereotype of all these configurations were critically examined.
II. METHODS
a. Experimental Design
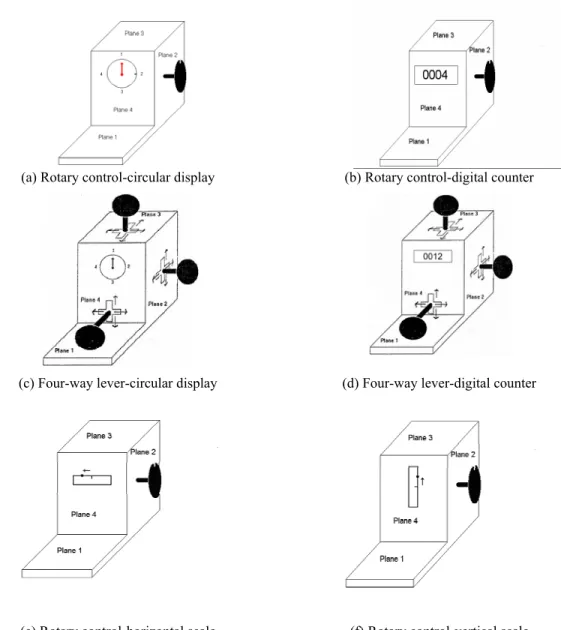
For better presentation of stimulus materials and immediate capturing of the dynamic performance of subjects, a personal computer with a Visual Basic application program was used for testing. Two types of controls (rotary control, four-way lever) and four types of displays (circular display, digital counter, horizontal scale, vertical scale) were tested in a total of six experiments. In each experiment, one type of control was combined
with a specific type of display for testing. The display was always shown directly in front of subjects in the frontal plane and the control might appear in one of the four planes (Fig.1 and Fig. 2). Subjects were requested to select their choices of manipulating the control movements to achieve the target setting immediately after the display was shown. The time between the showing of the instruction of change and subject’s moving the control was recorded as the response time. There were four control planes and two instructions of change of setting (clockwise or anti-clockwise for circular displays, left or right for horizontal scales, up or down for vertical scales, and increase or decrease in number in digital counters) for each experiment, which were randomly tested for all subjects who paced and initiated presentations themselves. The display always changed to the target setting independent of subjects’ choice of lever movement.
b. Subjects
Two groups of thirty-eight undergraduates of the City University of Hong Kong aged between 23 and 47 took part in the study. The first group took the tests on the rotary control-circular display, rotary control-digital counter, four-way lever-circular display, and four-way lever digital counter combinations. The second group took the tests on the rotary control-horizontal scale and rotary control-vertical scale combinations. The subjects were all right-handed and manipulated controls with their right hands. They were all Hong Kong Chinese.
III. RESULTS AND DISCUSSION
a. Response Preference and Mean Stereotype Strength
Table 1 shows a comparison of the major direction-of-motion stereotypes obtained at different planes for the control-display configurations tested in this study.
Table 1 A comparison of the major direction-of-movement stereotypes on different planes for all the control-display configurations tested in this study
Plane Control-Display Configuration 1 2 3 4
Rotary control-circular display CC, AA CC, AA CC, AA CC, AA
Rotary control-digital counter CI, AD CI, AD CI, AD CI, AD
Four-way lever-circular display RC, LA RC, LA RC, LA RC, LA
Four-way lever-digital counter FI, BD UI, DD FI, BD UI, DD
Rotary control-horizontal scale CR, AL CL, AR -- CR, AL
(a) Rotary control-circular display (b) Rotary control-digital counter
(c) Four-way lever-circular display (d) Four-way lever-digital counter
(e) Rotary control-horizontal scale (f) Rotary control-vertical scale
Fig. 1 Schematic diagrams showing all the control-display configurations tested in the study.
(a)
(b)
For the rotary control-circular display test [9], strong clockwise-clockwise (CC) and anticlockwise-anticlockwise (AA) relationships were found significant in all planes. It is worth noting that the lowest stereotype strengths were found in the sagittal plane (plane 2).
For the rotary control-digital counter test [13], strong clockwise-to-increase (CI) and strong anticlockwise-to-decrease (AD) stereotypes were found in all planes. The results suggested that the virtual movement directions in increasing and decreasing number magnitude coincide with the clockwise and anticlockwise movements of the rotary control, respectively.
For the four-way lever-circular display test [12], strong right-clockwise (RC) and left-anticlockwise (LA) stereotypes were found in all planes. With the four-way lever, the subjects seemed to ignore the rotary motion of the pointer at the 12 o’clock position and associated their linear lever responses with the translatory pointer movements in the left and right directions. Nevertheless, it is worth noting that the lowest stereotype strengths were also found in plane 2.
For the four-way lever-digital counter test [14], moderately strong forward-to-increase (FI) and backward-to-decrease (BD) stereotypes were found in the horizontal planes (planes 1 and 3). In the two vertical planes (planes 2 and 4), relatively weaker up-to-increase (UI) and down-to-decrease (DD) stereotypes were found dominant. The FI-BD stereotypes in the horizontal planes were generally stronger than the UI-DD stereotypes in the vertical planes, indicating that the horizontal planes are the desirable planes for positioning a forward-backward lever in working with the digital counter.
For the rotary control-horizontal scale test, there were strong clockwise-to-right (CR) and anticlockwise-to-left (AL) stereotypes found in all planes except the sagittal plane (plane 2). The results matched quite well with the findings obtained by Hotta and Yoshioka [7]. Nevertheless, different from the result obtained in [7] where no stereotype existed in plane 2, opposite stereotypes of clockwise-to-left (CL) and anticlockwise-to-right (AR) stereotypes were found in plane 2 instead. For the rotary control-vertical scale test, no stereotypes existed in all planes. Again, the result matched well with the findings obtained by Hotta and Yoshioka [7] where no significant stereotypes were reported in all planes.
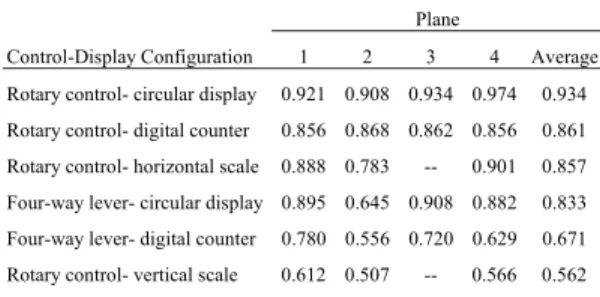
Table 2 shows a comparison of the mean stereotype strengths (SSs) obtained with all the control-display configurations tested in this study.
Using rotary control-digital counter [13] as an illustration, the mean stereotype strength (SS) for the rotary control-digital counter was calculated as the arithmetic mean of the clockwise-to-increase (CI) and anticlockwise-to-decrease (AD) stereotypes. The result (Table 2) showed that the strongest mean SS was found in the rotary control-circular display combination. The mean SSs of the rotary digital counter, rotary control-horizontal scale, and the four-way lever-circular display configurations were of comparable magnitude. The poorest configurations found in this study were the four-way lever-digital counter and the rotary control-vertical scale combinations. It is interesting to find that, except for the rotary control-digital counter combination, the poorest stereotype strengths were obtained in the sagittal plane (plane 2). The weaker strength for the controls positioned in the sagittal plane (plane 2) of the circular display configuration can be explained by the fact that as the controls were 90° offset from subjects’ line of sight and the frontal plane of the display, the associated mechanical pointer movement (left or right) in the circular display was also 90° offset from the control, which then inevitably led to degradation of the subject performance.
Table 2 A comparison of the mean stereotype strengths (SSs) on different planes for all the control-display configurations tested in this study
Plane Control-Display Configuration 1 2 3 4 Average
Rotary control- circular display 0.921 0.908 0.934 0.974 0.934 Rotary control- digital counter 0.856 0.868 0.862 0.856 0.861 Rotary control- horizontal scale 0.888 0.783 -- 0.901 0.857 Four-way lever- circular display 0.895 0.645 0.908 0.882 0.833 Four-way lever- digital counter 0.780 0.556 0.720 0.629 0.671 Rotary control- vertical scale 0.612 0.507 -- 0.566 0.562
b. Reversibility
IR = p(CI) x p(AD) + p(CD) x p(AI)
Significant CI and AD stereotypes were found in all planes, and the strongest ones were found in plane 2 for CI and planes 2 and 3 for AD. The mean IRs were at high levels of 0.752, 0.771, 0.762 and 0.752 in planes 1, 2, 3, and 4, respectively. The overall average IR for the rotary control-digital counter configuration was at a high level of 0.759.
Using the similar methodology, the indexes of reversibility (IRs) for all the other configurations were calculated. Table 3 shows a comparison of the indexes of reversibility (IRs) obtained with all the control-display configurations performed in this study. The results showed that the strongest IR was found for the rotary control-circular display combination. The IRs of the rotary control-digital counter, rotary control-horizontal scale, and four-way lever-circular display configurations were of comparable magnitudes. Again, the poorest configurations found in this study were the four-way lever-digital counter and the rotary control-vertical scale combinations.
Table 3 A comparison of the indexes of reversibility (IRs) on different planes for all the control-display configurations tested in this study
Plane Control-Display configuration 1 2 3 4 Average
Rotary control-circular display 0.855 0.832 0.877 0.949 0.878 Rotary control-digital counter 0.752 0.771 0.762 0.752 0.759 Rotary control-horizontal scale 0.802 0.635 -- 0.812 0.750 Four-way lever-circular
display 0.800 0.411 0.824 0.777 0.703 Four-way lever- digital counter 0.622 0.316 0.543 0.400 0.470 Rotary control- vertical scale 0.524 0.483 -- 0.492 0.500
c. Response Time
For the experiment performed on rotary control-digital counter configuration, the average response times captured by the software program ranged from 560 to 686 ms with a mean of 615 ms and a standard deviation of 32 ms. Student’s t-test showed that the average response times for the increase and decrease instructions were statistically the same (p > 0.05). The regression analysis for the preferred response percentage (p) for instructions of change of number showed that the higher the preferred response percentage, the shorter the mean response time (Fig. 3) and the expression relating response time and preferred response performance is:
Response time (ms) = 1306 – 8.04 *p (r2 = 0.537, n = 32, p < 0.001)
As predicted from the equation, the mean response time ranges from 502 ms (p = 100%) to 904ms (p = 50%). The regression equation clearly shows that a substantial reduction of response time could be achieved if there is a high level of compatibility built between the rotary control and digital counter.
Average Response Time vs % Response Preference
y = 1306- 8.04x
400 500 600 700 800
75 80 85 90 95
% Response Preference Response
Time (ms)
Fig. 3 Average response time vs. % response preference.
Table 4 shows a summary of the mean response times (RTs), the slopes (b1) and the y intercepts (b0) of the regression equations obtained in all the experiments conducted in this study. Due to the different electro-mechanical design features for the various controls employed in each experiment, no direct comparison among the magnitudes of the response times obtained in all the experiments can be made. Nevertheless, the result showed that, with negative slope (b1) values found in the regression equations for all experiments, faster response time could be achieved if there is a high level of compatibility built between the control and display.
Table 4 A summary of the response times for all the control-display configurations tested in this study
Control-Display Configuration
Y Intercept (b0)
Slope (b1) r 2
Mean RT (ms)
Rotary control-vertical scale 962 -4.24 0.515 740
Rotary control-horizontal scale 953 -3.90 0.540 616
Rotary control-digital counter 1306 -8.04 0.521 615
Rotary control-circular display 996 -4.18 0.313 653
Four-way lever-digital counter 1087 -5.85 0.642 694 Four-way lever-circular
display 1108 -5.42 0.491 658
IV. CONCLUSION
combination was the best configurations reported. The performance of the rotary control-digital counter, rotary control-horizontal scale, and the four-way lever–circular display configurations were of comparable magnitudes. The poorest configurations found in this study were the four-way lever-digital counter and the rotary control-vertical scale combinations. The negative correlation coefficients obtained for the average response time and the average proportion of majority response showed that subjects in general needed to do less mental work in compatible settings where dominant preferences of movement directions were evidenced.
The results of this study led to the following recommendations that are useful for designing control panel interfaces, and for predicting the effects of design compatibility on human response times and response preferences.
a) Rotary control-circular display combination is the best among all the configurations discussed in this study. In cases where rotary controls or lever controls are to be adopted, circular displays rather than digital counters should be chosen for use.
b) The sagittal plane is the least advantageous one for all the control-display configurations reported in this study except for the rotary control-digital counter combination.
c) Translatory levers are not as good as rotational controls for working with the digital counter. If digital counters are to be adopted, rotary controls instead of lever controls should be chosen for use.
d) If a lever needs to be used with a digital counter, the forward-backward type can be positioned on the horizontal planes and the up-down type can be positioned on the frontal vertical planes.
e) If a linear scale needs to be used with a rotary control, the horizontal scale should be preferred over the vertical scale.
f) In general, response times are longer when there are no clear movement stereotypes.
REFERENCES
[1] H.Y. Kang and P.H. Seong, “Information Theoretic Approach to Man–Machine Interface Complexity Evaluation”, IEEE Transactions on Systems, Man, and Cybernetics, vol. 31, no. 3, pp. 163-171, 2001.
[2] N.E. Loveless, “Direction-of-motion stereotypes: A Review”. Ergonomics, vol. 5, pp. 357-383, 1962.
[3] S. Ross, B.E. Shepp, and T.G. Andrews, “Response preferences in display-control relationships”. Journal of Applied Psychology, vol. 39, pp. 425-428, 1955.
[4] A.J. Courtney, “The effect of scale-side, indicator type, and control plane on direction-of-turn stereotypes for Hong Kong Chinese subjects”. Ergonomics, vol. 37, pp. 865-877, 1994.
[5] H. Petropoulos and J. Brebner, “Stereotypes for direction-of-movement of rotary controls associated with linear displays: the effects of scale presence and position, of pointer direction, and distances between the control and the display”. Ergonomics, vol. 24, pp.143-151, 1981. [6] A. Hotta, T. Takahashi, K. Takahashi, and K. Kogi,
“Relations Between Direction-of-motion Stereotypes for Indicator Controls”. Journal of Human Ergology, vol. 8, pp. 47-58, 1979.
[7] A. Hotta., M. Yoshioka, “Experiment on Direction-of-Motion Stereotypes for Indicator or Figure Control”.
Ergonomics International 88: Proceedings of the Tenth Congress of the International Ergonomics Association,
154-156, Sydney, Australia, 1-5 August 1988, Edited by
A.S. Adams, R.R. Hall, B.J. McPhee and M.S. Oxenburgh. Taylor & Francis, London.
[8] A.H.S. Chan, A.J. Courtney, and K.W.Y. So, “Circular displays with thumbwheels: Hong Kong Chinese Preferences”. International Journal of Human Factors and Ergonomics in Manufacturing, vol. 10, no. 4, pp. 453-463, 2000.
[9] W.H. Chan and A.H.S. Chan, “Movement compatibility for rotary control and circular display- Computer Simulated Test and real Hardware Test”. Applied Ergonomics, vol. 34, pp. 61-67, 2003.
[10] A.H.S. Chan and W.H. Chan, “Movement compatibility for circular display and rotary controls positioned at peculiar positions”, International Journal of Industrial Ergonomics, vol. 36, pp. 737-745, 2006.
[11] W.H. Chan and A.H.S. Chan, “A study on Movement compatibility for Lever Control and Circular Display with Computer Simulated Test”. Proceedings of the International Multi-Conference of Engineers and
Computer Scientists (IMECS) 20- 22June, 2006, pp.
625-629.
[12] W.H. Chan and A.H.S. Chan, “Strength and reversibility of movement stereotypes for lever control and circular display”, International Journal of Industrial Ergonomics,
vol. 37, pp. 233-244, 2007.
[13] W.H. Chan and A.H.S. Chan, “Hardware Test on Movement compatibility for Rotary Control and Digital Display”, Proceedings of the International Multi-Conference of Engineers and Computer Scientists
(IMECS)2006, pp. 721-725, 20-22 June 2006.
[14] W.H. Chan and A.H.S. Chan, “Movement compatibility for lever control with digital counter in man machine interface”, submitted for publication in IEEE Transactions on Systems, Man, and Cybernetics, Part A. [15] E. Hoffman, C. Brown, and S. Morgan, “Stereotypes for