PSIHOLOGIJA, 2010, Vol. 43 (1), 159.938.2.072 © 2010 by the Serbian Psychological Association DOI: 10.2298/PSI1001005C
Attentional Networks and Biological Motion
Chandramouli Chandrasekaran
Department of Psychology & Neuroscience Institute, Princeton University, USA Max Planck Institute for Biological Cybernetics, Tübingen, Germany
Lucy Turner
Department of Psychology, Swansea University, Swansea, UK
Heinrich H. Bülthoff
Max Planck Institute for Biological Cybernetics, Tübingen, Germany Department of Brain and Cognitive Engineering, Korea University, Seoul, Korea
Ian M. Thornton
Department of Psychology, Swansea University, Swansea, UK Max Planck Institute for Biological Cybernetics, Tübingen, Germany
Our ability to see meaningful actions when presented with point-light traces of human movement is commonly referred to as the perception of biological motion. While traditional explanations have emphasized the spontaneous and automatic nature of this ability, more recent findings suggest that attention may play a larger role than is typically assumed. In two studies we show that the speed and accuracy of responding to point-light stimuli is highly correlated with the ability to control selective attention. In our first experiment we measured thresholds for determining the walking direction of a masked point-light figure, and performance on a range of attention-related tasks in the same set of observers. Mask-density thresholds for the direction discrimination task varied quite considerably from observer to observer and this variation was highly correlated with performance on both Stroop and flanker interference tasks. Other components of attention, such as orienting, alerting and visual search efficiency, showed no such relationship. In a second experiment, we examined the relationship between the ability to determine the orientation of unmasked point-light actions and Stroop interference, again finding a strong correlation. Our results are consistent with previous research suggesting that biological motion processing may requite attention, and specifically implicate networks of attention related to executive control and selection.
Keywords: Biological motion, attention, point-light walkers, Stroop, flanker interference, correlation
Correspondence and reprint requests should be addressed to: Ian M. Thornton, Department of Psychology, Swansea University Singleton Park, Swansea, SA2 8PP
It is now nearly forty years since Gunnar Johansson first used point-light
stimuli as an experimental probe into human vision (Johansson, 1973). Since
that time, a great deal has been learnt about the perception of dynamic objects
and events using this technique, in which the body is represented by a small
set of moving points attached to the major joints. It is clear, for example, that a
very wide range of information can be extracted from these displays, both about
the action (e.g., Dittrich, 1993; Giese, Thornton, & Edelman, 2008; Hemeren,
1996; Runeson & Frykholm, 1981) and the actor(s) involved (e.g., Jacobs, Pinto,
Shiffrar, 2004; Jokisch, Daum, & Troje, 2006; Knoblich & Prinz, 2001; Pollick et
al, 2005). Much has also been learnt about the range of mechanisms humans use
to process such stimuli (e.g., Bertenthal & Pinto, 1994; Giese & Poggio, 2003;
Hunt & Halper, 2008; Lange, Georg & Lappe, 2006; Mather, Radford & West,
1992; Thornton & Vuong, 2004; Thornton, Rensink & Shiffrar, 2002), and about
the brain networks that underlie such processes (e.g., Allison, Puce & McCarthy,
2000; Downing et al., 2001; Grossman et al., 2000; Grossman & Blake, 2002;
Kontaris, Wiggett, & Downing, 2009; Pinsk et al., 2009; Puce & Perrett, 2003;
Saygin et al., 2004; Schwarzlose, Baker, & Kanwisher, 2005). Blake & Shiffrar
(2007) provide an excellent, introductory review to most aspects of biological
motion processing.
The goal of the current paper is to examine how biological motion relates
to another, even more well-studied phenomenon, visual attention. Neisser (1976)
described attention as “psychology’s most elusive target”. This reflects the fact
that while “Everyone knows what attention is...” (James, 1890), operationally
defining it, and empirically studying it are often a little more difficult. Here, we
will follow Raymond (2000) in defining attention simply as those processes that
help to separate task relevant information from task irrelevant information.
Of interest in the current context is evidence that such processes appear
to be organised into several functionally and anatomically distinct
networks of
attention
(e.g., Corbetta & Shulman, 2002; Fan, McCandliss, Sommer, Raz,
& Posner, 2002; Marrocco & Davidson, 1998; Pardo, Fox, & Raichle, 1991;
Posner & Peterson, 1990). Fan et al., (2002) developed the attentional network
test (ANT), a battery of behavioural tests specifically designed to measure the
efficiency of three specific networks. These networks control i) the orienting of
attention (involving the posterior parietal lobe, the superior colliculus, and the
pulvinar), ii) the establishment and maintenance of vigilance (right frontal and
parietal lobes) and c) the top-down or executive control of selection, detection
and conflict resolution (anterior cingulate gyrus and lateral prefrontal cortex). In
the current paper, we use the ANT, together with two other well-known tasks –
visual search (e.g., Wolfe, 1998) and the Stroop task (Stroop, 1935) – to explore
the relationship between these networks of attention and biological motion.
1973; 1975). Both computational (e.g., Giese & Poggio, 2003) and empirical
(e.g., Mather, Radford & West, 1992; Thornton & Vuong, 2004) studies
have provided support for the notion that a global, biological percept can be
derived in a completely bottom-up, attention-free manner. In contrast, however,
several studies have also focused on how top-down mechanisms contribute to
the processing of biological motion (e.g., Bertenthal & Pinto, 1994; Bülthoff,
Bülthoff, & Sinha, 1998; Thornton, Pinto, & Shiffrar, 1998). More specifically,
several studies have provided direct evidence that attention might be required to
process or interpret point-light displays (Battelli, Cavanagh & Thornton, 2003;
Cavanagh, LaBianca, & Thornton, 2001; Thornton, Rensink, & Shiffrar, 2002).
If attention is involved in the processing or interpretation of point-light
stimuli, then we might expect to find a measurable relationship between the
efficiency with which an individual controls attention, and their ability to process
biological motion. Finding such a correlation would not, of course, tell us about
the role attention might be playing. However, if the observed relationship is
restricted to one or more of the previously mentioned networks of attention, then
this may help to inform future studies aimed at more directly testing the nature
of that role.
In the two experiments reported here, we found that performance varied
quite considerably from observer to observer when performing biological motion
tasks. This was true both when performance was measured in terms of resistance
to visual clutter (Exp 1) and in terms of simple responses to unmasked upright
and inverted actions (Exp 2). Importantly, this variation was highly correlated
with one specific aspect of visual attention, namely the ability to selectively
attend. Observers, who were better at selectively attending, were faster and more
accurate at processing point-light displays.
EXPERIMENT 1
In Experiment 1 we measured individual thresholds for accurately
determining the direction in which a masked point-light walker was facing.
Thresholds were established by adaptively increasing and decreasing the
number of masking elements in the display, so that a stable level of 71% correct
was achieved. In the same individuals, we then measured the efficiency with
which a range of attention-specific tasks were performed. Finally, we looked
for correlations between biological motion processing and these networks of
attention.
Method
Apparatus. Stimuli were presented on a 21 inch (37 cm x 28 cm) monitor with a refresh rate of 75 Hz and a resolution of 1152 x 870 pixels. Observers sat approximately 60 cm from the monitor in a dimly lit room. Responses were collected via a standard keyboard.
Biological Motion Task. The task for observers was to report the left/right orientation of a walking figure that was presented in sagittal view at a random location within a central 9.3° x 9.3° visual angle viewing area. Each walking figure consisted of 11 dots (head, near shoulder, both elbows, both wrists, near hip, both knees, and both ankles) drawn in black on a gray background, each dot subtending 0.17°. The figures subtended 3° in height (head to ankle) and 1°in width (at the most extended point of the step cycle) and were animated using James Cutting’s synthetic walker algorithm (Cutting, 1978). A complete stride cycle was achieved in 40 animation frames with a frame duration of 40 ms simulating a natural walking speed of 38 strides per minute (Inman, Ralston & Todd, 1981). The walking figure did not translate, but moved in place, as if on a treadmill. The starting position within the step-cycle was randomly chosen on each trial.
Masking stimuli were created by randomly positioning the individual dots of a walking figure within the central viewing area. Such “scrambled walker” masks are very effective as they mimic the local behaviour of the target, without conveying global structure (e.g., Bertenthal & Pinto, 1994; Cutting, Moore & Morrison, 1988; Thornton et al, 1998). We note that as there was no global translation of either target or mask elements, and as limb pairs have pendulum-like, periodic motions, 180° out of phase, there is very little local information that would favour a directional right or left response. For example, an isolated elbow or knee dot moving from left to right, could equally have originated from a left or right facing walker. The only local cues to direction come from trajectory asymmetries, for example at the end points of ankle and wrist dot movements. To minimize the effects of these cues, 50% of all mask elements were generated from left-facing walkers, and 50% from right facing walkers. In general then, direction is almost exclusively conveyed by the global structure of the target figure, not by the local elements, either of the target or the mask.
During an initial training phase, the walker appeared unmasked for 100 trials. To assess individual mask thresholds, two interleaved staircases were presented in which the number of scrambled walker dots were either increased or decreased from starting levels of 110 (5 left and 5 right walkers) and 550 (25 left and 25 right walkers) dots respectively. For either staircase, two correct responses resulted in the addition of 22 dots (1 left and 1 right scrambled walker) to the mask. A single incorrect response resulted in the removal of 22 dots. A reversal occurred whenever the direction of this mask alteration changed, from addition to subtraction or vice versa. A staircase terminated after 30 such reversals. Thresholds were estimated by averaging across the last eight reversal points and collapsing across the two interleaved staircases. This standard 2 up/1 down procedure provides an estimate of the mask level at 71 per cent correct. The entire task took approximately 30 minutes.
a 16° x 16° viewing square. The main dependent measure of interest was search efficiency, indexed by the increase in target present response time as a function of set size.
Stroop Task.The Stroop (1935) colour naming task provides a simple but highly effective measure of selective attention. Observers are asked to read aloud the ink colour of each item in a list of words or neutral strings of letters (e.g., XXXXX). Even though observers are told to ignore the meaning of the items, when they consist of incongruent colour terms (e.g., the word red presented in blue ink) reaction times are dramatically slowed. The magnitude of this slowing provides an index of how well observers can selectively attend. Here we presented four lists of twelve items and manually recorded the total time taken to read down each list. The words were presented at the centre of the computer screen in a 12° x 3° column. The first two lists consisted of neutral words (e.g., Cat, Star, Poster, Watch) which could be drawn in red, blue, green or yellow. These lists were used as a training phase. A list of neutral items and a list of incongruent colour terms were then presented with the order counterbalanced across observers. The dependent measure was the reaction time difference between the neutral and incongruent lists. Reaction time was recorded via a manually-operated software timing routine under the control of the experimenter.
Attentional Network Test.The Attentional Network Test (ANT) was developed by Michael Posner and colleagues (Fan, McCandliss, Sommer, Raz, & Posner, 2002) to provide a fast and efficient attentional assessment technique appropriate for use with children, animals, patient populations and in the context of brain imaging. The name derives from the observation, discussed above, that components of attention, such as alerting, orienting (e.g., selection of information) and executive control (e.g., conflict resolution), appear to be subserved by networks of different brain areas (Posner & Peterson, 1990).
To provide an assessment of these three functional networks in a single, short (approx. 30 min) task, the ANT combines a Posner cueing paradigm (Posner, 1980) with an Eriksen flanker task (Eriksen & Eriksen, 1974). Observers are asked to make a speeded response to left/right orientation of a central arrow that can appear above or below fixation. In some trials the target is preceded by a spatially uninformative (altering) or informative (orienting) cue and can appear alone or in the presence of congruent or incongruent flanking arrows (congruency). The task is run in a single session, with trial types fully intermixed. Appropriate reaction time subtractions are used to derive separate assessments of alerting, orienting and executive control. These subtractions are described in the results section.
Procedure.Each task was run as a separate mini-experiment, with written instructions, verbal explanation and relevant training proceeding each period of data collection. Short breaks were provided between each task. The Biological Motion task was always run first, with the order of the remaining tasks counterbalanced across observers. The entire data collection period was approximately two hours.
Results
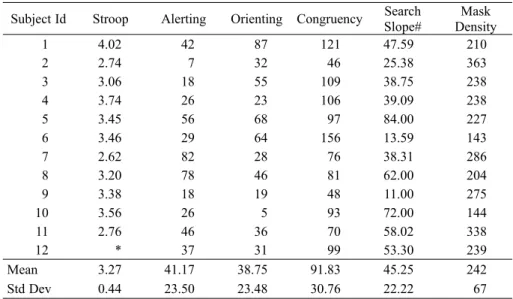
Table 1. Summary of all tasks from Experiment 1. Stroop interference is expressed in Seconds and Mask Density is in terms of total dots. All other measures are Milliseconds.
Subject Id Stroop Alerting Orienting Congruency Search Slope#
Mask Density
1 4.02 42 87 121 47.59 210
2 2.74 7 32 46 25.38 363
3 3.06 18 55 109 38.75 238
4 3.74 26 23 106 39.09 238
5 3.45 56 68 97 84.00 227
6 3.46 29 64 156 13.59 143
7 2.62 82 28 76 38.31 286
8 3.20 78 46 81 62.00 204
9 3.38 18 19 48 11.00 275
10 3.56 26 5 93 72.00 144
11 2.76 46 36 70 58.02 338
12 * 37 31 99 53.30 239
Mean 3.27 41.17 38.75 91.83 45.25 242
Std Dev 0.44 23.50 23.48 30.76 22.22 67
# Refers to Target Present trials
* Data from one subject is missing for the Stroop task due to technical problems.
Visual Search Task.
As expected, search was slow and serial, with reaction time
increasing linearly for both target present and target absent trials. To obtain
individual measures of search efficiency, linear regression lines were fitted to the
search data of each observer. These estimates indicated average target present
slopes of 44 ms/item (see Table 1) and target absent slopes of 76 ms/item.
Stroop Task.
Data from one observer was lost due to a technical error. For the
remaining 11 observers there was a strong and consistent cost associated with
the ink colour/colour label conflict. Specifically, reading times for the colour
terms (M = 10 secs) were some three seconds longer than for the neutral letter
strings (M = 7 secs), t(10) = 24.6, p <.001. These conflict scores are summarised
in Table 1.
Finally congruency (executive control) was computed by subtracting congruent
(M = 591 ms) from incongruent (M = 683 ms) trials, having collapsed across
all cue types. There was a strong (M = 92 ms) effect of congruency which was
again highly reliable, t(11) = 11.717, p<.001. In general, the raw reaction times
and attentional estimates from the ANT were very similar to those previously
reported by Fan et al., (2002).
Table 2. Mean reaction times (ms) for various cue types and congruency conditions from the Attention network test. Standard deviations are shown in parentheses.
Congruency Cue Type
No Cue Double Cue Center Spatial
Congruent 628 (100) 592 (101) 593 (95) 549 (88) Incongruent 700 (125) 677 (113) 700 (111) 654 (111) Neutral 595 (99) 538 (101) 543 (97) 510 (76)
Mean 641 (108) 602 (105) 612 (101) 570 (92)
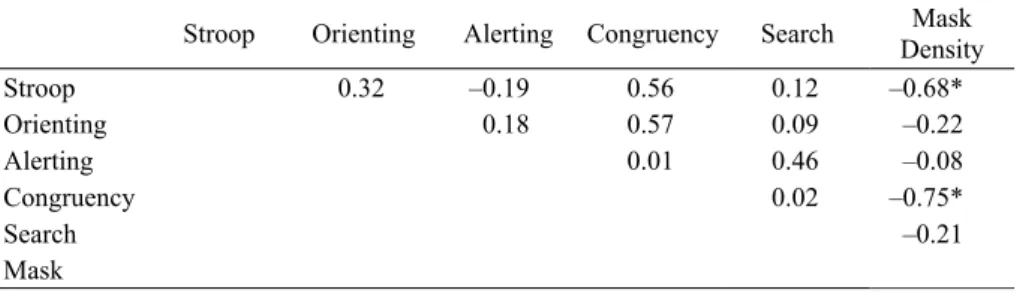
Correlation Analysis
. To explore the relationship between the biological motion
task and the various measures of attention, we constructed the correlation matrix
shown in Table 3. Of primary interest is the final column that directly compares
biological motion to the various attentional measures. There were only two
factors that were significantly correlated with biological motion. Performance
on the Stroop task was negatively correlated (r = –0.679, p <0.05), such that
observers who performed well on the biological motion task were also less
affected by colour conflicts in the Stroop task. Similarly observers who did well
on the biological motion task were less affected by flanker congruency in the
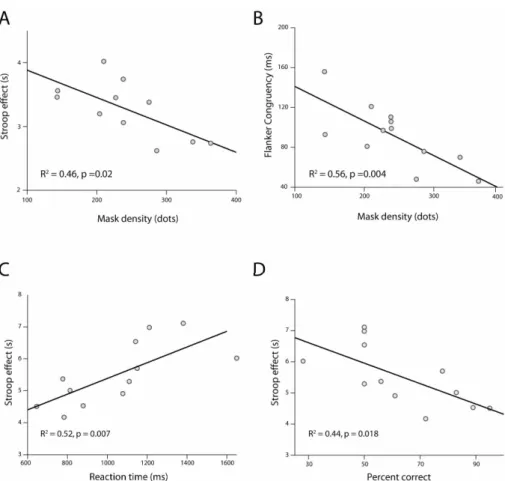
ANT, (r = –0.753, p <0.01). Scatter plots for these two effects are shown in
Figures 1A and B.
Table 3. Correlation matrix from Experiment 1. Mask Density, the column of most interest, has been shaded.
Stroop Orienting Alerting Congruency Search Mask Density
Stroop 0.32 –0.19 0.56 0.12 –0.68*
Orienting 0.18 0.57 0.09 –0.22
Alerting 0.01 0.46 –0.08
Congruency 0.02 –0.75*
Search –0.21
Mask
* Statistically Significant (p<.05)
effect as independent parameters accounts for a larger percentage of variance
(66.3%) compared to separate analysis of these factors (46% and 56.5% of
the variance for the Stroop and congruency effects respectively). As the cross
correlations that exclude biological motion are not the primary focus of this
paper, we will not discuss them in detail here. However, we note that none of
these cross-correlations reached significance, although the relationship between
orienting and congruency was marginal (r = 0.57, p = 0.06).
Figure 1: Upper panel shows the relationship between mask density and (A) Stroop, (B) flanker interference in Experiment 1. Lower panel shows the relationship between Stroop interference and (C) median reaction time, (D) accuracy for unmasked orientation
judgements in Experiment 2.
Discussion
withstand greater levels of scrambled-walker noise and still achieve 71% correct
performance. Other components of attention, such as orienting, alerting and
shifting of attention during search, were not correlated with biological motion.
The involvement of selective attention is consistent with previous studies that
have suggested certain aspects of biological motion processing may be slow,
active and effortful (e.g., Cavanagh, LaBianca, & Thornton, 2001; Thornton,
Rensink, & Shiffrar, 2002), rather than spontaneous and automatic, as has been
traditionally claimed (Johansson, 1973).
Given the nature of the current walker task – finding a target in a mask
and holding on to the dynamic pattern long enough to determine direction – it is
perhaps not surprising that performance is correlated with an ability to selectively
attend and to ignore irrelevant items. Of course, a task analysis might also have
predicted that visual search would also be highly correlated, which was not the
case. Similarly, the ability to orient attention or individual differences in arousal
changes in response to a biologically salient target could have emerged. Again,
there was no evidence that this was the case.
Nevertheless, it seems important to determine whether the current findings
depend on the use of concurrent masking. That is, does the observed relationship
reflect something about segmenting the target from a dynamic background of
noise, or does it relate more generally to the demands of processing biological
motion? The next experiment was designed to address this question.
EXPERIMENT 2
In Experiment 2, we presented observers with unmasked point-light figures
performing a variety of complex, familiar actions. The task was simply to make
a speeded judgement on the orientation of the display (Pavlova & Sokolov, 2000;
Sumi, 1984). That is, on each trial, observers were asked to decide if the figure
was upside-down or upright. On 50% of trials, the figures were presented in a
normal orientation, on the remaining 50% of trials they were presented inverted,
that is, rotated 180° in the picture plane. We measured selective attention via
the same Stroop task used in Experiment 1. Our question was whether a similar
correlation between the two types of tasks would still be present even when the
figure did not need to be extracted from a mask.
Method
Participants. Twelve students from Swansea University took part in this experiment in exchange for partial course credit. All observers reported normal or corrected to normal vision and were naive with regard to the purpose of the study.
monitor in a dimly lit room. Responses were collected via a standard keyboard. A hand-held, electronic stopwatch was used to collect reaction times for the Stroop task.
Biological Motion Task.The point-light stimuli were obtained from the database of motion-captured actions described in detail in Vanrie & Verfaillie (2004). Eighteen different point-light actions were used, namely: Chop, Crawl, Cycle, Drink, Drive, Jump, Paddle, Paint, Play pool, Play tennis, Pump, Row, Saw, Spade, Stir, Sweep, Walk, and Wave. Each upright movie was duplicated and rotated 180° to give a total of 36 target actions. The figures were draw as 13 white dots on a black background presented in the centre of the screen. Each dot subtended approximately 0.25° visual angle and each figure approximately 14° in height, with width varying as function of action, between 3° and 5° at the widest extent of the limbs. All figures were oriented 45° away from the observer – right when upright, left when inverted – to increase the visibility of limb movement during the action. As many of the actions were non-symmetrical, the difference in left/right orientation would not be a reliable cue to picture plane orientation, particularly as the starting frame of each movie was randomized. Individual actions ranged in duration from 0.6 to 3.4 seconds. However, the video files were looped and remained visible until the observer responded. Custom written MATLAB code was used to load the movies, control playback and collect responses.
Stroop Task. The stimuli and design of this task were identical to that described in Experiment 1, except a handheld stopwatch was used to record reaction times.
Procedure. As in Experiment 1, the biological motion task was always run first. Written instructions were provided and the task explained by the experimenter. Each trial was initiated by the participant and they were instructed to make speeded response to the orientation of the figures, by pressing two designated keys. Three practice actions were randomly selected, to familiarize the observers with the nature of the stimuli, but no specific training on biological motion was provided. Each participant completed 36 trials in a separately randomized order. On average the experiment took around 15 minutes to complete.
Once the biological task had been completed the Stroop task was performed. This began with verbal instructions and the presentation of a practice list, which contained colour-neutral words. When the participant was familiarized with the task two further lists were read aloud and the total reading time recorded by the experimenter. The order of the second two lists – incongruent and neutral – were counterbalanced across participants. This section of the experiment took a further 5 minutes.k
Results
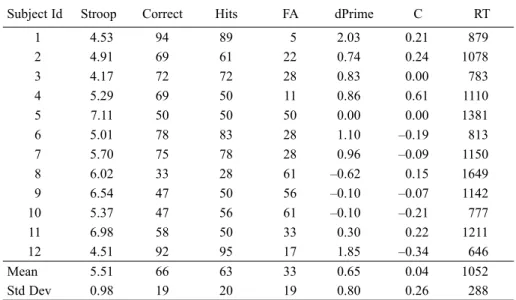
Table 4. Summary of all tasks from Experiment 2. Stroop interference is expressed in Seconds, RT in Milliseconds and all other measures as relevant percentages. Signal detection
analysis was coded with reference to “upright” responses, taking into account the 2AFC nature of the task (Macmillan & Creelman, 2005)
Subject Id Stroop Correct Hits FA dPrime C RT
1 4.53 94 89 5 2.03 0.21 879
2 4.91 69 61 22 0.74 0.24 1078
3 4.17 72 72 28 0.83 0.00 783
4 5.29 69 50 11 0.86 0.61 1110
5 7.11 50 50 50 0.00 0.00 1381
6 5.01 78 83 28 1.10 –0.19 813
7 5.70 75 78 28 0.96 –0.09 1150
8 6.02 33 28 61 –0.62 0.15 1649
9 6.54 47 50 56 –0.10 –0.07 1142
10 5.37 47 56 61 –0.10 –0.21 777
11 6.98 58 50 33 0.30 0.22 1211
12 4.51 92 95 17 1.85 –0.34 646
Mean 5.51 66 63 33 0.65 0.04 1052
Std Dev 0.98 19 20 19 0.80 0.26 288
Further analysis of the accuracy data revealed that the four lowest scoring
participants were at or below chance levels of performance, with d-prime values
in the range –0.6 to 0.0. The patterns of hits and false alarms shown in Table
4, indicate that these observers found the task very difficult and appear to be
responding almost randomly. More generally, we note that only three observers
exceed 75% correct responses, suggesting that this task was far from easy. We
return to this issue, and to the possible implications of chance-level performance
in the discussion.
Stroop Task
. As in Experiment 1, Stroop interference was calculated as the
difference in total reading time for the inconsistent list (M = 12.7 seconds)
minus the reading time for the neutral list (M = 7.2 seconds). The presence of
interference was consistent across all observers, (t(11) = 19.5, p <.001), and
ranged from 4.51 seconds to 7.11 seconds (M = 5.5 seconds).
Discussion
The relationship between biological motion performance and selective
attention, observed in Experiment 1, was replicated in this experiment, despite
the absence of masking. This suggests that the correlation does not reflect a
general ability to segment targets from their background but is more specifically
related to the presence of point-light figures in these two, quite different, tasks.
A rather unexpected finding in Experiment 2 was the relatively low
levels of correct responses. In general, observers were not able to perform the
orientation judgement as easily as we anticipated. As mentioned above, only
three observers performed at anywhere near ceiling levels. Modest hit rates and
the appearance of false alarms were quite common (see Table 4). Sumi (1984)
noted that inverted figures are sometimes interpreted as novel, upright actions,
demonstrating the dominance of the stimulus-driven percept. This may account
for the frequency of the false alarms. It remains unclear why the upright actions
were missed on numerous occasions. One possibility is that the use of a 45°
viewing angle could have caused some confusion.
The fact that four of our observers were at or below chance raised concerns
about whether they should be included in the correlation analysis. However,
we should note that when they were removed, the patterns of both speed and
accuracy correlations did not change. For example, the strength of the reaction
time/Stroop relationship actually improved (r = 0.79, p <0.05).
r
GENERAL DISCUSSION
In two experiments we have demonstrated that performance on biological
motion tasks is highly correlated with the ability to control selective attention.
Observers who are better able to focus on relevant targets or dimensions – as
indexed by Stroop and Flanker Interference measures – are better able to process
point-light figures. This is true both when those figures are embedded in noise
and when they appear alone, without any form of masking. Other aspects of
attention, such as orienting, alerting and visual search efficiency showed no such
relationship.
The significance of these results lies in the fact that biological motion
processing is typically characterized as a spontaneous and automatic process,
not one thought to rely heavily on central resources, such as attention (Giese
& Poggio, 2003; Johansson, 1973; 1975; Mather et al., 1992). Thus, while
many other forms of effortful visual task might show a similar correlation with
attention, such a finding is not a straightforward prediction within the context of
biological motion.
et al., 1992), and, indeed, some of the most direct empirical work comes from
our own group (Thornton & Vuong, 2004). It also seems, however, that this
processing route is sometimes not sufficient to support appropriate behavioural
responses (Blake & Shiffrar, 2007). That is, certain display manipulations or
task demands may require the addition of top-down, active processing strategies
in order to explicitly interpret point-light stimuli (e.g., Bertenthal & Pinto, 1993;
Bülthoff et al., 1998; Cavanagh et al., 2001; Thornton et al., 1998; Thornton et
al., 2002). We believe our current findings relate specifically to this latter form
of processing.
Following from previous studies indicating that attention may be involved
in biological motion processing (e.g., Battelli, et al., 2003; Cavanagh, et al.,
2001; Thornton, et al., 2002) our contribution here is to highlight the likely
role of one specific network of attention, one that is involved in selection
and executive control (e.g, Posner & Peterson, 1990). This finding may help
to identify appropriate tasks to further probe the role of attention in biological
motion processing – for example search for change (Rensink, 2002), attentional
blink (Raymond et al., 1992) or visual marking (Watson & Humphreys, 1997) –
and may even help constrain the interpretation of emerging lesion and imaging
studies, such as the recently noted involvement of frontal cortex in the processing
of biological motion (e.g., Saygin et al., 2004; Saygin, 2007).
Finally, we’d like to consider the implications of another feature of our
data, that is, the variability in biological motion responses. While some
inter-subject variability is always to be expected in any task, the range of responses
we found, particularly in Experiment 2 – with one group of observers at chance,
and another close to the ceiling – was a little surprising. Such variability seems
inconsistent with the notion that a single, bottom-up, passive mechanism could
be supporting behaviour in an automatic fashion (Johansson, 1973; 1975). Our
observers were relatively naïve, and received only very minimal pre-experimental
exposure, but then their task – is the actor upside-down – could not be considered
very demanding. This raises two issues. Firstly, is such variability unusual
when naïve observers have to make decisions on unmasked point-light stimuli?
Typically, studies of biological motion, at least with normal populations, have
not considered individual data to be of interest, so it will have been averaged
away. Second, could this variability tell us something useful about the nature of
biological motion processing? Here, clearly, we have shown one way in which
such data can be informative.
ACKNOWLEDGEMENTS
The authors would like to thank Quoc C Vuong for helpful comments on earlier version of this work and Andries Hof for research assistance. We would also like to thank Jin Fan who was kind enough to provide the source code for the ANT.
REFERENCES
Allison, T., Puce, A., & McCarthy, G. (2000). Social perception from visual cues: Role of the STS region.Trends in Cognitive Sciences, 4, 267–278.
Battelli, L., Cavanagh, P., & Thornton, I. M. (2003). Perception of biological motion in parietal patients. Neuropsychologica, 41 (13): 1808–1816
Bertenthal, B. I., & Pinto, J. (1994). Global processing of biological motions. Psychological Science, 5,221–225.
Blake, R., & Shiffrar, M. (2007). Perception of human motion. Annual Review of Psychology, 58, 47-73.
Bülthoff, I., Bülthoff, H. H., & Sinha, P. (1998). Top-down influences on stereoscopic depth-perception.Nature Neuroscience, 1(3), 254–257.
Cavanagh, P., Labianca, A. T., & Thornton, I. M. (2001). Attention-based visual routines: sprites. Cognition, 80(1–2), 47–60.
Corbetta, M., & Shulman, G. L. (2002). Control of goal-directed and stimulus-driven attention in the brain.Nature Neuroscience Reviews, 3, 201–215.
Cutting, J. E. (1978). A program to generate synthetic walkers as dynamic point-light displays,
Behavior Research Methods & Instrumentation, 10, 91–94.
Cutting, J. E., Moore, C., & Morrison, R. (1988). Masking the motions of human gait.
Perception & Psychophysics, 44, 339–347.
Dittrich, W. H. (1993). Action categories and the perception of biological motion. Perception, 22, 15–22.
Downing, P. E., Jiang, Y., Shuman, M., & Kanwisher, N. G. (2001). A cortical area selective for visual processing of the human body. Science, 293, 2470–2473.
Eriksen, B. A., & Eriksen, C. W. (1974). Effects of noise letters upon the identification of a target letter in a non-search task.Perception & Psychophysics, 16(1),143–149.
Fan, J. I., McCandliss, B. D., Somer, T., Raz, A., and Posner, M.I. (2002). Testing the efficiency and independence of attentional networks. Journal of Cognitive Neuroscience, 14, 340–347.
Giese, M. A., Thornton, I., & Edelman, S. (2008). Metrics of the perception of body movement.
Journal of Vision, 8(9):13, 1–18.
Giese, M. A., & Poggio, T. (2003). Neural mechanisms for the recognition of biological movements.Nature Reviews: Neuroscience, 4,179–192.
Grossman, E., & Blake, R. (2002). Brain areas active during visual perception of biological motion.Neuron, 35(6), 1157–1165.
Grossman, E., Donnelly, M., Price, R., Pickens, D., Morgan, V., Neighbor, G., et al. (2000). Brain areas involved in perception of biological motion. Journal of Cognitive Neuroscience, 12(5), 711–720.
Hemeren, P.E. (1996) Frequency, ordinal position and semantic distance as measures of cross-cultural stability and hierarchies for action verbs. Acta Psychologica, 91, 39–66. Hunt, A. R., & Halper, F. (2008). Disorganizing biological motion. Journal of Vision, 8(9):12,
Inman, V. T., Ralston, H., & Todd, F. (1981).Human Walking. Williams & Wilkins: Baltimore, MD.
Jacobs, A., Pinto, J., & Shiffrar, M. (2004). Experience, context and the visual perception of human movement. Journal of Experimental Psychology: Human Perception and Performance, 30(5), 822–35.
James, W. (1890/1950). Principles of psychology.New York: Holt.
Jokisch, D., Daum, I., and Troje, N. F. (2006) Self recognition versus recognition of others by biological motion: Viewpoint-dependent effects.Perception, 35, 911–920.
Johansson, G. (1973). Visual perception of biological motion and a model for it’s analysis.
Perception & Psychophysics, 14,201–211.
Johansson, G. (1975). Visual motion perception.Scientific American, 232, 76–88.
Knoblich, G., & Prinz, W. (2001). Recognition of self-generated actions from kinematic displays of drawing. Journal of Experimental Psychology: Human Perception and Performance, 27, 456–465.
Kontaris, I., Wiggett, A. J., Downing, P. E. (2009). Dissociation of extrastriate body and biological-motion selective areas by manipulation of visual-motor congruency.
Neuropsychologia, in press, doi:10.1016/j.neuropsychologia.2009.07.012
Lange, J., Georg, K., & Lappe, M. (2006). Visual perception of biological motion by form: A template-matching analysis.Journal of Vision, 6(8):6, 836–849, http://journalofvision. org/6/8/6/, doi: 10.1167/6.8.6.
Mather, G., Radford, K., & West, S. (1992). Low level visual processing of biological motion.
Proceedings of the Royal Society of London, Series B, Biol Sci,249, 149–155.
Macmillan, N. A., & Creelman, C. D. (2005). Detection Theory: A User’s Guide (2ndd ed.).
Mahwah, N.J.: Lawrence Erlbaum Associates.
Marrocco, R. T., & Davidson, M. C. (1998). Neurochemistry of attention. In R. Parasuraman (Ed.), The attention brain (pp. 35–50). Cambridge, MA: MIT Press.
Neisser, U. (1976).Cognition and reality: principles and implications of cognitive psychology. San Francisco, CA: WH Freeman.
Pardo, J. V., Fox, P. T., & Raichle, M. E. (1991). Localization of a human system for sustained attention. Nature, 349, 61–63.
Pavlova, M. & Sokolov, A. (2000). Orientation specificity in biological motion perception.
Perception & Psychophysics, 62, 889–899.
Pinsk, M. A., Arcaro, M.,Weiner, K. S., Kalkus, J. F., Inati, S. J., Gross, C. G., et al. (2009). Neural representations of faces and body parts in macaque and human cortex: A comparative FMRI study.Journal of Neurophysiology, 101, 2581–2600.
Pollick, F. E., Kay, J., Heim, K. & Stringer, R. (2005). Gender Recognition from point-light walkers, Journal of Experimental Psychology: Human Perception and Performance, 31(6), 1247–1265
Posner, M. I. (1980). Orienting of attention.Quarterly Journal of Experimental Psychology, 32, 3–25.
Posner, M. I., & Peterson, S. E. (1990). The attention system of the human brain. Annual review of neuroscience, 13, 25–42.
Puce, A., & Perrett, D. (2003). Electrophysiology and brain imaging of biological motion.
Raymond, J. E. (2000). Attentional modulation of visual motion perception. Trends in Cognitive Sciences, 4(2), 42–50.
Raymond, J. E., Shapiro, K. L., Arnell, K. M. (1992). Temporary suppression of visual processing in an RSVP task: An attentional blink? Journal of Experimental Psychology: Human Perception and Performance, 18(3), 849–860.
Rensink, R. A. (2002). Change Detection.Annual Review of Psychology, 53,245–277. Runeson, S., & Frykholm, G. (1981). Visual perception of lifted weights. Journal of
Experimental Psychology: Human Perception and Performance, 7,733–740.
Saygin, A. P. (2007). Superior temporal and premotor brain areas necessary for biological motion perception.Brain, 130(9), 2452–2461.
Saygin A. P., Wilson, S. M, Hagler, D. J Jr, Bates, E., Sereno, M. I. (2004). Point-light biological motion perception activates human premotor cortex. Journal of Neuroscience, 24, 6181–8.
Schwarzlose, R. F., Baker, C. I., & Kanwisher, N. (2005). Separate face and body selectivity on the fusiform gyrus.Journal of Neuroscience, 25, 11055–11059.
Stroop, J. R. (1935). Studies Of Interference In Serial Verbal Reactions. Journal of Experimental Psychology, 18,643–662.
Sumi, S. (1984). Upside-down presentation of the Johansson moving light-spot pattern.
Perception, 13, 283–286.
Thornton, I. M., Pinto, J. & Shiffrar, M. (1998). The visual perception of human locomotion.
Cognitive Neuropsychology, 15,535–552.
Thornton, I. M., Rensink, R. A., & Shiffrar, M. (2002). Active versus passive processing of biological motion. Perception, 31,837–853
Thornton, I. M., Vuong, Q. C., & Bülthoff, H. H. (2003). A chimeric point-light walker.
Perception, 32, 377–383.
Vanrie, J., & Verfaillie, K. (2004). Perception of biological motion: A stimulus set of human point-light actions. Behavior Research Methods, Instruments, & Computers. 36,
625–629.
Watson, D. G. & Humphreys, G. W. (1997). Visual Marking: Prioritizing selection for new objects by top-down attentional inhibition of old objects.Psychological Review, 104 (1), 90–122.