BGD
12, 18973–18998, 2015
Variations of leaf N, P concentrations in shrubland biomes
X. Yang et al.
Title Page
Abstract Introduction
Conclusions References
Tables Figures
◭ ◮
◭ ◮
Back Close
Full Screen / Esc
Printer-friendly Version Interactive Discussion
Discussion
P
a
per
|
Discussion
P
a
per
|
Discussion
P
a
per
|
Discussion
P
a
per
|
Biogeosciences Discuss., 12, 18973–18998, 2015 www.biogeosciences-discuss.net/12/18973/2015/ doi:10.5194/bgd-12-18973-2015
© Author(s) 2015. CC Attribution 3.0 License.
This discussion paper is/has been under review for the journal Biogeosciences (BG). Please refer to the corresponding final paper in BG if available.
Variations of leaf N, P concentrations in
shrubland biomes across northern China:
phylogeny, climate and soil
X. Yang1, X. Chi1, C. Ji1, H. Liu1, W. Ma2, A. Mohhammat3, Z. Shi4, X. Wang5, S. Yu6, M. Yue7, and Z. Tang1,8
1
Department of Ecology, College of Urban and Environmental Sciences and Key Laboratory for Earth Surface Processes, Peking University, Beijing, China
2
College of Life Science, Inner Mongolia University, Hohhot, China 3
Xinjiang Institute of Ecology and Geography, Chinese Academy of Sciences, Urumqi, China 4
College of Agriculture, Henan University of Science and Technology, Luoyang, China 5
College of Forestry, Beijing Forestry University, Beijing, China 6
Institute of Botany, Chinese Academy of Science, Beijing, China 7
College of Life Science, Northwest University, Xi’an, China 8
Collaborative Innovation Center for Ecology, Beijing, China
Received: 9 August 2015 – Accepted: 2 November 2015 – Published: 27 November 2015
Correspondence to: Z. Tang ([email protected])
BGD
12, 18973–18998, 2015
Variations of leaf N, P concentrations in shrubland biomes
X. Yang et al.
Title Page
Abstract Introduction
Conclusions References
Tables Figures
◭ ◮
◭ ◮
Back Close
Full Screen / Esc
Printer-friendly Version Interactive Discussion
Discussion
P
a
per
|
Discussion
P
a
per
|
Discussion
P
a
per
|
Discussion
P
a
per
|
Abstract
Concentrations of leaf nitrogen (N) and phosphorus (P) are key leaf traits in ecosys-tem functioning and dynamics. Foliar stoichiometry varies remarkably among life forms. However, previous studies have focused on trees and grasses, leaving the knowledge gap for the stoichiometric patterns of shrubs. In this study, we explored the intra- and
5
interspecific variations of leaf N and P concentration in relation to climate, soil prop-erty and evolutionary history based on 1486 samples composed of 163 shrub species
from 361 shrubland sites in northern China expanding 46.1◦ (86.7–132.8◦E) in
longi-tude and 19.8◦(32.6–52.4◦N) in latitude. The results showed that leaf N concentration decreased with precipitation, leaf P concentration decreased with temperature and
in-10
creased with precipitation and soil P concentration. Both leaf N and P concentrations were phylogenetically conserved, but leaf P concentration was less conserved than leaf N concentration. At community level, climates explained more interspecific, while soil nutrient explained more intraspecific, variation of leaf nutrient concentrations. These results suggested that leaf N and P concentrations responded to climate, soil, and
phy-15
logeny in different ways. Climate influenced the community chemical traits through the
shift in species composition, whereas soil directly influenced the community chemical traits.
1 Introduction
Understanding how and why plant stoichiometry vary among species and sites is the
20
most important single step towards understanding land ecosystem properties in gen-eral, including biogeochemical cycles, plant trait evolution, plant communities and their functional characteristics in a changing climate (Westoby and Wright, 2006). Concen-trations of leaf nitrogen (N) and phosphorus (P) play crucial roles in ecosystem
func-tioning and dynamics (Sterner and Elser, 2002; Wright et al., 2004; Kerkhoff et al.,
25
BGD
12, 18973–18998, 2015
Variations of leaf N, P concentrations in shrubland biomes
X. Yang et al.
Title Page
Abstract Introduction
Conclusions References
Tables Figures
◭ ◮
◭ ◮
Back Close
Full Screen / Esc
Printer-friendly Version Interactive Discussion
Discussion
P
a
per
|
Discussion
P
a
per
|
Discussion
P
a
per
|
Discussion
P
a
per
|
for photosynthesis, plant production and litter decomposition (LeBauer and Treseder, 2008), while P is a limiting nutrient responsible for the energy storage, cell structure, and the composition of DNA and RNA. Plant leaves vary dramatically in N and P con-centrations, despite their shared key functional purpose of photosynthetic carbon as-similation and transpiration (Elser et al., 2003; Reich and Oleksyn, 2004; Wright et al.,
5
2004; Kerkhoff et al., 2006; Chen et al., 2013). This is partly because of the diff er-ences in climate, soil, vegetation types, and developing history among sites (Westoby and Wright, 2006). For example, leaf N and P concentrations are higher in herbs than
in woody plants and in deciduous than in evergreen species (Kerkhoff et al., 2006)
and decrease with latitude at large scales (McGroddy et al., 2004; Reich and Oleksyn,
10
2004; Han et al., 2005, 2011; Kerkhoffet al., 2006). Studying the patterns of leaf N and P concentrations is important in understanding the macroecological patterns in plant stoichiometry and related driving factors (Han et al., 2005).
Several hypotheses have been proposed to explain the patterns of plant stoichiom-etry (Elser et al., 2003; Reich and Oleksyn, 2004), among which the plant physiology
15
hypothesis (Woods et al., 2003; Reich and Oleksyn, 2004), the biogeochemical hypoth-esis (McGroddy et al., 2004; Reich and Oleksyn, 2004) and the species composition hypothesis (Reich and Oleksyn, 2004; He et al., 2006) have been mostly reported. The plant physiology hypothesis proposes that concentrations of N and P in plant
tis-sues increase as the ambient temperature decreases to offset the decreases in plant
20
metabolic rate (Woods et al., 2003; Reich and Oleksyn, 2004). Studies in arid regions also proposed that plants tend to have higher leaf N concentration to better adapt to arid environments (Cunningham et al., 1999; Wright et al., 2003) through exploiting greater light availability (Cunningham et al., 1999) while reducing stomatal conductance and transpiration rate (Wright et al., 2003). The biogeochemical hypothesis suggests that
25
BGD
12, 18973–18998, 2015
Variations of leaf N, P concentrations in shrubland biomes
X. Yang et al.
Title Page
Abstract Introduction
Conclusions References
Tables Figures
◭ ◮
◭ ◮
Back Close
Full Screen / Esc
Printer-friendly Version Interactive Discussion
Discussion
P
a
per
|
Discussion
P
a
per
|
Discussion
P
a
per
|
Discussion
P
a
per
|
Even within a site at small spatial scales, leaf N and P concentrations can also vary substantially (Westoby and Wright, 2006). In a neotropical rainforest, for example, N concentration of sunlit leaves of canopy trees have been reported to vary between 0.6 and 3.0 % (Roggy et al., 1999). Recent studies conducted from tropical forest to alpine grassland biomes suggested that species composition was the primary determinant
5
of stoichiometry, with climatic variables having little effect (Townsend et al., 2007; He et al., 2008). The difference of stoichiometry between species may be highly correlated with the phylogenetic relatedness of the species involved, as the niche and traits may
be phylogenetically conserved (Kerkhoffet al., 2006; Stock and Verboom, 2012).
All hypotheses have received supports from empirical studies by using meta data
10
(McGroddy et al., 2004; Reich and Oleksyn, 2004; Wright et al., 2004; Han et al., 2005; Ordoñez et al., 2009; Stock and Verboom, 2012) or standardized large scale samplings (He et al., 2006, 2008; Fyllas et al., 2009; Liu et al., 2012; Chen et al., 2013). These hypotheses may function simultaneously; none of them has been proved to prior to oth-ers. Particularly, most of these studies have biased for trees in forests (McGroddy et al.,
15
2004; Townsend et al., 2007; Chen et al., 2013) and herbaceous plants in grasslands (Craine et al., 2005; He et al., 2006, 2008). Reports on simultaneous measurements of leaf chemistry from shrubland communities or for shrub species are rare (but see Liu et al., 2012), but are strongly needed for a closer evaluation of plant nutrient use strategies, potentially underlying evolutionary processes, and plant-soil feedbacks on
20
nutrient cycling. As foliar stoichiometry may vary remarkably among life forms (Wright et al., 2004; Han et al., 2005; Kerkhoffet al., 2006), it is therefore necessary to test these hypotheses based on the stoichiometry of shrubs before any consensus can be reached.
Shrubland covers more than 1.23 million km2 (or 12.5 % of the total) in China. The
25
BGD
12, 18973–18998, 2015
Variations of leaf N, P concentrations in shrubland biomes
X. Yang et al.
Title Page
Abstract Introduction
Conclusions References
Tables Figures
◭ ◮
◭ ◮
Back Close
Full Screen / Esc
Printer-friendly Version Interactive Discussion
Discussion
P
a
per
|
Discussion
P
a
per
|
Discussion
P
a
per
|
Discussion
P
a
per
|
the patterns of foliar stoichiometry for shrubs and shrublands in relation to climate, soil property and species composition (and phylogeny).
In this study, we explored the patterns of leaf N and P concentrations of shrubs in relation to climate, soil and evolutionary history in northern China. We have following hypotheses. First, in contrast to soil N, P is particularly low in soils in China (Han et al.,
5
2005), plants may absorb P from soil when it is available; we therefore hypothesize that leaf P concentration is more strongly correlated with soil nutrient availability than leaf N concentration. Second, as plants in arid regions may contain higher N concentrations to better adapt to arid environments, we hypothesize that leaf N concentration may decrease with precipitation; and both leaf N and P concentrations may decrease with
10
MAT based on the plant physiology hypothesis. Third, traits remarkably influenced by environments tend to be weakened in phylogenetic conservation during adaptive evo-lution (Losos, 2008); most vascular plants uptake P through the “mycorrhizal” pathway (Smith et al., 2003) and the infection of mycorrhizal fungi mainly depends on environ-ments (Allen et al., 1995); in contrast, N is relatively sufficient. We therefore hypothesize
15
that leaf N concentration is more phylogenetically conserved than leaf P concentration.
2 Materials and methods
2.1 Sampling collection and measurements
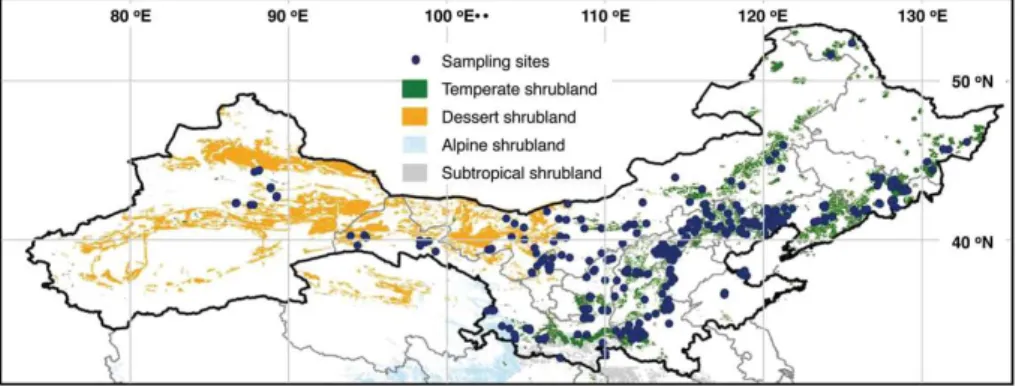
This study was conducted based on an investigation of 361 shrubland sites, includ-ing 289 temperate shrubland, 69 desert shrubland and 3 subalpine shrubland sites,
20
expanding 19.8◦ in latitude (32.6–52.4◦N) and 46.1◦ in longitude (86.7–132.8◦E) in
northern China (Fig. 1). The sampling was conducted in the summer (July to
Septem-ber) of 2011, 2012 and 2013. At each site, three plots of 5 m×5 m, with distances of
5–50 m between edges of nearby plots, were selected to present the natural shrubland communities. We identified all shrub species in each plot, and harvested leaf, stem and
25
BGD
12, 18973–18998, 2015
Variations of leaf N, P concentrations in shrubland biomes
X. Yang et al.
Title Page
Abstract Introduction
Conclusions References
Tables Figures
◭ ◮
◭ ◮
Back Close
Full Screen / Esc
Printer-friendly Version Interactive Discussion
Discussion
P
a
per
|
Discussion
P
a
per
|
Discussion
P
a
per
|
Discussion
P
a
per
|
individuals of each species were collected and assembled in fabric bags then dried in
the sun. Leaf samples were transported to the laboratory and oven-dried at 65◦C for
72 h. In total, we collected 1486 samples composed of 163 species from 38 families and 86 genera, with 91 species sampled from more than one sites.
At each plot, we excavated three pits to the depth of 1 m to collect soil samples at
5
the diagonal of the plot; for each profile, soil samples were taken at the depths of 0– 10, 10–20, 20–30, 30–50, 50–70 and 70–100 cm, and the soil samples from the same depth were mixed.
An elemental analyzer (2400 II CHNS; Perkin-Elmer, Boston, MA, USA) was
em-ployed to measure the total N concentration of the soils (STN) and leaves under 950◦C
10
for combustion then reduced to 640◦C. The molydate/ascorbic acid method was
ap-plied to measure total P concentration in the soils (STP) and leaves after H2SO4-H2O2 digestion (Jones, 2001). As STN and STP from 0–10 cm depth interval were highly cor-related with those from other depth intervals, we only used STN and STP from 0–10 cm depth interval.
15
We also extracted mean annual temperature (MAT) and precipitation (AP) from the WorldClim spatial climate data (resolution at ca 1 km, available at www.worldclim.org/).
MAT in the study sites ranged from−4.1 to 16.0◦C, and AP ranged from 15 to 974 mm.
Please refer to Yang et al. (2014) for more detailed information on data collections.
2.2 Phylogenetic tree and phylogentic signal test
20
We developed a phylogenetic tree for the 163 species by using Phylomatic (Webb and Donoghue, 2005) based on APG III topology to the family level (Bremer et al., 2009). We then conducted K statistic (Blomberg et al., 2003) to quantify the magnitude of phy-logenetic signal of leaf N, P concentrations and N : P ratio. For each species, we first calculated the mean leaf N and P concentrations. To test if the phylogenetic
conser-25
signifi-BGD
12, 18973–18998, 2015
Variations of leaf N, P concentrations in shrubland biomes
X. Yang et al.
Title Page
Abstract Introduction
Conclusions References
Tables Figures
◭ ◮
◭ ◮
Back Close
Full Screen / Esc
Printer-friendly Version Interactive Discussion
Discussion
P
a
per
|
Discussion
P
a
per
|
Discussion
P
a
per
|
Discussion
P
a
per
|
cance (P values) was evaluated by comparing the variance of independent contrasts
for each trait to the expected values calculated by shuffling the tips for 999 times. To quantify the magnitude of phylogenetic signal of species’ environmental niches, we calculated K statistics of mean climate (MAT and AP) and soil chemistry (STN and STP) of all sites each species occurring.
5
2.3 Data analysis
We first examined effects of climate, soil property and evolutionary history on the leaf N, P concentrations and N : P ratio by plotting the concentrations against environmental factors using all data (treating all observations as equal). Leaf N and P concentrations were base 10 log transformed to normalize their distributions before analysis as their
10
frequency distributions were skewed. To eliminate the possible bias resulted from the higher chances of abundant species to be included in raw data, we also analyzed the data at the community level by calculating average values of each species for each site and then averaging them to get mean value for each site.
We followed Lepš et al. (2011) to assess the relative contributions of intra- and
in-15
terspecific variability effects on biomass weighted site-average leaf N, P concentration and N : P ratio along the climatic and soil nutrient gradients. For each site, we calculated “specific” site-average leaf N, P concentration and N: P ratio and “fixed” site-average leaf N, P concentration and N : P ratio with the formulas below:
Specific average=
S
X
i=1 pixi
site (1)
20
Fixed average=
S
X
i=1
pixi (2)
whereS is the number of species in a study site,pi is the proportion of theith species
BGD
12, 18973–18998, 2015
Variations of leaf N, P concentrations in shrubland biomes
X. Yang et al.
Title Page
Abstract Introduction
Conclusions References
Tables Figures
◭ ◮
◭ ◮
Back Close
Full Screen / Esc
Printer-friendly Version Interactive Discussion
Discussion
P
a
per
|
Discussion
P
a
per
|
Discussion
P
a
per
|
Discussion
P
a
per
|
mean leaf N, P concentration or N : P ratio of theith species for all study sites where the species exists, andxi
site is the specific mean leaf N, P concentration or N : P ratio
of theith species for the given site. We assumed that the variation of specific average values is caused by both intra- and interspecific leaf chemical trait variation, while the variation of fixed average values is solely affected by interspecific leaf chemical trait
5
variation. Hence, the effect of intraspecific variability can be estimated using a param-eter calculated as follow:
Intraspecific variability=Specific average−Fixed average (3)
We then used each of the three parameters as a single response variable in general linear model (GLM) regressions and explain them by climatic and soil nutrient factors.
10
The decomposition of sum of squares (SS) can be used across the three GLM models:
SSSpecific=SSFixed+SSIntraspecific+SScovariation (4)
We can then extract the SS for each of the three GLM models explained by each of the environmental factors. In this way, we decomposed the total variation of leaf N, P concentration or N : P ratio into parts explained by intraspecific variation, interspecific
15
variation and their covariation, we also quantified how much variability in each part can
be explained by each environmental factor. We analysed both main-effect GLM
mod-els and GLM modmod-els with interaction terms. Since the results for the main effects of
environmental variables are same, and the variation explained by interaction terms are
relatively small compare to the main-effects, we only presented the main-effect
mod-20
els for simplicity, and showed the models with interaction terms in the supplementary material (Table S1 in the Supplement).
Ecological data on large scale often display spatial autocorrelation, and the presence of such pattern in the residuals of a statistical model may increase type I error rates (Dormann, 2007). We tested for spatial independence of the residuals of the models
25
BGD
12, 18973–18998, 2015
Variations of leaf N, P concentrations in shrubland biomes
X. Yang et al.
Title Page
Abstract Introduction
Conclusions References
Tables Figures
◭ ◮
◭ ◮
Back Close
Full Screen / Esc
Printer-friendly Version Interactive Discussion
Discussion
P
a
per
|
Discussion
P
a
per
|
Discussion
P
a
per
|
Discussion
P
a
per
|
models were not significant (Fig. S1 in the Supplement), indicating that the environ-ments included in the models removed the spatial auto-correlation in the leaf nutrient concentration (Diniz-Filho et al., 2003). Therefore, we did not apply the spatial linear autoregressive models (SLM) in our analyses, because the SLM may underestimate the effects of predictors at large scales (Diniz-Filho et al., 2003).
5
Statistical and phylogenetic analyses were performed using R 3.1.1 (R Development Core Team, 2014) with the basic, ape (Paradis et al., 2004) and picante packages (Kembel et al., 2010). Spatial analyses were conducted using SAM 4.0 (Rangel et al., 2010).
3 Results
10
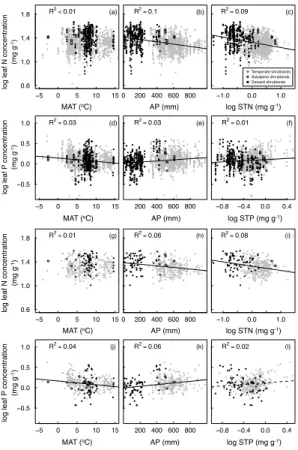
Leaf N and P concentrations changed from 4.26 to 46.80 mg g−1(mean=21.91, SD=
6.84) and 0.16 to 4.80 mg g−1(mean=1.30, SD=0.53) for shrubs in northern China.
Leaf N : P changed from 4.07 to 145.76 (mean=18.69, SD=8.40) (Fig. S2). Leaf N
concentration decreased (R2=0.1, p <0.001), while leaf P concentration increased
(R2=0.03,p <0.001), with AP. Leaf P concentration decreased (R2=0.03,p <0.001),
15
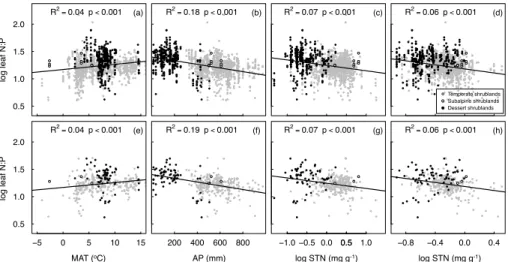
while leaf N concentration showed no significant correlation (R2<0.01, p=0.227), with MAT. Leaf N concentration decreased with STN (R2=0.13,p <0.001), while leaf P concentration increased with STP (R2=0.02, p <0.001) (Fig. 2). Leaf N : P ratio increased with MAT (R2=0.04, p <0.001), while decreased with AP (R2=0.18, p < 0.001), STN (R2=0.07, p <0.001) and STP (R2=0.06,p <0.001) (Fig. 3). All these
20
patterns remained almost unchanged at community level (Figs. 2 and 3).
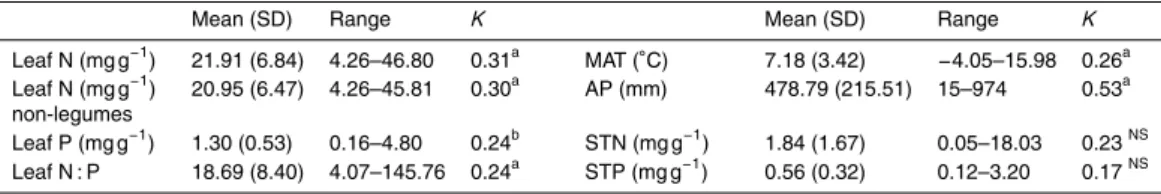
Leaf N concentration exhibited significant non-random phylogenetic signal (K =0.31,
p <0.001), while leaf P concentration showed significant but weaker non-random
phy-logenetic signal (K =0.24, p <0.01) among all species (Table 1). When excluding
legumes from the dataset, the phylogenetic signal for leaf N concentration remained
25
BGD
12, 18973–18998, 2015
Variations of leaf N, P concentrations in shrubland biomes
X. Yang et al.
Title Page
Abstract Introduction
Conclusions References
Tables Figures
◭ ◮
◭ ◮
Back Close
Full Screen / Esc
Printer-friendly Version Interactive Discussion
Discussion
P
a
per
|
Discussion
P
a
per
|
Discussion
P
a
per
|
Discussion
P
a
per
|
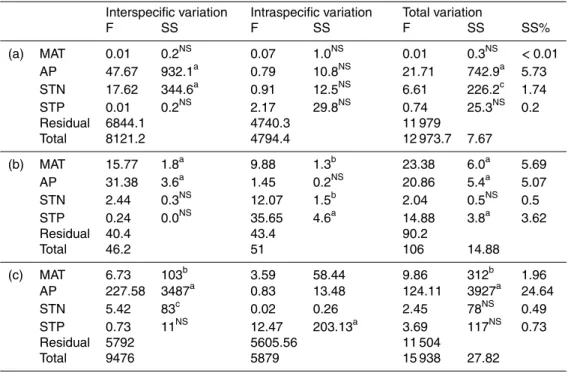
Climatic variables explained 5.7 % of the variation in leaf N concentration, and 10.8 % of the variation in leaf P concentration. Only AP significantly influenced leaf N concen-tration (p <0.001), while all environmental factors except STN significantly influenced
leaf P concentration (p <0.001). MAT, AP, STP and STN explained 1.96, 24.64, 0.49
and 0.73 % of variation in leaf N : P ratio (Table 2).
5
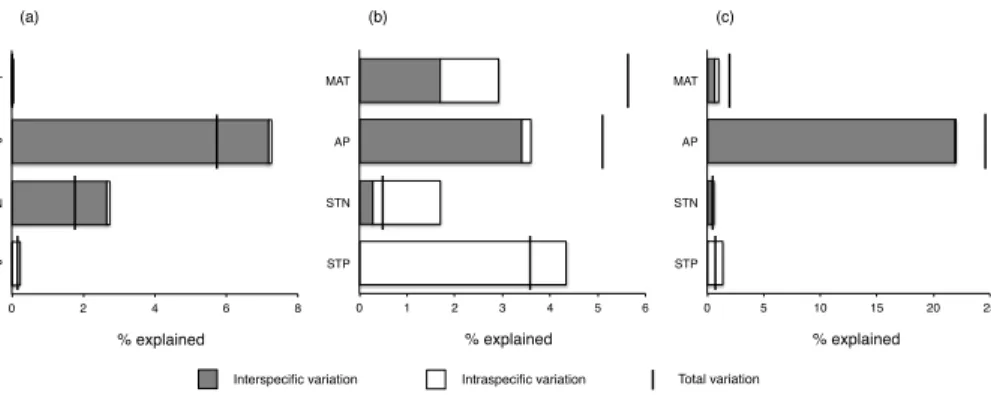
When the total variation of leaf N and P concentrations were decomposed into intra-and interspecific variations, GLM analyses showed that AP intra-and STN explained 7.2 %
(p <0.001) and 2.7 % (p <0.01) of the interspecific variation of leaf N concentration,
respectively. None of MAT, AP, STN and STP significantly influenced intraspecific vari-ation of leaf N concentrvari-ation (p >0.05 for all). For leaf P concentration, MAT and AP
10
accounted for 1.7 % (p <0.001) and 3.4 % (p <0.001) interspecific variation; MAT, STN and STP explained 1.2 % (p <0.01), 1.4 % (p <0.01) and 4.3 % (p <0.001) of intraspe-cific variation, respectively (Table 2; Fig. 4). Come to the leaf N : P ratio, MAT, AP and STN accounted for 0.6 % (p <0.01), 21.9 % (p <0.001) and 0.5 % (p <0.05) of the interspecific variation; STP explained 1.27 % (p <0.001) of the intraspecific variation,
15
respectively (Table 2; Fig. 4).
4 Discussion
Using the foliar stoichiometry of 163 shrub species from 361 shrubland sites, we inves-tigated patterns of leaf N and P concentrations in shrublands of northern China. We focused our discussion on leaf N and P concentrations instead of their ratio because
20
leaf N : P was strongly driven by both leaf N and P concentrations and was predictable based on leaf N and P concentrations. Given that leaf C concentration is relatively sta-ble, leaf N and P concentrations can also be good indicators of C : N and C : P ratios (Reich, 2005). We found that mean leaf N (21.91 mg g−1) and P (1.30 mg g−1) concen-trations of shrubs in northern China shrubland were similar to those in shrubs across
25
BGD
12, 18973–18998, 2015
Variations of leaf N, P concentrations in shrubland biomes
X. Yang et al.
Title Page
Abstract Introduction
Conclusions References
Tables Figures
◭ ◮
◭ ◮
Back Close
Full Screen / Esc
Printer-friendly Version Interactive Discussion
Discussion
P
a
per
|
Discussion
P
a
per
|
Discussion
P
a
per
|
Discussion
P
a
per
|
in trees in China (Han et al., 2005) (Fig. S3). According to the “leaf economics spec-trum”, an “expensive” strategy was characterized by low rates of metabolism, low N and P concentrations, and extended leaf longevity; while a “cheap” strategy was de-fined by high rates of metabolism, high N and P concentrations, and short leaf longevity (Wright et al., 2004). Our result indicated that the life strategy of shrubs is “cheaper”
5
compared with that of trees but more expensive than herbaceous plants. Our results also suggested that the inclusion of shrub is necessary to explore the patterns of leaf stoichiometry in relation to climate and soil property.
There are some novel findings concerning the patterns of leaf stoichiometry, which we discuss below.
10
4.1 Influence of climate on leaf N and P concentrations
Leaf N and P concentrations responded to climate in different ways (Figs. 3 and 4).
Consistent with our hypothesis, leaf N concentration decreased with precipitation. This is partly due to the higher leaf N concentration of plants in dessert shrublands (Figs. 3 and 4). Higher leaf N concentration has been suggested as a general property of
arid-15
zone plants (Wright et al., 2003). It is widely reported that plants tend to increase leaf N to exploit greater light availability while reducing stomatal conductance and tran-spiration rate (Cunningham et al., 1999; Wright et al., 2003). Succulence is such an adaption for plants to drought and salinity by accumulating nitrogen-containing com-pounds in their leaves to maintain water balance and therefore succulent plants are
20
higher in leaf N concentration than other plants (Mansour, 2000) (Fig. S3). In contrast, leaf P concentration increased with precipitation. P is derived primarily from the weath-ering of soil inorganic components and the degradation of organic matters, and diffuses in soil (Aerts and Chapin, 1999). Increase in precipitation may amplify the P availabil-ity in soil by facilitating the decomposition of litters. The positive correlation between
25
STP and precipitation (R2=0.21,p <0.001) and the lower STP in dessert shrubland
BGD
12, 18973–18998, 2015
Variations of leaf N, P concentrations in shrubland biomes
X. Yang et al.
Title Page
Abstract Introduction
Conclusions References
Tables Figures
◭ ◮
◭ ◮
Back Close
Full Screen / Esc
Printer-friendly Version Interactive Discussion
Discussion
P
a
per
|
Discussion
P
a
per
|
Discussion
P
a
per
|
Discussion
P
a
per
|
Leaf P decreased with MAT, which was consistent with the plant physiology hypothe-sis that plant P may increase to offset the decreases in plant metabolic rate as ambient temperature decreases (Reich and Oleksyn, 2004). However, inconsistent with other studies (Reich and Oleksyn, 2004; Han et al., 2005; Chen et al., 2013), we did not observe a decrease in leaf N concentration with temperature. Given the significant
im-5
pact of precipitation on leaf N concentration, a possible reason for this pattern might be the weak but significant negative correlation between MAT and AP in the study region (R2=0.02,p <0.001).
4.2 Influence of soil N, P concentration on leaf N and P concentration
We observed a significant positive correlation between leaf P concentration and STP,
10
but not for leaf N concentration and STN. Such positive correlation between leaf and soil P concentrations might be caused by following reasons. Although leaf P concentra-tion is higher in shrublands of northern China than in forests in China (Han et al., 2005), it is significantly lower than those in the rest of the world (Reich and Oleksyn, 2004). It is widely reported that a leaf N and P ratio (N : P)<14 indicates N limitation, whereas
15
a N : P>16 indicates P limitation, in the ecosystem (Aerts and Chapin, 1999; Koersel-man and MeuleKoersel-man, 1996). In this sense, shrublands of northern China is P limited with a mean N : P of 18.69, though soil P concentration is higher than in southern part of China (Zhang et al., 2005). In the P limited ecosystems, plants may absorb P and deposit P in an inorganic form when P in soil is abundant (Sterner and Elser, 2002),
20
resulting a positive correlation between leaf and soil P concentrations. However, leaf N concentration did not increase with soil N concentration, since N is not limited in soil. The negative correlation between leaf and soil N concentrations might be attributed to the highly positive correlation between STN and precipitation (R2=0.52, p <0.001), since higher precipitation facilitates the decomposition of litters in water-limiting
envi-25
ronments.
BGD
12, 18973–18998, 2015
Variations of leaf N, P concentrations in shrubland biomes
X. Yang et al.
Title Page
Abstract Introduction
Conclusions References
Tables Figures
◭ ◮
◭ ◮
Back Close
Full Screen / Esc
Printer-friendly Version Interactive Discussion
Discussion
P
a
per
|
Discussion
P
a
per
|
Discussion
P
a
per
|
Discussion
P
a
per
|
Condron, 2007; McNeill and Unkovich, 2007) and therefore better indicators of soil fer-tility (Zhang et al., 2005; Ordoñez et al., 2009). Soil available N and P concentration were not measured in this study. However, a recent study on leaf chemical traits of shrub species across Inner Mongolia suggested that total soil nutrient concentrations explained similar amount of variance in leaf N and P concentrations with available soil
5
nutrient concentrations (Liu et al., 2012), indicating that selection of total or available soil nutrient concentrations will not result in big difference in predicting nutrient concen-trations in leaves from the studied region.
4.3 Influence of environmental factors on intra- and interspecific variation of
leaf N and P concentrations
10
Environmental factors explained nearly 15 % of total variance in leaf P concentration on community level, which was two times more than that of leaf N concentration, indi-cating that leaf P concentration is more affected by environmental factors. However, the explanatory powers of climate and soil for leaf N and P concentrations are comparably low, partly because other factors may profoundly affect the leaf stoichiometry, such as
15
soil age (Vitousek et al., 2010; Hayes et al., 2014), but were not included in our model. Interspecific variation of leaf N and P concentrations is caused by changes in species composition, and intraspecific variation of leaf N and P concentrations is driven by envi-ronmental variations. Leaf P was jointly influenced by climate and soil nutrient. Climate influences the community leaf P concentration through shift in species composition,
20
whereas soil influences the community P concentration directly. Leaf N concentration is mainly driven by precipitation, which affects species turnover.
The phylogenetic signal analysis also indicated that the temperature and precipita-tion niches of species exhibited phylogenetic signal, while the soil niche did not (Ta-ble 1). This result was consistent with the previous conclusion that climate explained
25
influ-BGD
12, 18973–18998, 2015
Variations of leaf N, P concentrations in shrubland biomes
X. Yang et al.
Title Page
Abstract Introduction
Conclusions References
Tables Figures
◭ ◮
◭ ◮
Back Close
Full Screen / Esc
Printer-friendly Version Interactive Discussion
Discussion
P
a
per
|
Discussion
P
a
per
|
Discussion
P
a
per
|
Discussion
P
a
per
|
ences the community chemical traits. Changes in leaf chemical traits along climate gradient are mainly due to difference in species composition along the gradient. Partic-ularly, AP showed the strongest phylogenetic signal, largely due to the large gradient in precipitation across the study region and the dramatic variation in species composition adapted to aridity gradient.
5
4.4 Influence of phylogeny on leaf N and P concentrations
Leaf N concentration exhibited strong, while leaf P concentration exhibited weak,
phylo-genetic conservatism (Table 1). Furthermore, phylophylo-genetic effect explained more
vari-ation in leaf N concentrvari-ation than leaf P concentrvari-ation. Legumes (species from the Fabaceae family) are higher in leaf N concentrations (Fig. S3) because of their
abil-10
ity of nitrogen fixation, and therefore may significantly increase theK value of leaf N
concentration. However, when legumes were excluded, theK value remained almost
unchanged (Table 1). Therefore, the phylogenetic conservatism of leaf N concentration is not resulted from the inclusion of legumes.
Plants disperse and evolve in response to changing environment in both time and
15
space (Kerkhoffet al., 2006). In this process, traits that are easily changed by environ-ment tend to be weakened in conservation during adaptive evolution (Losos, 2008). In this study, leaf N concentration was weakly influenced by soil nutrient, and the influ-ence of climate on leaf N concentration mainly works through species turnover. Leaf N concentration therefore exhibited significant phylogenetic signal (Table 1). Leaf P
con-20
centration was significant influenced by soil nutrient, and its conservation was therefore weakened. This could also be attributed to the uptaking mechanism of P. The “mycor-rhizal” pathway is the major pathway of P uptake in most vascular plants (Smith et al., 2003; Plassard and Dell, 2010) and the infection of mycorrhizal fungi mainly depends on environmental conditions rather than the host plants (Allen et al., 1995).
BGD
12, 18973–18998, 2015
Variations of leaf N, P concentrations in shrubland biomes
X. Yang et al.
Title Page
Abstract Introduction
Conclusions References
Tables Figures
◭ ◮
◭ ◮
Back Close
Full Screen / Esc
Printer-friendly Version Interactive Discussion
Discussion
P
a
per
|
Discussion
P
a
per
|
Discussion
P
a
per
|
Discussion
P
a
per
|
5 Conclusions
In this study, we explored the patterns leaf N and P concentrations in relation to climate, soil and evolutionary history in northern China, based on 163 shrub species from 361
sites. We found that leaf N and P concentrations were mainly influenced by different
factors, and thus responded to climate, soil, and evolutionary history differently. Leaf
5
P concentration is jointly driven by soil P concentration and climate, whereas leaf N concentration is mainly driven by precipitation. Both leaf N and P concentrations are phylogenetically conserved, but leaf P concentration is less conserved than leaf N con-centration, which could be attributed to the mechanism that plants utilize P. Changes
in leaf chemical traits along climate gradient are mainly due to difference in species
10
composition along the gradient, whereas soil influences the community chemical traits directly. Future studies of the biogeochemical implications and the evolutionary basis of plant nutrient concentrations in various regions, plant forms and other plant organs are important to understand the macroecological patterns and mechanisms of plant nutrient concentrations.
15
The Supplement related to this article is available online at doi:10.5194/bgd-12-18973-2015-supplement.
Author contributions. X. Yang and Z. Tang conceived and designed the study, X. Yang, Z. Tang and X. Chi, conducted analyses and wrote the paper. X. Yang, C. Ji, H. Liu, W. Ma, A. Mo-hhammat, Z. Shi, X. Wang, S. Yu, M. Yue, and Z. Tang contributed data, discussed the draft
20
manuscript and interpreted the results.
Acknowledgements. The authors are grateful to Y. H. Chen from Institute of Botany, Chinese Academy of Sciences for conducting the measurements.
Funding. This work was partly supported by the National Program on Key Basic Research
25
Prior-BGD
12, 18973–18998, 2015
Variations of leaf N, P concentrations in shrubland biomes
X. Yang et al.
Title Page
Abstract Introduction
Conclusions References
Tables Figures
◭ ◮
◭ ◮
Back Close
Full Screen / Esc
Printer-friendly Version Interactive Discussion
Discussion
P
a
per
|
Discussion
P
a
per
|
Discussion
P
a
per
|
Discussion
P
a
per
|
ity Research Program – Climate Change: Carbon Budget and Related Issues” of CAS (#XDA05050301).
References
Aerts, R. and Chapin, F. S.: The mineral nutrition of wild plants revisited: a re-evaluation of processes and patterns, Adv. Ecol. Res., 30, 1–67, 1999.
5
Allen, E. B., Allen, M. F., Helm, D. J., Trappe, J. M., Molina, R., and Rincon, E.: Pat-terns and regulation of mycorrhizal plant and fungal diversity, Plant Soil, 170, 47–62, doi:10.1007/BF02183054, 1995.
Blomberg, S. P., Garland, T., and Ives, A. R.: Testing for phylogenetic signal in compar-ative data: behavioral traits are more labile, Evolution, 57, 717–745,
doi:10.1111/j.0014-10
3820.2003.tb00285.x, 2003.
Bremer, B., Bremer, K., Chase, M., Fay, M., Reveal, J., Soltis, D., Soltis, P., and Stevens, P.: An update of the Angiosperm Phylogeny Group classification for the orders and fami-lies of flowering plants: APG III, Bot. J. Linn. Soc., 161, 105–121, doi:10.1111/j.1095-8339.2009.00996.x, 2009.
15
Bünemann, E. K. and Condron, L. M.: Phosphorus and sulphur cycling in terrestrial ecosys-tems, in: Nutrient cycling in terrestrial ecosysecosys-tems, edited by: Marschner, P. and Rengel, Z., Springer, Heidelberg, 65–92, 2007.
Chen, Y., Han, W., Tang, L., Tang, Z., and Fang, J.: Leaf nitrogen and phosphorus
concentra-tions of woody plants differ in responses to climate, soil and plant growth form, Ecography,
20
36, 178–184, doi:10.1111/j.1600-0587.2011.06833.x, 2013.
Craine, J. M., Lee, W. G., Bond, W. J., Williams, R. J., and Johnson, L. C.: Environmental constraints on a global relationship among leaf and root traits of grasses, Ecology, 86, 12– 19, doi:10.1890/04-1075, 2005.
Cunningham, S. A., Summerhayes, B., and Westoby, M.: Evolutionary divergences in leaf
struc-25
ture and chemistry, comparing rainfall and soil nutrient gradients, Ecol. Monogr., 69, 569– 588, doi:10.1890/0012-9615(1999)069[0569:EDILSA]2.0.CO;2, 1999.
Diniz-Filho, J. A. F., Bini, L. M., and Hawkins, B. A.: Spatial autocorrelation and red her-rings in geographical ecology, Global Ecol. Biogeogr., 12, 53–64, doi:10.1046/j.1466-822X.2003.00322.x, 2003.
BGD
12, 18973–18998, 2015
Variations of leaf N, P concentrations in shrubland biomes
X. Yang et al.
Title Page
Abstract Introduction
Conclusions References
Tables Figures
◭ ◮
◭ ◮
Back Close
Full Screen / Esc
Printer-friendly Version Interactive Discussion
Discussion
P
a
per
|
Discussion
P
a
per
|
Discussion
P
a
per
|
Discussion
P
a
per
|
Dormann, C. F.: Effects of incorporating spatial autocorrelation into the analysis of species
dis-tribution data, Global Ecol. Biogeogr., 16, 129–138, doi:10.1111/j.1466-8238.2006.00279.x, 2007.
Editorial Committee of Vegetation Map of China: Vegetation Map of the People’s Republic of China 1 : 1, 000, 000, Geological Publishing House, Beijing, China, 2007.
5
Elser, J. J., Acharya, K., Kyle, M., Cotner, J., Makino, W., Markow, T., Watts, T., Hobbie, S., Fagan, W., Schade, J., Hood, J., and Sterner, R. W.: Growth rate-stoichiometry couplings in diverse biota, Ecol. Lett., 6, 936–943, doi:10.1046/j.1461-0248.2003.00518.x, 2003.
Fyllas, N. M., Patiño, S., Baker, T. R., Bielefeld Nardoto, G., Martinelli, L. A., Quesada, C. A., Paiva, R., Schwarz, M., Horna, V., Mercado, L. M., Santos, A., Arroyo, L., Jiménez, E. M.,
10
Luizão, F. J., Neill, D. A., Silva, N., Prieto, A., Rudas, A., Silviera, M., Vieira, I. C. G., Lopez-Gonzalez, G., Malhi, Y., Phillips, O. L., and Lloyd, J.: Basin-wide variations in foliar prop-erties of Amazonian forest: phylogeny, soils and climate, Biogeosciences, 6, 2677–2708, doi:10.5194/bg-6-2677-2009, 2009.
Han, W., Fang, J., Guo, D., and Zhang, Y.: Leaf nitrogen and phosphorus stoichiometry
15
across 753 terrestrial plant species in China, New Phytol., 168, 377–385, doi:10.1111/j.1469-8137.2005.01530.x, 2005.
Han, W. X., Fang, J. Y., Reich, P. B., Ian Woodward, F., and Wang, Z. H.: Biogeography and vari-ability of eleven mineral elements in plant leaves across gradients of climate, soil and plant functional type in China, Ecol. Lett., 14, 788–796, doi:10.1111/j.1461-0248.2011.01641.x,
20
2011.
Hayes, P., Turner, B. L., Lambers, H., and Laliberté, E.: Foliar nutrient concentrations and
re-sorption efficiency in plants of contrasting nutrient-acquisition strategies along a
2-million-year dune chronosequence, J. Ecol., 102, 396–410, doi:10.1111/1365-2745.12196, 2014. He, J., Fang, J., Wang, Z., Guo, D., Flynn, D. F. B., and Geng, Z.: Stoichiometry and
large-25
scale patterns of leaf carbon and nitrogen in the grassland biomes of China, Oecologia, 149, 115–122, doi:10.1007/s00442-006-0425-0, 2006.
He, J.-S., Wang, L., Flynn, D. F. B., Wang, X., Ma, W., and Fang, J.: Leaf nitro-gen:phosphorus stoichiometry across Chinese grassland biomes, Oecologia, 155, 301–310, doi:10.1007/s00442-007-0912-y, 2008.
30
BGD
12, 18973–18998, 2015
Variations of leaf N, P concentrations in shrubland biomes
X. Yang et al.
Title Page
Abstract Introduction
Conclusions References
Tables Figures
◭ ◮
◭ ◮
Back Close
Full Screen / Esc
Printer-friendly Version Interactive Discussion
Discussion
P
a
per
|
Discussion
P
a
per
|
Discussion
P
a
per
|
Discussion
P
a
per
|
Kembel, S. W., Cowan, P. D., Helmus, M. R., Cornwell, W. K., Morlon, H., Ackerly, D. D., Blomberg, S. P., and Webb, C. O.: Picante: R tools for integrating phylogenies and ecology, Bioinformatics, 26, 1463–1464, doi:10.1093/bioinformatics/btq166, 2010.
Kerkhoff, A. J., Fagan, W. F., Elser, J. J., and Enquist, B. J.: Phylogenetic and growth form
variation in the scaling of nitrogen and phosphorus in the seed plants, Am. Nat., 168, E103–
5
122, doi:10.1086/507879, 2006.
Koerselman, W. and Meuleman, A. F. M.: The vegetation N : P ratio: a new model tool to detect the nature of nutrient limitation, J. Appl. Ecol., 33, 1441–1450, 1996.
LeBauer, D. S. and Treseder, K. K.: Nitrogen limitation of net primary productivity in terrestrial ecosystems is globally distributed, Ecology, 89, 371–379, doi:10.1890/06-2057.1, 2008.
10
Lepš, J., de Bello, F.,Šmilauer, P., and Doležal, J.: Community trait response to environment:
disentangling species turnover vs intraspecific trait variability effects, Ecography, 34, 856–
863, doi:10.1111/j.1600-0587.2010.06904.x, 2011.
Liu, C., Wang, X., Wu, X., Dai, S., He, J.-S., and Yin, W.: Relative effects of phylogeny, biological
characters and environments on leaf traits in shrub biomes across central Inner Mongolia,
15
China, J. Plant Ecol., 6, 220–231, doi:10.1093/jpe/rts028, 2012.
Losos, J. B.: Phylogenetic niche conservatism, phylogenetic signal and the relationship be-tween phylogenetic relatedness and ecological similarity among species, Ecol. Lett., 11, 995–1003, doi:10.1111/j.1461-0248.2008.01229.x, 2008.
McGroddy, M. E., Daufresne, T., and Hedin, L. O.: Scaling of C : N : P stoichiometry in
20
forests worldwide: implications of terrestrial redfield-type ratios, Ecology, 85, 2390–2401, doi:10.1890/03-0351, 2004.
McNeill, A. and Unkovich, M.: The nitrogen cycle in terrestrial ecosystems, in: Nutrient Cycling in Terrestrial Ecosystems, edited by: Marschner, P. and Rengel, Z., Springer, Heidelberg, 37–64, 2007.
25
Mansour, M. M. F.: Nitrogen containing compounds and adaptation of plants to salinity stress, Biol. Plantarum, 43, 491–500, doi:10.1023/A:1002873531707, 2000.
Moran, P. A. P.: Notes on continuous stochastic phenomena, Biometrika, 37, 17–23, doi:10.2307/2332142, 1950.
Ordoñez, J. C., van Bodegom, P. M., Witte, J.-P. M., Wright, I. J., Reich, P. B., and Aerts, R.:
30
BGD
12, 18973–18998, 2015
Variations of leaf N, P concentrations in shrubland biomes
X. Yang et al.
Title Page
Abstract Introduction
Conclusions References
Tables Figures
◭ ◮
◭ ◮
Back Close
Full Screen / Esc
Printer-friendly Version Interactive Discussion
Discussion
P
a
per
|
Discussion
P
a
per
|
Discussion
P
a
per
|
Discussion
P
a
per
|
Paradis, E., Claude, J., and Strimmer, K.: APE: analyses of phylogenetics and evolution in R language, Bioinformatics, 20, 289–290, doi:10.1093/bioinformatics/btg412, 2004.
Plassard, C. and Dell, B.: Phosphorus nutrition of mycorrhizal trees, Tree Physiol., 30, 1129– 1139, doi:10.1093/treephys/tpq063, 2010.
R Development Core Team: R: a Language and Environment for Statistical Computing,
5
R Found. Stat. Comput., Vienna, available at: http://www.r-project.org/ (last access: 20 Jan-uary 2015), 2014.
Rangel, T. F., Diniz-Filho, J. A. F., and Bini, L. M.: SAM: a comprehensive application for spa-tial analysis in macroecology, Ecography, 33, 46–50, doi:10.1111/j.1600-0587.2009.06299.x, 2010.
10
Reich, P. B.: Global biogeography of plant chemistry: filling in the blanks, New Phytol., 168, 263–266, doi:10.1111/j.1469-8137.2005.01562.x, 2005.
Reich, P. B. and Oleksyn, J.: Global patterns of plant leaf N and P in relation to temperature and latitude, P. Natl. Acad. Sci. USA, 101, 11001–11006, doi:10.1073/pnas.0403588101, 2004. Roggy, J. C., Prévost, M. F., Gourbiere, F., Casabianca, H., Garbaye, J., and Domenach, A. M.:
15
Leaf natural15N abundance and total N concentration as potential indicators of plant N
nu-trition in legumes and pioneer species in a rain forest of French Guiana, Oecologia, 120, 171–182, doi:10.1007/s004420050846, 1999.
Smith, S. E., Smith, F. A., and Jakobsen, I.: Mycorrhizal fungi can dominate phos-phate supply to plants irrespective of growth responses, Plant Physiol., 133, 16–20,
20
doi:10.1104/pp.103.024380, 2003.
Sterner, R. W. and Elser, J. J.: Ecological Stoichiometry: The Biology of Elements from Molecules to the Biosphere, Princeton University Press, Princeton, NJ, 2002.
Stock, W. D. and Verboom, G. A.: Phylogenetic ecology of foliar N and P concentrations and N : P ratios across mediterranean-type ecosystems, Global Ecol. Biogeogr., 21, 1147–1156,
25
doi:10.1111/j.1466-8238.2011.00752.x, 2012.
Townsend, A. R., Cleveland, C. C., Asner, G. P., and Bustamante, M. M. C.: Controls over foliar N : P ratios in tropical rain forests, Ecology, 88, 107–118, doi:10.1890/0012-9658(2007)88[107:COFNRI]2.0.CO;2, 2007.
Vitousek, P. M., Porder, S., Houlton, B. Z., and Chadwick, O. A.: Terrestrial phosphorus
lim-30
BGD
12, 18973–18998, 2015
Variations of leaf N, P concentrations in shrubland biomes
X. Yang et al.
Title Page
Abstract Introduction
Conclusions References
Tables Figures
◭ ◮
◭ ◮
Back Close
Full Screen / Esc
Printer-friendly Version Interactive Discussion
Discussion
P
a
per
|
Discussion
P
a
per
|
Discussion
P
a
per
|
Discussion
P
a
per
|
Webb, C. O. and Donoghue, M. J.: Phylomatic: tree assembly for applied phylogenetics, Mol. Ecol. Notes, 5, 181–183, doi:10.1111/j.1471-8286.2004.00829.x, 2005.
Westoby, M. and Wright, I. J.: Land-plant ecology on the basis of functional traits, Trends Ecol. Evol., 21, 261–268, doi:10.1016/j.tree.2006.02.004, 2006.
Woods, H. A., Makino, W., Cotner, J. B., Hobbie, S. E., Harrison, J. F., Acharya, K., and
5
Elser, J. J.: Temperature and the chemical composition of poikilothermic organisms, Funct. Ecol., 17, 237–245, doi:10.1046/j.1365-2435.2003.00724.x, 2003.
Wright, I. J., Reich, P. B., and Westoby, M.: Least-cost input mixtures of water and nitrogen for photosynthesis, Am. Nat., 161, 98–111, doi:10.1086/344920, 2003.
Wright, I. J., Reich, P. B., Westoby, M., Ackerly, D. D., Baruch, Z., Bongers, F.,
Cavender-10
Bares, J., Chapin, T., Cornelissen, J. H. C., Diemer, M., Flexas, J., Garnier, E., Groom, P. K., Gulias, J., Hikosaka, K., Lamont, B. B., Lee, T., Lee, W., Lusk, C., Midgley, J. J., Navas, M.-L., Niinemets, U., Oleksyn, J., Osada, N., Poorter, H., Poot, P., Prior, M.-L., Pyankov, V. I., Roumet, C., Thomas, S. C., Tjoelker, M. G., Veneklaas, E. J., and Villar, R.: The worldwide leaf economics spectrum, Nature, 428, 821–827, doi:10.1038/nature02403, 2004.
15
Yang, X., Tang, Z., Ji, C., Liu, H., Ma, W., Mohhamot, A., Shi, Z., Sun, W., Wang, T., Wang, X., Wu, X., Yu, S., Yue, M., and Zheng, C.: Scaling of nitrogen and phosphorus across plant or-gans in shrubland biomes across northern China, Sci. Rep., 4, 5448, doi:10.1038/srep05448, 2014.
Zhang, C., Tian, H., Liu, J., Wang, S., Liu, M., Pan, S., and Shi, X.: Pools and distributions of
20
BGD
12, 18973–18998, 2015
Variations of leaf N, P concentrations in shrubland biomes
X. Yang et al.
Title Page
Abstract Introduction
Conclusions References
Tables Figures
◭ ◮
◭ ◮
Back Close
Full Screen / Esc
Printer-friendly Version Interactive Discussion
Discussion
P
a
per
|
Discussion
P
a
per
|
Discussion
P
a
per
|
Discussion
P
a
per
|
Table 1.Arithmetic mean, range and phylogenetic signal (K value) of leaf N and P
concentra-tions and environmental variables for shrubs in northern China.
Mean (SD) Range K Mean (SD) Range K
Leaf N (mg g−1
) 21.91 (6.84) 4.26–46.80 0.31a MAT (◦C) 7.18 (3.42)
−4.05–15.98 0.26a Leaf N (mg g−1
) non-legumes
20.95 (6.47) 4.26–45.81 0.30a AP (mm) 478.79 (215.51) 15–974 0.53a
Leaf P (mg g−1
) 1.30 (0.53) 0.16–4.80 0.24b STN (mg g−1
) 1.84 (1.67) 0.05–18.03 0.23NS
Leaf N : P 18.69 (8.40) 4.07–145.76 0.24a STP (mg g−1
) 0.56 (0.32) 0.12–3.20 0.17NS
Abbreviations: MAT, mean annual temperature. AP, annual precipitation.
STN, soil total nitrogen. STP, soil total phosphorus.
a
p <0.001.
bp <0.01.
NS
BGD
12, 18973–18998, 2015
Variations of leaf N, P concentrations in shrubland biomes
X. Yang et al.
Title Page
Abstract Introduction
Conclusions References
Tables Figures
◭ ◮
◭ ◮
Back Close
Full Screen / Esc
Printer-friendly Version Interactive Discussion
Discussion
P
a
per
|
Discussion
P
a
per
|
Discussion
P
a
per
|
Discussion
P
a
per
|
Table 2.Summary of main-effect general linear models for leaf N (a), P (b) concentrations and
N : P (c) of shrubs in northern China.
Interspecific variation Intraspecific variation Total variation
F SS F SS F SS SS%
(a) MAT 0.01 0.2NS 0.07 1.0NS 0.01 0.3NS <0.01
AP 47.67 932.1a 0.79 10.8NS 21.71 742.9a 5.73
STN 17.62 344.6a 0.91 12.5NS 6.61 226.2c 1.74
STP 0.01 0.2NS 2.17 29.8NS 0.74 25.3NS 0.2
Residual 6844.1 4740.3 11 979
Total 8121.2 4794.4 12 973.7 7.67
(b) MAT 15.77 1.8a 9.88 1.3b 23.38 6.0a 5.69
AP 31.38 3.6a 1.45 0.2NS 20.86 5.4a 5.07
STN 2.44 0.3NS 12.07 1.5b 2.04 0.5NS 0.5
STP 0.24 0.0NS 35.65 4.6a 14.88 3.8a 3.62
Residual 40.4 43.4 90.2
Total 46.2 51 106 14.88
(c) MAT 6.73 103b 3.59 58.44 9.86 312b 1.96
AP 227.58 3487a 0.83 13.48 124.11 3927a 24.64
STN 5.42 83c 0.02 0.26 2.45 78NS 0.49
STP 0.73 11NS 12.47 203.13a 3.69 117NS 0.73
Residual 5792 5605.56 11 504
Total 9476 5879 15 938 27.82
Abbreviations: MAT, mean annual temperature. AP, annual precipitation. STN, soil total nitrogen. STP, soil total phosphorus.
a
BGD
12, 18973–18998, 2015
Variations of leaf N, P concentrations in shrubland biomes
X. Yang et al.
Title Page
Abstract Introduction
Conclusions References
Tables Figures
◭ ◮
◭ ◮
Back Close
Full Screen / Esc
Printer-friendly Version Interactive Discussion
Discussion
P
a
per
|
Discussion
P
a
per
|
Discussion
P
a
per
|
Discussion
P
a
per
|
BGD
12, 18973–18998, 2015
Variations of leaf N, P concentrations in shrubland biomes
X. Yang et al.
Title Page Abstract Introduction Conclusions References Tables Figures ◭ ◮ ◭ ◮ Back Close
Full Screen / Esc
Printer-friendly Version Interactive Discussion Discussion P a per | Discussion P a per | Discussion P a per | Discussion P a per |
−5 0 5 10 15
0.6 1.0 1.4 1.8 R
2
<0.01 p=0.227 (a)
0 200 400 600 800 R2
=0.1 p<0.001 (b)
−1.0 0.0 1.0
R2
=0.09 p<0.001 (c)
−0.5 0.0 0.5 1.0
−5 0 5 10 15
R2
=0.03 p<0.001 (d)
200 400 600 800 R2
=0.03 p<0.001 (e)
−0.8 −0.4 0.0 0.4 R2
=0.01 p<0.001 (f)
MAT (oC) AP (mm) log STN (mg g-1)
lo g l e a f P co n ce n tra ti o n (mg g -1) lo g l e a f N co n ce n tra ti o n (mg g -1)
MAT (oC) AP (mm) log STP (mg g-1)
Temperate shrublands Subalpine shrublands Dessert shrublands
−5 0 5 10 15
0.6 1.0 1.4
1.8 R
2
<0.01 p=0.664 (a)
0 200 400 600 800 R2
=0.06 p<0.001 (b)
−1.0 0.0 1.0 R2
=0.08 p<0.001 (c)
−0.5 0.0 0.5 1.0
−5 0 5 10 15
R2
=0.04 p<0.001 (d)
200 400 600 800 R2
=0.06 p<0.001 (e)
−0.8 −0.4 0.0 0.4 R2
=0.02 p<0.01 (f)
MAT (oC) AP (mm) log STN (mg g-1)
lo g l e a f P co n ce n tra ti o n (mg g -1) lo g l e a f N co n ce n tra ti o n (mg g -1)
MAT (oC) AP (mm) log STP (mg g-1)
(g) (h) (i)
(j) (k) (l)
Figure 2.Individual(a–f)and community level(g–l)changes of logarithm transferred leaf
nitro-gen and phosphorus concentrations in relation to climate (mean annual temperature and annual precipitation, MAT and AP) and soil nutrient (soil total nitrogen and phosphorus concentrations, STN and STP) for shrubs in northern China. Solid lines represent regressions significant at
BGD
12, 18973–18998, 2015
Variations of leaf N, P concentrations in shrubland biomes
X. Yang et al.
Title Page
Abstract Introduction
Conclusions References
Tables Figures
◭ ◮
◭ ◮
Back Close
Full Screen / Esc
Printer-friendly Version Interactive Discussion
Discussion
P
a
per
|
Discussion
P
a
per
|
Discussion
P
a
per
|
Discussion
P
a
per
|
0.5 1.0 1.5 2.0
R2=0.04 p<0.001
(a) R2=0.18 p<0.001
(b) R2=0.07 p<0.001
(c) R2=0.06 p<0.001 (d)
0.5 1.0 1.5 2.0
−5 0 5 10 15
R2=0.04 p<0.001 (e)
200 400 600 800 R2=0.19 p<0.001
(f)
−1.0−0.5 0.0 0.50.5 1.0 R2=0.07 p<0.001
(g)
−0.8 −0.4 0.0 0.4 R2=0.06 p<0.001
(h)
log STN (mg g-1)
MAT (oC) AP (mm) log STN (mg g-1)
log leaf N:P
log leaf N:P
Temperate shrublands Subalpine shrublands Dessert shrublands
Figure 3.Individual(a–d)and community level(e–h)changes of logarithm transferred leaf N : P
ratio in relation to climate (mean annual temperature and annual precipitation, MAT and AP) and soil nutrition (soil total nitrogen and phosphorus concentrations, STN and STP) for shrubs in northern China. Grey solid dots, black open circles and black solid dots represent samples from temperate, subalpine, and dessert shrublands, respectively. Solid lines represent regressions
BGD
12, 18973–18998, 2015
Variations of leaf N, P concentrations in shrubland biomes
X. Yang et al.
Title Page
Abstract Introduction
Conclusions References
Tables Figures
◭ ◮
◭ ◮
Back Close
Full Screen / Esc
Printer-friendly Version Interactive Discussion
Discussion
P
a
per
|
Discussion
P
a
per
|
Discussion
P
a
per
|
Discussion
P
a
per
|
0 2 4 6 8 STP
STN AP MAT
% explained
0 1 2 3 4 5 6 STP
STN AP MAT
% explained
0 5 10 15 20 25
STP STN AP MAT
% explained
(a) (b) (c)
Interspecific variation Intraspecific variation Total variation
Figure 4.Decomposition of total variation in leaf N (a), P (b) and N : P (c) concentrations of