www.jped.com.br
ORIGINAL
ARTICLE
Prevalence
and
factors
associated
with
stunting
and
excess
weight
in
children
aged
0-5
years
from
the
Brazilian
semi-arid
region
夽
Clariana
V.
Ramos
∗,
Samuel
C.
Dumith,
Juraci
A.
César
UniversidadeFederaldoRioGrande(FURG),RioGrande,RS,Brazil
Received17February2014;accepted2July2014 Availableonline6November2014
KEYWORDS
Child;
Bodyweightsand measures; Height;
Anthropometry; Prevalence;
Nutritionaltransition
Abstract
Objective: Toanalyzetheprevalenceofexcessweightandlowheight,andidentifyassociated
factorsamongchildrenyoungerthanfiveyears.
Methods: Cross-censusstudy.Atotalof1,640childrenfromtwomunicipalitiesinPiauí,Brazil
wereincluded.
Results: Theprevalenceoflowheightwas10.9%(95%CI:9.3to12.4),inverselyassociatedwith
mother’syoungerageandlowlevelofeducation,lowersocioeconomicstatus,motherswhohad fewerthansixprenatalconsultations,andhouseholds thathadmorethanonechildyounger than5years.Excessweightprevalencewas19.1%(95%CI:17.2to21.0),andremainedinversely associatedwithlowermaternalage,lowmaternaleducation,andcesareandelivery.Stunting wasgreaterinchildrenagedbetween12and23months,whileexcessweightdecreasedwith age.
Conclusions: Itisnoteworthythatthestuntingrate,althoughdecreasing,isstillhigh,while
theprevalenceofexcessweight,eveninthisverypoorarea,already exceedstheexpected percentageforapopulationwithbettersocioeconomiclevel.
©2014SociedadeBrasileiradePediatria.PublishedbyElsevierEditoraLtda.Allrightsreserved.
PALAVRAS-CHAVE
Crianc¸a; Pesoemedidas corporais;
Prevalênciaefatoresassociadosaodéficitdealturaeexcessodepesoemcrianc¸as de0a5anosdosemiárido
Resumo
Objetivo: Analisar aprevalênciadeexcessodepesoedéficit dealturaeidentificarfatores
associadosentremenoresdecincoanos.
夽
Pleasecitethisarticleas:RamosCV,DumithSC,CésarJA.Prevalenceandfactorsassociatedwithstuntingandexcessweightinchildren aged0-5yearsfromtheBraziliansemi-aridregion.JPediatr(RioJ).2015;91:175---82.
∗Correspondingauthor.
E-mail:[email protected](C.V.Ramos).
http://dx.doi.org/10.1016/j.jped.2014.07.005
Estatura; Antropometria; Prevalência;
Transic¸ãonutricional
Métodos: Estudocensitáriotransversal.Foramincluídas1.640crianc¸asdedoismunicípiosdo
Piauí,Brasil.
Resultados: Aprevalênciadedéficitdealturafoi10,9%(IC95%:9,3---12,4),inversamente
asso-ciadocommenoridadeeescolaridadematerna,menorcondic¸ãosocioeconômica,asmãesque realizarammenosde6consultaspré-natalesenessascasashaviammaisdeumacrianc¸amenor decincoanos.Oexcessodepesoteveprevalênciade19,1%(IC95%:17,2---21,0),emanteve-se inversamenteassociadocommenoridadedamãe,baixaescolaridadematernaepartocesáreo. Odéficitdealturafoimaiorparacrianc¸asentre12e23meses,enquantooexcessodepeso diminuiucomaidade.
Conclusões: Destaca-sequeodéficitdealtura,emboraestejadiminuindo,aindaéelevado,
enquanto a prevalência de excesso de peso, mesmo nesta área muito pobre, já supera o percentualesperadoparaumapopulac¸ãocommelhorescondic¸õessocioeconômicas.
©2014SociedadeBrasileiradePediatria.PublicadoporElsevierEditoraLtda.Todososdireitos reservados.
Introduction
Brazil is still experiencing a nutritional transition phase, characterizedbymarkedreductionintheprevalenceof mal-nutritionandincreasedfrequencyofoverweight.However, therehavebeenveryfewstudiesinBrazil1thathave inves-tigatedstuntingandoverweightinthesamepopulationof childrenyounger than 5years. It isnoteworthy that both deficitsandexcessaredetrimentaltohealth,causingboth physicalandcognitivedamagetochilddevelopment. Inad-equatechild developmentaffectslearning andmakesthe childmorevulnerabletoseveraldiseases,particularlythe cardiovascularandmetabolic.1
Anthropometric monitoring is necessary, asearly iden-tification of both stunting and excess weight allow interventionstobeconductedinordertopreventchanges throughout life and enablefull development in childhood andinthenextphasesofthelifecycle.2
DatafromtheNationalDemographicandHealthSurvey showthatbetween1996and2006therewasadecreasein theprevalenceofstuntingforagefrom13.4%to6.7%,while the weightdeficit for age decreased from4.2% to 1.8%.3 Inthissameperiod,therewasadecreaseinweightdeficit forheight,from2.2% in1996 to1.5% in2006, andvirtual stability in the prevalence of excess for this indicator of approximately7% in the two years (2004-2006).3 In sum-mary,inthecomparisonofthetimeperiodevaluated,there wassubstantialreductionintheriskofchildmalnutritionin Brazil,withnoevidenceoftemporalvariationintheriskof obesity.3
The Household Budget Survey for the year 2008-2009 in children younger than 5 years showed the Northeast region as the region with the second highest weight for agedeficit(5.9%)inthecountry,secondonlytotheNorth region(8.5%).4Regardingtheprevalenceofexcessweight, itrangedfrom25%to30%intheNorthandNortheastregions (morethanfivetimestheprevalenceofweightdeficit),and from32%to40%inSoutheast,South,andMidwest(morethan tentimestheprevalenceofweightdeficit).Excessweight tendedto bemore frequent inurban than in ruralareas, particularlyintheNorth,Northeast,andMidwestregions.4
Consideringtheenvironmentalaspectsidentifiedasthe most important factors that contribute tothe nutritional aspect,especiallyamongchildrenandadolescents,theneed
tocarryoutregionalizedpopulation-basedstudiestodiscuss thespecificcharacteristicsandcontextofthenutrition tran-sitionthatBrazilisexperiencingisemphasized.5Thus,the aimof thisstudywastoanalyzetheprevalenceof excess weightand stunting,and toidentifyassociated factors in childrenyoungerthan5years.
Methods
Thisiswascensus-based,cross-sectionalstudy,whichispart of a project entitled ‘‘Health of Childrenyounger than 5 YearsandAdolescentsResidingintheMunicipalitiesof Cara-colandAnísiodeAbreu,PI’’.ThetownsofCaracolandAnísio deAbreuarelocatedinthesoutheastofthestateofPiauí. Piauí isconsidered one ofthe poorest statesin Brazil.Its economyiscenteredonagriculture,andthehuman devel-opmentindex(HDI)is0.7.6,7
Participantsthatwereeligibleforthestudyincludedall children aged0to59 months,residing in urban andrural areasofthesetownsbetweenJulyandSeptemberof2008. Due to the need to identify associated factors, sam-ple size was calculated a posteori, as this research was not initially designed for this purpose. The prevalence of excessweightusewas30%(>+1Z-scoresforweight/height indicator)andtheremainingparametersusedwereas fol-lows: alpha error of 0.05, beta error of 0.20, exposures rangingfrom20%to80%,outcomefrequencyamongthe non-exposedofatleast13%,andhazardratioof1.7.Thus,the studywouldrequireasampleofatleast1,293children.This figurealreadyincludes5%forlossesand15%forthecontrol ofpotentialconfounders.
For datacollection, 14 students whohad finishedhigh school or were undergraduate students in the humanities at UniversidadeEstadualdoPiauí (UESPI), CampusdeSão RaimundoNonatowerepre-selected.These studentswere trained for five consecutive days, eight hours per day. The training consisted of reading the questionnaire and instructionmanual,simulatedinterviews,and standardiza-tionof anthropometrictechniques. Afterthis stage,eight were selected and hired to perform the interviews. Two graduatesin social sciences,withextensiveexperiencein thistypeofstudy,werepreviouslyassignedassupervisors. The pilotstudywascarriedoutin themunicipalityof São Raimundo Nonato,located in the same regionasthe two townsincludedinthestudy.
Two teams consisting of a supervisor and four inter-viewerswerecreated.Eachteamwasresponsiblefordata collection in one of these municipalities. The first step wasto mapand number the street blocksin urban areas and villages in the rural area. Each pair of interviewers went through all households, clockwise, looking for chil-drenyoungerthan5years.Whenahouseholdhadchildren inthisagegroup,thequestionnaireswerethen appliedto thechild’smotherorguardian.
Thesequestionnaireswerecodedbyinterviewersatthe endofeachday,andonthefollowingday,theywerehanded totheirrespectivesupervisors,whosentthemtotheproject headquarters.Eachofthesequestionnaireswasrevisedand typed in duplicateinreverse order, bytwofellows. After enteringeachblockof100questionnaires,databaseswere comparedand if necessary,corrected. The softwareused for datatabulation wasEpi-Info6.04 (Centersfor Disease ControlandPrevention(CDC),GA,USA).8
The dependent variables were stunting and excess weight.Lowheightforage(Z-score<-2),whetherthelength inthecaseofchildrenyoungerthan2years(measuredwith the subject lyingdown) or height for children 2 years or older (measured with the individual standing) was evalu-atedaccording torecommendedmethodsandrecordedin centimeters.Thechild’sagewascalculatedinmonthsand overweightasBMIforageZ-score>1.9
The independent variables were: Municipality(Caracol and Anísiode Abreu), area (rural or urban), whether the motherhadapartner(yesorno),mother’slevelofschooling (0-4years,5-8years,or9ormoreyears),whethertherewas morethanonechildyoungerthan5yearsinthehousehold (yesor no), whetherthemotherhadsixor moreprenatal consultations(yesorno), typeofdelivery(normalor cae-sarean),exclusivebreastfeeding(<1month,1-3monthsand 29days,or≥4months),whetherthechildhada consulta-tioninthelast3months(yes orno), andconsumergoods index(createdbasedontheanalysisofthemaincomponents of seven characteristics of the household and ownership ofhouseholdgoods,4andsubsequentlydividedintotertiles fromlowesttohighest).
The data analysiswasconducted usingStata software, release 11.1. Poisson regression with robust adjustment of variance was used for unadjusted and adjusted anal-yses. A p-value of 5% was used as the significance level for two-tailed tests. The hierarchical model, created for themultivariateanalysis,wasconstructedusing sociodemo-graphicfactors(includingmunicipality,area,mother’sage, mother’s andchild’s ethnicity,whether the motherhad a
partner,mother’slevelofschooling,socioeconomicstatus, numberofchildrenyoungerthan5yearsofageinthe house-hold)inthefirstlevel, whereasthe secondlevel included thecarereceivedduringpregnancyandchildbirth (prena-tal,childbirth, andchild height),the third level included the pattern of breastfeeding and diet (breastfeeding and durationof breastfeeding), and the fourth level included theuse of health services (consultation in the past three monthswithaphysicianand/ornurse).
ThestudywasapprovedbytheEthicsandResearch Com-mitteeof UniversidadeFederaldePelotas (ResolutionNo. 001/08), in accordance with the current regulations for human research, and the questionnaire was applied only aftertheinformedconsenthadbeenexplainedtoandsigned bytheinterviewee.
Results
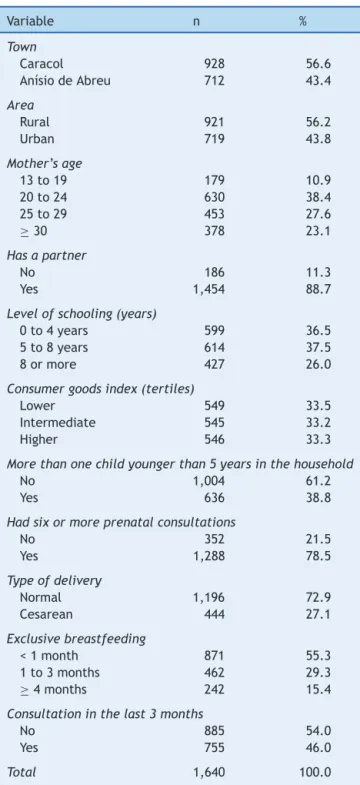
Atotalof1,640childrenyoungerthan5yearsofagefrom thetwomunicipalitieswere includedin thestudy.Ofthis total,informationwasobtainedfromapproximately99%of theminCaracoland97%inAnísioAbreu.Theoverallrateof non-responderswas4.0%(65/1,640).
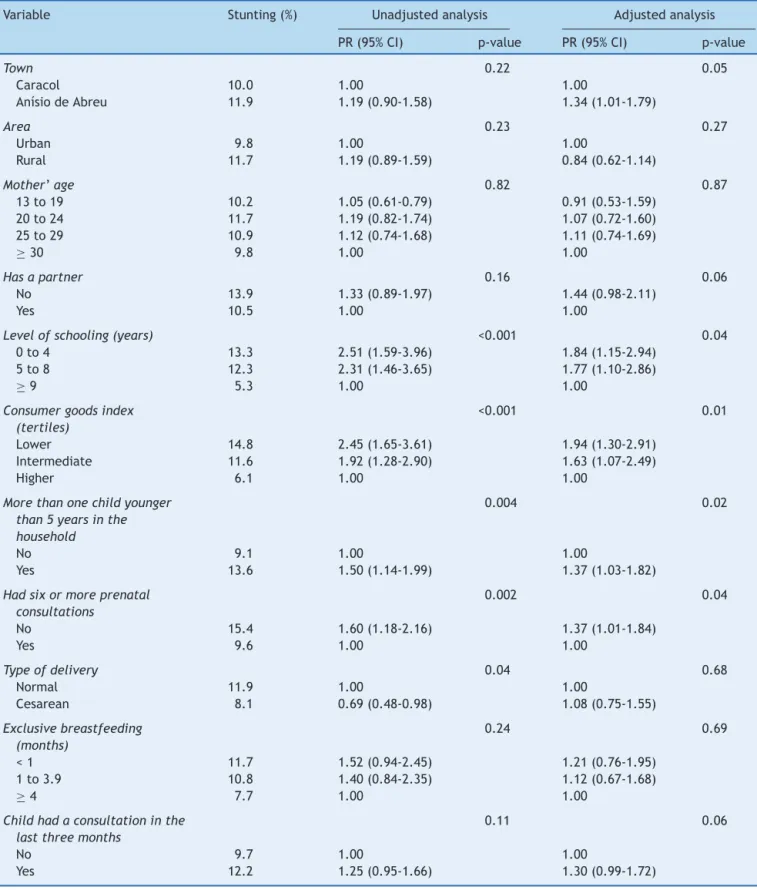
Table1showsthesampledescription.Childrenwholived inCaracolhadahigherprevalence(56.6%),theirmothers’ meanage was26.2years(SD=7.3),andlevelofschooling was0-4years(36.5%).Householdswithmorethanonechild youngerthan5yearsshowedaprevalenceof38.8%. Regard-ingpregnancy,78.5%ofthemothershadsixormoreprenatal consultations,72.9%hadthelastchildvaginally,and55.3% ofthemexclusivelybreastfedtheirchildrenforlessthanone month.Inthelastthreemonths,(46.0%)ofthesemothers hadtakenthechildtoaconsultationwithadoctorornurse. The prevalence of stunting was 10.9% (95% CI: 9.3 to 12.4).Thisprevalencewashigherforchildrenwhose moth-ershad0-4yearsofschooling,13.3%(95%CI1.59to3.96); werepoorer, 14.8% (95% CI1.65 to 3.61); hadmore than onechildyoungerthan5yearsathome,13.6%(95%CI1.14 to1.99);andinthegroupwithalowernumberofprenatal consultations(< 6),15.4% (95%CI1.18 to2.16)(Table2). In the adjusted analysis, the mother’s level of schooling, consumergoodsindex,andnumberofprenatalconsultations remainedinverselyassociatedwithstunting.Thenumberof childrenyoungerthan5inthehouseholdalsowere demon-stratedtobeinverselyassociatedwithstunting.
Cesareandelivery,whichwasaprotectivefactor,lostits association,andthemunicipalityofAnísioAbreustartedto showahigher prevalencewhen adjusted for demographic andsocioeconomicvariables.Childrenthathada consulta-tioninthelastthreemonthshad aborderline association withstunting(p=0.06). This outcome occurred more fre-quentlyinchildrenbetween1and2yearsofage,andwas lowerinthoseyoungerthan1year.
Table 1 Sample description according to the analyzed characteristics(Piauí,Brazil,2010).
Variable n %
Town
Caracol 928 56.6
AnísiodeAbreu 712 43.4
Area
Rural 921 56.2
Urban 719 43.8
Mother’sage
13to19 179 10.9
20to24 630 38.4
25to29 453 27.6
≥30 378 23.1
Hasapartner
No 186 11.3
Yes 1,454 88.7
Levelofschooling(years)
0to4years 599 36.5
5to8years 614 37.5
8ormore 427 26.0
Consumergoodsindex(tertiles)
Lower 549 33.5
Intermediate 545 33.2
Higher 546 33.3
Morethanonechildyoungerthan5yearsinthehousehold
No 1,004 61.2
Yes 636 38.8
Hadsixormoreprenatalconsultations
No 352 21.5
Yes 1,288 78.5
Typeofdelivery
Normal 1,196 72.9
Cesarean 444 27.1
Exclusivebreastfeeding
<1month 871 55.3
1to3months 462 29.3
≥4months 242 15.4
Consultationinthelast3months
No 885 54.0
Yes 755 46.0
Total 1,640 100.0
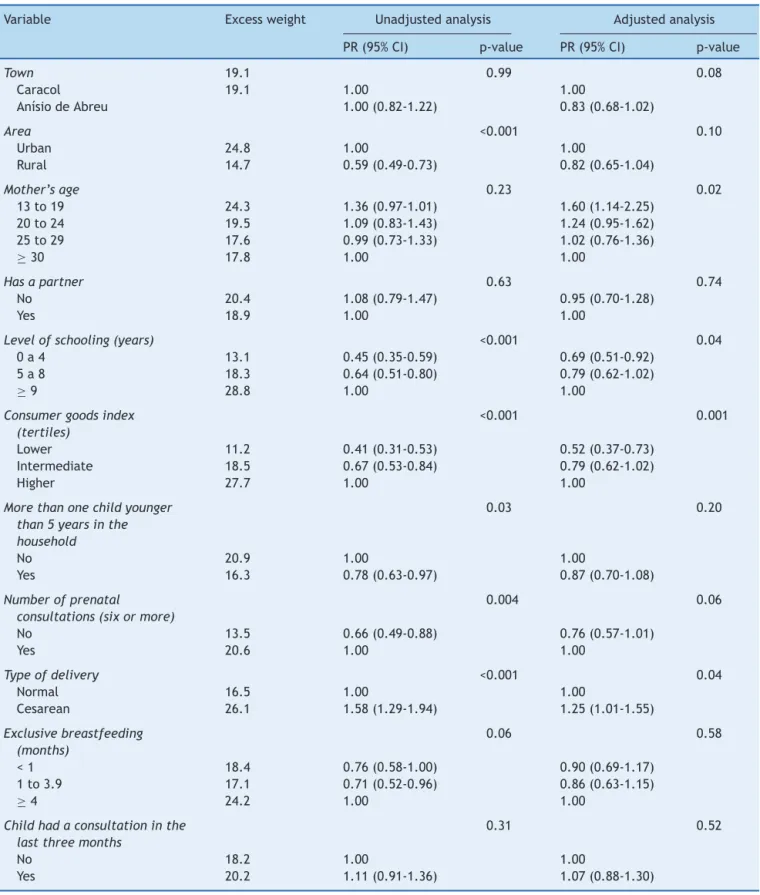
analysis,andcesareandeliveryhadanegativeassociation, 26.1%(95%CI:1.29to1.94;Table3).Intheadjusted analy-sis,areaofresidence,ethnicity,numberofchildrenyounger than5years,andprenatalconsultationslosttheassociation. Higherlevelofschooling,higherconsumergoodsindex,and cesareansectionremainedassociatedwithexcessweight.
Discussion
This study showed high prevalence of excess weight and stunting.Importantassociationsasriskfactorwerefound,
highlightingstuntingwiththemother’slowlevelof school-ing,lowincome,lowersocioeconomicstatus,andlessthan sixprenatalconsultations.Inrelationtoexcessweight, ado-lescentmotherandcesareansectionwereassociatedasrisk factors,whereaslowmaternaleducationandsocioeconomic levelwereassociatedasprotectivefactors.
Thestudyshowedresultsthatdemonstratedsome speci-ficity,astheywereobtainedfromahomogeneoussampleof individuals oflow socioeconomiclevel, livingin the semi-aridregionofthestateofPiauí,Brazil,whichisoneofthe stateswiththeworstsocialconditions.
The declinein malnutritionis alreadyoccurring in this region. The deficit in weight for age was less than 3% (datanotshown),which demonstratesthatthevaluesare withinthenormalrange,characterizingachangeinthe epi-demiologicalprofileassociatedwiththenutritiontransition, wherethenutritionaldeficitproblemisreplacedbyexcess weight.5
As positive points, this study includes a seldom stud-iedandunderprivilegedpopulationduetoitsgeographical location,farfromthestate capital anddifficulttoreach. Therehavebeenfewstudiesthatassessedanthropometric extremesand,inthissample,childrenintwoextremeswere analyzed:stuntingandexcessweight,indicatingastageof nutritionaltransition.
Asalimitation,duetothecross-sectionaldesignofthe study,the phenomenonof reverse causalityin some asso-ciations cannot be dismissed, such as breastfeeding and consultationinthepastthreemonths.
Theprevalence ofstuntingfound was10.9%, similarto the study of Saldiva et al.,10 conducted in the semiarid regionofthenortheastofRioGrandedoNorte,witha preva-lenceof9.9%.Thetwoportraysocioeconomicinequalities andlackofaccesstobasichealthcareandsocialassistance, andmaketheseareaspriorityregionsforeffortsdirectedat thenormalizationofthesechildhooddeficits.Theunassisted childrenfromtheseregionsbecomevulnerableto interrup-tionand/or delay in their full development,aspersistent nutritionaldeficienciesinchildhoodimpairweightinitially andthenslowgrowth,finallyaffectingheight.11
An association was found between stunting and low maternal education. In the state of Pernambuco, the prevalenceofstuntingwas8.7%in2006,whichwasalso asso-ciatedwithlowermaternaleducation.11Maternaleducation has been identified as a factor associated withchildhood growth.12,13InthestudybyMenezesetal.,itwasidentified thatchildrenofmotherswithlessthanfouryearsofstudy havetwicethechanceofhavingstuntedgrowth.14
Thewaymothersdevotetheirattentiontotheirchildren, bothdirectlyandthroughcaregivers,aswellastheiraccess tohealthservices,areinfluencedbythelevelofschooling. Amotherwithhigherlevelofschoolingprovidesbettercare toherchildrenduetoincreasedknowledge,andinformation andaccesstohealthcareservicesareinfluencedbythelevel ofschooling.15
Table2 Unadjustedandadjustedanalysisofstuntingwiththeothervariables(Piauí,Brazil,2010).
Variable Stunting(%) Unadjustedanalysis Adjustedanalysis
PR(95%CI) p-value PR(95%CI) p-value
Town 0.22 0.05
Caracol 10.0 1.00 1.00
AnísiodeAbreu 11.9 1.19(0.90-1.58) 1.34(1.01-1.79)
Area 0.23 0.27
Urban 9.8 1.00 1.00
Rural 11.7 1.19(0.89-1.59) 0.84(0.62-1.14)
Mother’age 0.82 0.87
13to19 10.2 1.05(0.61-0.79) 0.91(0.53-1.59) 20to24 11.7 1.19(0.82-1.74) 1.07(0.72-1.60) 25to29 10.9 1.12(0.74-1.68) 1.11(0.74-1.69)
≥30 9.8 1.00 1.00
Hasapartner 0.16 0.06
No 13.9 1.33(0.89-1.97) 1.44(0.98-2.11)
Yes 10.5 1.00 1.00
Levelofschooling(years) <0.001 0.04
0to4 13.3 2.51(1.59-3.96) 1.84(1.15-2.94) 5to8 12.3 2.31(1.46-3.65) 1.77(1.10-2.86)
≥9 5.3 1.00 1.00
Consumergoodsindex
(tertiles)
<0.001 0.01
Lower 14.8 2.45(1.65-3.61) 1.94(1.30-2.91)
Intermediate 11.6 1.92(1.28-2.90) 1.63(1.07-2.49)
Higher 6.1 1.00 1.00
Morethanonechildyounger
than5yearsinthe
household
0.004 0.02
No 9.1 1.00 1.00
Yes 13.6 1.50(1.14-1.99) 1.37(1.03-1.82)
Hadsixormoreprenatal
consultations
0.002 0.04
No 15.4 1.60(1.18-2.16) 1.37(1.01-1.84)
Yes 9.6 1.00 1.00
Typeofdelivery 0.04 0.68
Normal 11.9 1.00 1.00
Cesarean 8.1 0.69(0.48-0.98) 1.08(0.75-1.55)
Exclusivebreastfeeding
(months)
0.24 0.69
<1 11.7 1.52(0.94-2.45) 1.21(0.76-1.95) 1to3.9 10.8 1.40(0.84-2.35) 1.12(0.67-1.68)
≥4 7.7 1.00 1.00
Childhadaconsultationinthe
lastthreemonths
0.11 0.06
No 9.7 1.00 1.00
Yes 12.2 1.25(0.95-1.66) 1.30(0.99-1.72)
PR,prevalenceratio.
poor,whencomparedtochildrenwithhighersocioeconomic status.
Stuntingwasmoreprevalentwhentherewasmorethan one child younger than 5 years living in the same house-hold (13.6% versus9.1%), which can be attributedtolow
Table3 Unadjustedandadjustedanalysisofexcessweightwiththeothervariables(Piauí,Brazil,2010).
Variable Excessweight Unadjustedanalysis Adjustedanalysis
PR(95%CI) p-value PR(95%CI) p-value
Town 19.1 0.99 0.08
Caracol 19.1 1.00 1.00
AnísiodeAbreu 1.00(0.82-1.22) 0.83(0.68-1.02)
Area <0.001 0.10
Urban 24.8 1.00 1.00
Rural 14.7 0.59(0.49-0.73) 0.82(0.65-1.04)
Mother’sage 0.23 0.02
13to19 24.3 1.36(0.97-1.01) 1.60(1.14-2.25) 20to24 19.5 1.09(0.83-1.43) 1.24(0.95-1.62) 25to29 17.6 0.99(0.73-1.33) 1.02(0.76-1.36)
≥30 17.8 1.00 1.00
Hasapartner 0.63 0.74
No 20.4 1.08(0.79-1.47) 0.95(0.70-1.28)
Yes 18.9 1.00 1.00
Levelofschooling(years) <0.001 0.04
0a4 13.1 0.45(0.35-0.59) 0.69(0.51-0.92)
5a8 18.3 0.64(0.51-0.80) 0.79(0.62-1.02)
≥9 28.8 1.00 1.00
Consumergoodsindex
(tertiles)
<0.001 0.001
Lower 11.2 0.41(0.31-0.53) 0.52(0.37-0.73)
Intermediate 18.5 0.67(0.53-0.84) 0.79(0.62-1.02)
Higher 27.7 1.00 1.00
Morethanonechildyounger
than5yearsinthe
household
0.03 0.20
No 20.9 1.00 1.00
Yes 16.3 0.78(0.63-0.97) 0.87(0.70-1.08)
Numberofprenatal
consultations(sixormore)
0.004 0.06
No 13.5 0.66(0.49-0.88) 0.76(0.57-1.01)
Yes 20.6 1.00 1.00
Typeofdelivery <0.001 0.04
Normal 16.5 1.00 1.00
Cesarean 26.1 1.58(1.29-1.94) 1.25(1.01-1.55)
Exclusivebreastfeeding
(months)
0.06 0.58
<1 18.4 0.76(0.58-1.00) 0.90(0.69-1.17) 1to3.9 17.1 0.71(0.52-0.96) 0.86(0.63-1.15)
≥4 24.2 1.00 1.00
Childhadaconsultationinthe
lastthreemonths
0.31 0.52
No 18.2 1.00 1.00
Yes 20.2 1.11(0.91-1.36) 1.07(0.88-1.30)
PR,prevalenceratio.
Another important association was that between
fewer prenatal care consultations of the mother and
child stunting. This can occur due to the importance ofpregnancyonchilddevelopment.Newevidencefurther
for gestational age annually, which represents 27% of all birthsindevelopingcountries.1 Thesedataemphasize the importanceofprenatalcareformaternalandchildhealth.
The prevalence of excessweightwas19.1%. Thereare studiesassociatingchildhoodobesitytoseveralunfavorable outcomes in adulthood, especially asthma, hypertension, diabetes,coronaryheartdisease,andsometypesofcancer, e.g.,colorectalandkidneyneoplasms.15---17
Thehighestprevalenceofexcessweightwasintheurban areas (24.8% versus14.7% in rural areas); theunadjusted analysis showed that living in rural areas was a protec-tive factor, but this association was lost in the adjusted analysis.Traditionally,individualslivinginthecountryside, especiallyinruralareas,aremoresusceptibletonutritional deficits, particularly children. However, in recent years, withtheaccelerated rateofdecreasein malnutritionand increase in obesity, this evidence has diminished,11 as it occurred in the present study after the adjusted analy-sis.
Adolescent mothers (13-19 years) were more likely to have children withexcess weight,andlow maternal edu-cationwasaprotectivefactorforthisexcess.Studieshave shownthatmaternalageatchildbirth≤20yearsisa deter-minantofexcessweight.1,17Itisemphasizedthatthemother isthelinkbetweenthechildandtheenvironmenttheylive in. Ifthe motheris herselfat an age ofconflicts, discov-eries,andtransformationsthatoccurinadolescence,these factorscouldalsoreflectonthedietandhealthofherchild. There was a direct association between excess weight andeconomicstatus.Itisassumedthatchildrenwithbetter socioeconomicstatus havegreater accesstocertain high-caloriefoodsandsometimes,moreexpensiveones,aswell asgreaterdiversityoffoodintheirhomes.Thiscould stim-ulateweightgaininthisgroup.
It was also verified that mothers who had a cesarean delivery had an approximately 60% higher chance in the unadjusted and 25% in the adjusted analysis of having children withexcess weight. A similarresult wasverified in a study by Xavier et al.,18 in which among the obese groupofchildren,66.7%reportedbirthbycesareansection, andamongthosewithoverweight,55.6%reportedbirthby cesareansection.
Consideringthedatafromthisstudy,itcanbeconcluded that the changes in the country over the years, such as the creation of the family allowance program, the mini-mumwageincreases,improvingtheincomedistributionin someregions,andothergovernmentprograms,helpedinthe transformationof the Brazilian economy.In this scenario, itcanbeobservedthatpeoplearerisingfrompovertyand purchasingmoregoods,andimprovingtheirstatusregarding livingconditionsandfood,whichmayexplainthedecrease in the rates of Brazilian malnutrition and increased over-weight/obesityrates.
Attention should bepaid so that theeconomic growth canalsobeaccompaniedbypublicpoliciestargetinghealth education of the population and the implementation of programsthatencourage adequatenutrition.Knowing the nutritionalstatusof childreninthis regionandassociated factorswillmake it possibletodrawa planof nutritional controlandguidethesefamiliestodevelophealthierhabits. Itisnoteworthythatstunting,although decreasing,isstill high(10.9%),whiletheprevalenceofoverweight(19.1%)has
exceededthepercentageexpectedforanormalpopulation, whichwouldbeapproximately16%.
Funding
ThestudywassupportedbytheConselhoNacionalde Desen-volvimentoCientíficoeTecnológico(CNPq)andtheCityHall ofthemunicipalitiesstudied,AnísiodeAbreuandCaracol, Piauí.
Conflicts
of
interest
Theauthorsdeclarenoconflictsofinterest.
References
1.VictoraCG,AquinoEM,doCarmoLealM,MonteiroCA,Barros FC,SzwarcwaldCL.MaternalandchildhealthinBrazil:progress andchallenges.Lancet.2011;377:1863---76.
2.Araújo AC,CamposJA.Subsídiosparaa avaliac¸ãodo estado nutricionaldecrianc¸aseadolescentepormeiodeindicadores antropométricos.AlimNutr.2005;19:219---25.
3.Brasil.MinistériodaSaúde.SecretariadeCiência,Tecnologia eInsumos Estratégicos. DepartamentodeCiência e Tecnolo-gia.PesquisaNacionaldeDemografiaeSaúdedaCrianc¸aeda Mulher.Brasília:MinistériodaSaúde;2008.
4.IBGE(Fundac¸ãoInstitutoBrasileirodeGeografiaeEstatística). PesquisadeOrc¸amentosFamiliares2008-2009.Antropometriae estadonutricionaldecrianc¸as,adolescenteseadultosnoBrasil, 2010.[cited10Jan2013].Availablefrom:http://ibge.gov.br/ home/estatistica/populacao/condicaodevida/pof/20082009 encaa/pof20082009encaa.pdf
5.Conde WL,MonteiroCA.Valores críticos doíndice de massa corporalparaclassificac¸ãodoestadonutricionaldecrianc¸ase adolescentesbrasileiros.JPediatr(RioJ).2006;82:266---72. 6.IBGE Cidades. [cited 28 Ago 2013]. Available from:
http://www.ibge.gov.br/cidadesat/topwindow.htm?1
7.PNUD(ProgramadasNac¸õesUnidasparaoDesenvolvimento). Brasil.ÍndicedeDesenvolvimentoHumano---Municipal,1991e 2000---Todososmunicípiosdo Brasil.IBGE(InstitutoBrasileiro deGeografiaeEstatística).[cited06Set2012].Availablefrom: http://www.pnud.org.br/atlas/ranking/IDHM%
8.DeanAG,DeanJA,CoulombierD,BrendelKA,SmithDC, Bur-tonAH,etal.Epi-Info,Version6:awordprocessing,database, and statistics programfor epidemiology onmicrocomputers. Atlanta:CentersofDiseaseControlandPrevention;2002. 9.WHO. Multicentre Growth Reference Study Gr*oup. WHO
Child Growth Standards: length/height-for-age, weight-for-age. weight-for-length weight-for-height and body mass index-for-age:MethodsanddevelopmentGeneve:WorldHealth Organization;2006.
10.SaldivaRD,SilvaLF,SaldivaPH.Avaliac¸ãoantropométricae con-sumoalimentaremcrianc¸asmenoresdecincoanosresidentes emummunicípiodaregiãodosemiáridonordestinocom cober-tura parcialdoprograma bolsafamília.RevNutri Campinas. 2010;23:221---9.
11.YangZ,HuffmanSL.Nutritioninpregnancyandearlychildhood andassociationswithobesityindevelopingcountries.Matern ChildNutr.2013;9:105---19.
12.MonteiroCA,deFreitasIC.Evoluc¸ãodecondicionantes socioe-conômicos da saúde na infância na cidade de São Paulo (1984-1996).RevSaudePublica.2000;34:8---12.
and actual weight status of children: a systematic review. MaternChildNutr.2013;9:3---22.
14.MenezesRC,LiraPI,LealVS,OliveiraJS,SantanaSC,Sequeira LA, et al. Determinantes do déficit estatural em menores decinco anosnoEstado dePernambuco.RevSaudePublica. 2011;45:1079---87.
15.Lima AL, Silva AC,Konno SC, Conde WL,Benicio MH, Mon-teiroCA.Causasdodeclínioaceleradodadesnutric¸ãoinfantil no Nordeste do Brasil (1986-1996-2006). Rev Saude Publica. 2010;44:17---27.
16.RasmussenJohanssonM.Therelationofweight,lengthand pon-deralindexatbirthtobodymassindexandoverweightamong 18year-oldmalesinSweden.EurJEpidemiol.1998;14:373---80. 17.PadezC,MouraoI,MoreiraP,RosadoP.Groupprevalenceand riskfactorsforoverweightandobesityinPortuguesechildren. ActaPediatrica.2005;94:1550---7.