A Gamma-Knife-Enabled Mouse Model of
Cerebral Single-Hemisphere Delayed
Radiation Necrosis
Xiaoyu Jiang1¤, Liya Yuan2, John A. Engelbach3, Jeremy Cates4, Carlos J. Perez-Torres3,
Feng Gao5,6, Dinesh Thotala4,6, Robert E. Drzymala2,4, Robert E. Schmidt7, Keith M. Rich2,4, Dennis E. Hallahan4,6, Joseph J. H. Ackerman1,3,6,8, Joel R. Garbow3,6*
1Department of Chemistry, Washington University, St. Louis, Missouri, United States of America,
2Department of Neurosurgery, Washington University, St. Louis, Missouri, United States of America,
3Department of Radiology, Washington University, St. Louis, Missouri, United States of America,
4Department of Radiation Oncology, Washington University, St. Louis, Missouri, United States of America,
5Division of Biostatistics, Washington University, St. Louis, Missouri, United States of America,6Alvin J. Siteman Cancer Center, Washington University, St. Louis, Missouri, United States of America,7Department of Neuropathology, Washington University, St. Louis, Missouri, United States of America,8Department of Internal Medicine, Washington University, St. Louis, Missouri, United States of America
¤ Current address: Vanderbilt University Institute of Imaging Science, Nashville, Tennessee, United States of America
Abstract
Purpose
To develop a Gamma Knife-based mouse model of late time-to-onset, cerebral radiation necrosis (RN) with serial evaluation by magnetic resonance imaging (MRI) and histology.
Methods and Materials
Mice were irradiated with the Leksell Gamma Knife1(GK) PerfexionTM(Elekta AB; Stock-holm, Sweden) with total single-hemispheric radiation doses (TRD) of 45- to 60-Gy, deliv-ered in one to three fractions. RN was measured using T2-weighted MR images, while confirmation of tissue damage was assessed histologically by hematoxylin & eosin, tri-chrome, and PTAH staining.
Results
MRI measurements demonstrate that TRD is a more important determinant of both time-to-onset and progression of RN than fractionation. The development of RN is significantly slower in mice irradiated with 45-Gy than 50- or 60-Gy, where RN development is similar. Irradiated mouse brains demonstrate all of the pathologic features observed clinically in patients with confirmed RN. A semi-quantitative (0 to 3) histologic grading system, capturing both the extent and severity of injury, is described and illustrated. Tissue damage, as assessed by a histologic score, correlates well with total necrotic volume measured by MRI OPEN ACCESS
Citation:Jiang X, Yuan L, Engelbach JA, Cates J, Perez-Torres CJ, Gao F, et al. (2015) A Gamma-Knife-Enabled Mouse Model of Cerebral Single-Hemisphere Delayed Radiation Necrosis. PLoS ONE 10(10): e0139596. doi:10.1371/journal.pone.0139596
Editor:Roberto Amendola, ENEA, ITALY
Received:March 20, 2015
Accepted:September 14, 2015
Published:October 6, 2015
Copyright:© 2015 Jiang et al. This is an open access article distributed under the terms of the
Creative Commons Attribution License, which permits unrestricted use, distribution, and reproduction in any medium, provided the original author and source are credited.
Data Availability Statement:All relevant data are within the paper and its Supporting Information files.
Funding:This project has been supported by NIH grants R01 CA155365 (JRG), R01 CA174966 (DEH), and R01 CA140220 (DEH), and funding from the Alvin J. Siteman Comprehensive Cancer Center (P30), P30 CA091842, the Barnes-Jewish Hospital Foundation Cancer Frontier Fund, Mallinckrodt Institute of Radiology, and Elekta Instruments AB (Stockholm, Sweden).
(correlation coefficient = 0.948, with p<0.0001), and with post-irradiation time (correlation coefficient = 0.508, with p<0.0001).
Conclusions
Following GK irradiation, mice develop late time-to-onset cerebral RN histology mirroring clinical observations. MR imaging provides reliable quantification of the necrotic volume that correlates well with histologic score. This mouse model of RN will provide a platform for mechanism of action studies, the identification of imaging biomarkers of RN, and the devel-opment of clinical studies for improved mitigation and neuroprotection.
Introduction
Despite recent advances in radiation treatment planning and delivery, onset of late-delayed radiation-induced neurotoxicity (radiation necrosis, RN) remains an important clinical prob-lem characterized by debilitating clinical symptoms, a worsening quality of life, and even death. RN develops in up to 24% of patients receiving focal irradiation three or more months following therapy [1]. The incidence of RN is often higher with concurrent chemotherapy [2].
The lack of a well-developed, small-animal model of radiation necrosis has significantly hampered the development of diagnostic and therapeutic management of cerebral RN. Until recently, reports of small-animal models of radiation necrosis in brain tissue have been sparse, with most previous animal models developed in rats [3–8]. Several years ago, we described a murine model of radiation necrosis using a micro-radiotherapy (microRT) system [9]. The extent and progression of necrosis was characterized using contrast-enhanced T1- and T2-weighted MRI and the histology reflected changes typically seen in radiation necrosis in patients. Although our studies and those of others demonstrated the feasibility of generating radiation necrosis in mouse/rat brain using focal brain irradiation, they were all performed on small cohorts of animals. Determinants of the onset and progression of radiation necrosis, including radiation dose and fractionation, which are crucial for the design of studies aimed at developing methods to identify/detect, monitor, protect against, and mitigate radiation necro-sis, have not been well investigated.
Overall, the goals of this work are to develop a GK-based murine model of radiation necro-sis, to characterize the development of RN using serial MRI protocols and histologic evaluation, and to elucidate the critical determinants (i.e., radiation dose and fractionation scheme) gov-erning the onset and progression of tissue injury. The well-characterized animal model of RN described and histologically validated herein provides a platform for mechanism of action stud-ies, the identification of imaging biomarkers of RN, and the development of schemes for improved mitigation and neuro-protection.
Materials and Methods
Ethics Statement
All studies were performed in accordance with the guidelines of the Washington University Institutional Animal Care and Use Committee (Approval #20120030) with protocols that met or exceeded American Association for the Accreditation of Laboratory Animal Care standards. All irradiation and imaging experiments were performed under anesthesia, and all efforts were made to minimize suffering.
Small-Animal Irradiation
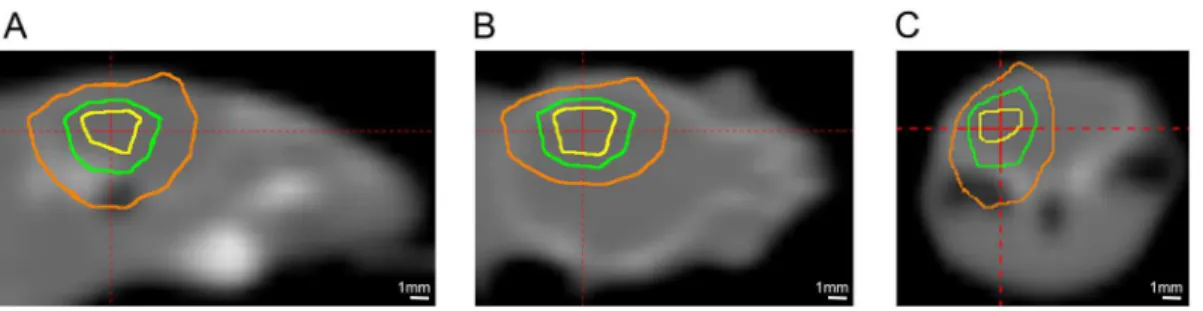
Six-to-eight week old, female Balb/c mice (Harlan; Indianapolis, IN) were used for the study and observed daily and weighed weekly to ensure that interventions were well tolerated. Mice were irradiated with the Leksell Gamma Knife1(GK) Perfexion™(Elekta AB; Stockholm, Sweden; http://www.elekta.com/). They were supported on a specially designed platform mounted to the stereotactic frame that attaches to the treatment couch of the GK. Mice were anesthetized with a mixture of ketamine (25 mg/kg), acepromazine (5 mg/kg) and xylazine (5 mg/kg), injected intra-peritoneally 5 min before the start of irradiation.Fig 1shows Gamma Knife radiation isodose contours modeled using the GammaPlan1treatment planning system and superimposed on the CT image of a mouse on the platform. The isodoses result from an irradiation using the 4 mm collimator aperture of the GK with all 192 sources focused on a single stereotactic position, whose location depends on the position of the mouse on the platform. This dose distribution illustrates that radiation is effectively concentrated to a single hemisphere of the mouse brain, and is greatly reduced in other radiation-sensitive anatomy, including the eyes or esophagus.
The immediate goal of this study was to devise an irradiation scheme that would provide an
“experimentally tractable”(i.e., experimentally convenient) mouse model of late-onset RN. It was important that the irradiation scheme limit primary injury to the single ipsilateral hemi-sphere, that gold-standard histological measures of injury remain negative (absent) in the weeks immediately following irradiation, and that the late-onset appearance of RN occur
Fig 1. Gamma-Knife dose radiation contours superimposed on a CT image of a mouse.Panels A, B, and C show sagittal, coronal, and transaxial views, respectively. The three contours shown are at 75% (yellow), 50% (green), and 25% (orange) isodose. The red cross-hairs in each panel identify the location of the imaging planes shown in the other two panels.
within one to three months following irradiation. The focus on experimental tractability also motivated avoidance of highly fractionated (time consuming) irradiation schemes and a very late (many months) delayed occurrence of RN. Four cohorts of female Balb/c mice (n = 15 each) were irradiated with four different dose schedules: 60-Gy (50% isodose) in a single frac-tion, 60-Gy in three fractions given every 2 days, 50-Gy in a single fracfrac-tion, and 45-Gy in a sin-gle fraction, as described below. Serial MRI examinations and histology were used to
characterize the resultant brain parenchymal changes for each cohort. As will be shown, the 45- and 50-Gy single fraction irradiation schemes fully met the goal of providing an experi-mentally tractable mouse model of late-onset RN.
MR Imaging
Images were collected in an Agilent/Varian (Santa Clara, CA) 4.7-T small-animal MR scanner equipped with a DirectDriveTMconsole. The scanner is built around an Oxford Instruments (Tubney Woods, Abingdon, Oxfordshire, UK) 40-cm, clear-bore magnet equipped with 21-cm inner diameter, actively shielded Agilent/Magnex gradient coils (maximum gradient, 28 G/cm; rise time approximately 200μs) and International Electric Company (IEC; Helsinki, Finland)
model A–240 amplifiers (± 300 V and 300 A).
MRI data were collected using an actively decoupled coil pair: 1.5-cm outer diameter surface coil (receive) and a 9-cm inner diameter Helmholtz coil (transmit). Before the imaging experi-ments, mice were anesthetized with isoflurane/O2(3% [vol/vol]) and maintained on isoflurane/
O2(1% [vol/vol]) throughout the experiments. Mice were restrained in a laboratory-constructed
Teflon head holder with ear bars and a tooth bar. To maintain their body temperature at approx-imately 37°, mice were placed on a pad through which circulated warm water. Mice were injected intraperitoneally with 0.5 mL of MultiHance (gadobenate dimeglumine; Bracco Diagnostics) contrast agent, diluted 1:10 in sterile saline, immediately prior to positioning in the magnet.
Mice that received 60-Gy of radiation, in either single or three fractions, or single-fraction 50-Gy of radiation were imaged 4, 8, and 13 weeks post-irradiation. A subset of the mice that received single-fraction 45-Gy of radiation were imaged 4 weeks post-irradiation (no effect observed), and all mice making up the cohort were imaged at 7, 10, 13, 16, 19 and 22 weeks post-irradiation. The time interval between adjacent imaging sessions was chosen to ensure observable progression of RN on anatomic MR images. Mice were sacrificed immediately after the last imaging point (13 and 22 weeks post-irradiation for mice receiving 50/60-Gy and 45-Gy of radiation, respectively). Multislice, T2-weighted, spin-echo transaxial images were collected beginning ~3 minutes following intraperitoneal injection of contrast agent, with the following parameters: repetition time (TR) = 1.5 s, echo time (TE) = 0.05 s, field of view (FOV) = 1.5 x 1.5 cm2, slice thickness = 0.5 mm, 21 slices; total acquisition time = 12 minutes. Multislice,
T1-weighted, spin-echo transaxial images were then collected over five minutes with the follow-ing parameters: TR = 0.65 s, TE = 0.02 s, with the same geometry as the T2-weighted images.
Measuring Necrotic Volumes Quantitatively by MR Imaging
Regions of radiation necrosis appeared hyperintense on both contrast-enhanced T1-weighted and T2-weighted images. While either set of images could be used for quantitative analysis, we chose to calculate necrotic volumes from T2-weighted images, using image intensity histo-grams, as described previously [11].
Histology
brain was exposedin situby removing the calvarium, and fixation continued by immersing the head of each mouse in formalin for 24 hours. The brain was then extracted from the skull, and coronal sections were prepared, processed through graded alcohols, embedded in paraffin, and sectioned. Eight-micron-thick tissue sections were stained with hematoxylin and eosin (H&E). Briefly, the slides were de-paraffinized with 100% xylene, 100% ethanol, 90% ethanol, 80% eth-anol, and finally distilled water. Nuclei were stained with the alum hematoxylin and rinsed with running tap water, differentiated with 0.3% acid alcohol, and rinsed again with tap water. Slides were stained with eosin for two minutes, followed by a series of dehydration steps. Other samples were fixed in modified Zenker’s solution and stained, according to standard protocols, with either phosphotungstic acid-hematoxylin (PTAH) to demonstrate the presence of fibrin in tissue or with trichrome to reveal collagen deposition within the brain.
Statistical Analysis
The differences in MR-derived necrotic volumes for mice having different histological scores were summarized using means and standard deviations, and compared by one-way ANOVA. Due to the relatively large variability in MR-derived necrotic volumes, a logarithm transformation was performed to better satisfy the assumption of a normal distribution [14]. The correlation between MR results and histology scores was assessed using Kendall’s tau correlation coefficient [15]. All the tests were two-sided and a p-value of 0.05 or less was taken to indicate statistical sig-nificance. Statistical analysis was performed using SAS 9.3 (SAS Institutes, Cary, NC). The con-gruence in histologic scoring among multiple raters was assessed using the SAS macro MAGREE (http://support.sas.com/kb/25/006.html) and the strength of agreement was described by Ken-dall's coefficient of concordance, which ranges from 0 (no agreement) to 1 (complete agreement).
Results
MRI detects radiation necrosis as image hyperintensity in T2-weighted
images
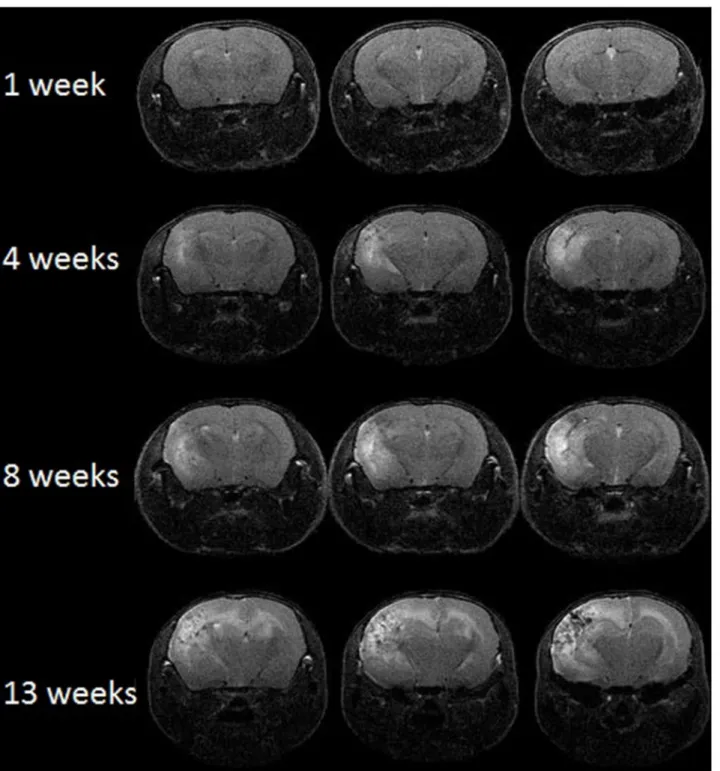
Representative contrast-enhanced T2-weighted spin-echo images of irradiated mice, covering the same anatomic region of the brain and collected at 1, 4, 8, and 13 weeks following a single 50-Gy dose of radiation, are shown inFig 2. Though not included in the volume measure-ments, some mice were imaged as early as one day post-irradiation, with no lesion observed. Hyperintense areas in these images, due to edema, correspond with regions of radiation necro-sis in the brain. MR images begin to show hyperintense regions at ~4 weeks post irradiation, and these regions expand significantly in extent by 13 weeks, indicating late onset and rapid progression of radiation necrosis.
Radiation dose schedules affect the onset and progression of radiation
necrosis
Neuropathological grading system in the murine model of radiation
necrosis
Histologic changes are shown in control and irradiated mice (Figs4and5). Changes include microhemorrhages, edema, vascular changes ranging from increased numbers of delicate Fig 2. MRI can monitor radiation necrosis in irradiated mouse brain.Representative contrast-enhanced, transaxial T2-weighted spin-echo images of irradiated mice at 1, 4, 8, and 13 weeks following a single 50-Gy (50% isodose) of radiation. Slices are chosen to display the same anatomic region of the brain at all four time points.
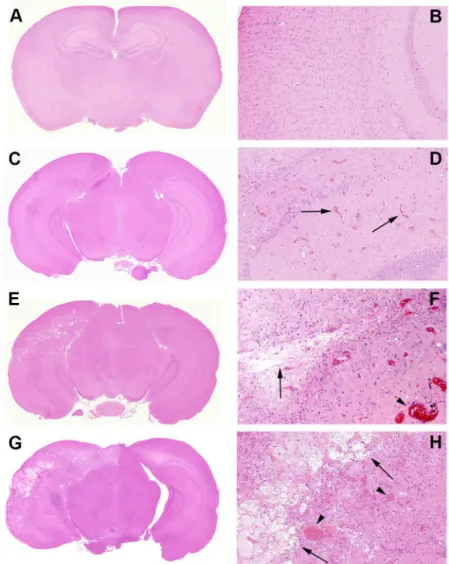
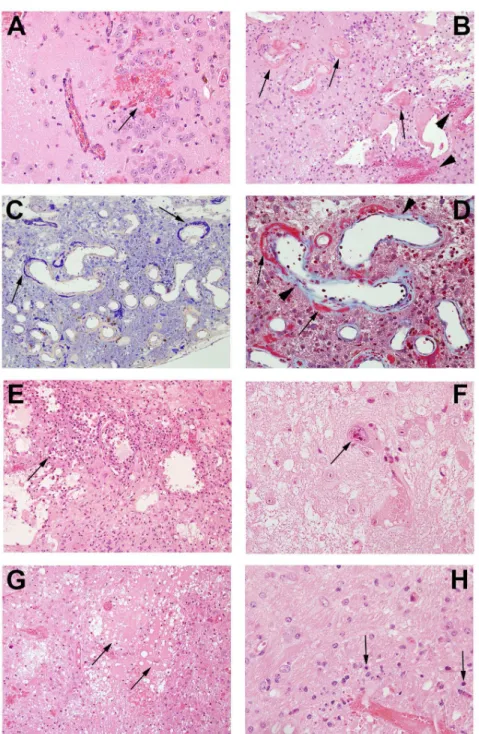
telangiectatic vessels to fibrinoid vascular necrosis and hyalinization, development of foamy macrophages, infiltration of polymorphonuclear leukocytes, astrocytosis, and loss of tissue ele-ments, ranging from neuronal loss to frank involvement of all tissue elements with microcavi-tation. The severity of histologic changes for a total of 96 mice was independently scored by three individuals, including a clinical neuropathologist (RES), in blinded fashion, using a semi-quantitative, 0 to 3 grading system.Fig 4shows typical changes characteristic of radiation necrosis in the weeks following irradiation of the murine brains at both low and high magnifi-cations.Grade 0was assigned to no histologic changes (Fig 4A and 4B).Grade 1described mild histological changes associated with radiation injury, including early events such as micro-hemorrhages accompanied by increased numbers of telangiectatic vessels (Fig 4C and 4D).
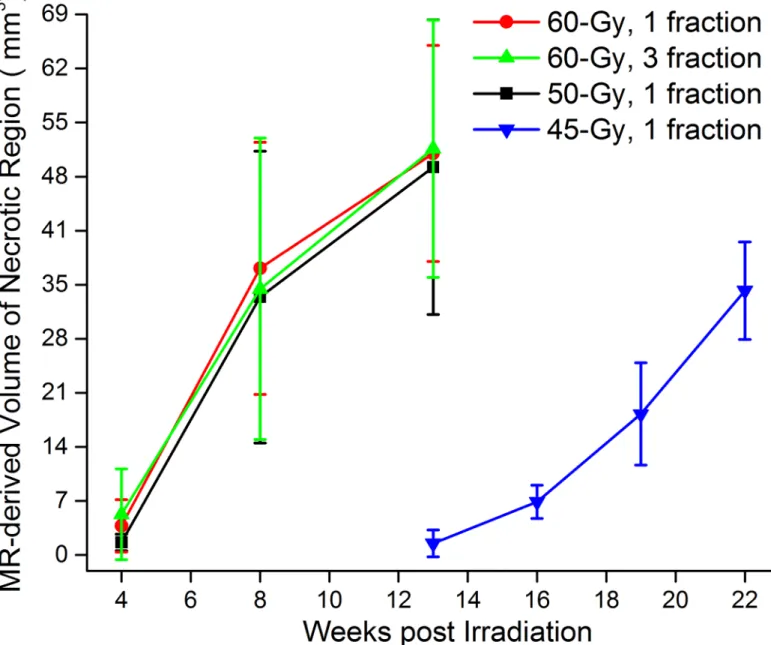
Grade 2injuries (Fig 4E and 4F), were characterized by moderate histologic changes, including Fig 3. MRI-derived necrotic volumes.Mean volumes±SD (n = 15),vs. time post-irradiation for mice irradiated hemispherically with different dose schedules: 60-Gy in 1 fraction (red), 60-Gy in 3 fractions (green), 50-Gy in 1 fraction (black) and 45-Gy in 1 fraction (blue).
changes seen in Grade 1 with the addition of vascular hyalinization, astrocytosis, and tissue loss.Grade 3injuries (Fig 4G and 4H) resembled those of Grade 2 but were more severe, often including extensive tissue loss. Grade 3 injuries also more frequently featured fibrinoid vascular necrosis. The agreement in histologic grading amongst the three independent scorers was mea-suredviaKendall’s concordance coefficient. The calculated value of Kendall’s coefficient was 0.86 (p<0.0001), indicating substantial concordance in grading amongst the scorers.
A more detailed characterization of Grade 3 lesions (Fig 4G and 4H) is shown inFig 5. Micro-hemorrhage and dilated vessels (Fig 5A) were observed in a majority of irradiated ani-mals. The most severely affected animals showed hyalinized vessels and fibrinoid vascular necrosis (Fig 5B); extensive fibrin deposition, highlighted by PTAH staining (blue regions;Fig Fig 4. Representative histologic slides showing irradiation damage of each grade.All mice were irradiated on the left hemisphere, as displayed. Panels A, C, E, and G are shown at 1x; Panels B, D, F, and H are shown at 10x magnification, thereby revealing more detail in the irradiated areas.Panels A and B (Grade 0):The irradiated brain shows no pathological changes.Panels C and D (Grade 1):The earliest histological events were micro-hemorrhage accompanied by increased numbers of telangiectatic vessels (arrows).
Panels E and F (Grade 2):Typically larger parenchymal hemorrhages (arrowhead) and tissue loss (arrows) are observed, with approximately one-half to two-thirds of the left hemisphere involved.(Panels G and H (Grade 3):More extensive areas are typically involved, with severe tissue damage, including fibrinoid vascular necrosis (arrowheads) and tissue loss (arrows).
5C); and trichrome staining (red-stained regions;Fig 5D). Collagen surrounding the vessel walls was also visualized with trichrome staining (blue material,Fig 5D). These vascular changes were accompanied by macrophages clustered in damaged areas of necrosis (Fig 5E) and a few cells that showed radiation-induced atypia (Fig 5F). Edema formed in the center of Fig 5. Pathological features in post-irradiation mouse brain. A.Micro-hemorrhage and dilated vessels (arrow, 20X);B.Hemorrhage (arrowheads) and fibrinoid vascular necrosis (arrows) (H&E staining, 20X);C.
PTAH staining shows fibrinoid vascular necrosis in dark blue (arrows, 20X);D.Trichrome staining demonstrates fibrinoid vascular necrosis (red, arrows) and collagen deposition (light blue, arrow heads) (60X);E.Macrophages surrounding damaged tissues (arrow, 20x);F.Cellular atypia (arrows,60X);G.
Edema (arrows,20X);H.Neuronal necrosis (arrows, 60X).
the damaged regions of brains (Fig 5G), with decreased neuronal/glial cell density and a paucity of blood vessels and parenchymal structures. Degenerating neurons were characterized by loss of cytoplasm and condensed pyknotic nuclei (Fig 5H).
Histological scores for radiation necrosis correlate with MR-derived
necrotic volumes
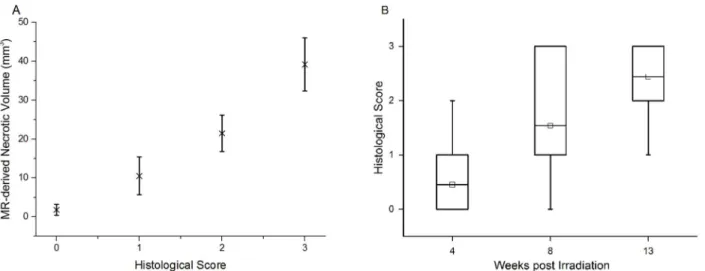
Consistent with the earliest appearance of hyperintensity in MR images, tissue damage was first noted at three to four weeks post radiation in animals that received a single fraction of 50-or 60-Gy of radiation. By histologic examination, no specific changes suggestive of radiation injury were observed at earlier post-irradiation time points. For each graded histology slide, the MR-derived necrotic volume was calculated from the T2-weighted image for a single slice, cov-ering the same anatomic features as the histological slide. The average MR-derived necrotic volumesvs. histological scores are plotted inFig 6A. The two measures are highly correlated (correlation coefficient = 0.948, with p<0.0001) and the differences among the four cohorts (n = 30, 37, 27, and 53 for Grade 0, 1, 2, and 3, respectively) are all statistically significant (p<0.0001). Further, the correlation between histological score and time post irradiation (cor-relation coefficient = 0.508, with p<0.0001) is displayed inFig 6B. The differences among the three cohorts (n = 17, 15, and 20 for 4, 8, and 13 weeks following 50/60-Gy of radiation) are all statistically significant (p<0.0001). These strong correlations help to validate the MR results and demonstrate that the histologic grading system is a useful tool for the classification of the severity of radiation necrosis.
Discussion
An optimized mouse model of cerebral radiation necrosis incorporates several important fea-tures, including: i) consistent induction of late time-to-onset necrosis following irradiation; ii) characteristic MR imaging changes that allow clear identification of necrotic regions; iii) tissue injury whose histology accurately matches pathological findings in brain tissue from patients with confirmed radiation necrosis; iv) progression of necrosis occurs over an experimentally Fig 6. Histologic scores correlate with MR-derived necrotic volumes and post-irradiation time. A.Correlation between MR-derived necrotic volumes and histological scores. MR-derived volumes, mean±SD (n = 30, 37, 27, and 53 for Grade 0, 1, 2, and 3, respectively), of radiation necrosisvs. histological score for irradiated mice, independent of specific radiation dose (45–60 Gy) and treatment schedules.B.Correlation between histological scores and time
post irradiation. Box-and-whisker plots of the histological scores for mice receiving 50/60-Gy of radiation, at 4, 8, and 13 weeks post irradiation. The 25th-75th percentiles are blocked by the box, the band inside the box is the mean, and the whiskers mark the maximum and minimum values.
appropriate period of time, thereby enabling longitudinal imaging studies to characterize the onset and development of necrosis and its response to therapeutic interventions. Herein, the initiation and progression of necrosis in irradiated mice subjected to different radiation doses and fractionation schedules (60/50/45-Gy in a single fraction and 60-Gy in three fractions) were compared. We evaluated higher RT doses in the mouse model then those normally clini-cally administered to ensure the development of late cerebral RN in all cases. Our results dem-onstrate that mice receiving 60 Gy and mice receiving 50 Gy have similar patterns of RN onset and similar patterns of RN progression. Time-to-onset of necrosis following a single-fraction of 45-Gy irradiation occurs much later than with higher doses. Fractionation did not signifi-cantly delay onset of late cerebral RN compared to a single fraction, presumably due to the rela-tively high total RT doses (45–60 Gy) involved. In all cases, the onset of injury observable by either MRI or histology is delayed by several weeks following the irradiation. Thus, this mouse model truly illustrates late-onset injury, which is a hallmark of radiation necrosis.
The radiation dose-response relationship can be represented graphically by a curve that maps the biologic effects observed in relation to the radiation dose received. A variety of differ-ent linear and non-linear models, some including a threshold radiation dose for initiating tis-sue damage, have been proposed [16]. The sigmoid threshold curve of radiation dose-response is commonly employed in radiotherapy to demonstrate high-dose cellular response. Changes in the induction threshold for radiation injury have been described as shifts toward the right or left of this sigmoid curve [16]. In terms of the development of RN, a decrease of radiation dose from 50-Gy to 45-Gy causes a much more dramatic difference than a decrease from 60-Gy to 50-Gy, suggesting that the rapidly changing part of the sigmoid curve includes the 45–50 Gy range (Fig 3).
Consistent with this proposition, we have successfully employed radiation doses of 45 Gy in studies with GSK–3βinhibitors as neuroprotectants [11] and 50 Gy in studies of anti-VEGF antibodies as mitigators of RN [10]. These radiation doses provide appropriate observation win-dows (from 4-to–13 weeks post irradiation) for the development of late-onset necrosis, with evi-dent weekly changes in the volume of the necrotic region. While these radiation doses are somewhat higher than standard clinical doses in single-fraction, stereotactic radiosurgery (typi-cal radiation doses for treatment of brain tumors or arteriovenous malformations [17] are 15 Gy and 24 Gy (50% isodose), respectively), our goal was to induce RN in all cases, rather than avoid or minimize its severity. Radiation necrosis is difficult to distinguish from recurrent tumor using conventional, anatomic, T1- and T2-weighted MRI. We, and others, have explored the use of advanced MR methods, such as diffusion-weighted [DWI], magnetization transfer [MT], dynamic contrast enhanced [DCE] (vascular permeability) and dynamic susceptibility contrast [DSC] (perfusion) MRI methods for distinguishing RN and tumor [12,18–24]. The observation of RN that is histologically similar to that induced in patients suggests that our mouse model can serve as a platform for the identification and validation of imaging biomarkers, and can be readily translated to support the development of improved clinical treatment paradigms.
Conclusions
A novel, robust murine model of late time-to-onset radiation necrosis that recapitulates signifi-cant features of RN that occur in response to a number of clinical treatment paradigms, includ-ing the late onset of radiation changes and well-described histologic changes, has been
paradigms, examine mechanisms involved in the onset and progression of delayed RN and its response to therapeutic interventions, and develop imaging biomarkers for differentiating RN from recurrent tumor.
Supporting Information
S1 Table. Animal Research: Reporting In Vivo Experiments (ARRIVE) Guidelines. Com-pleted ARRIVE checklist.
(PDF)
Author Contributions
Conceived and designed the experiments: RED RES KMR DEH JJHA JRG. Performed the experiments: XJ JAE JC CJPT LY RED. Analyzed the data: XJ JAE CJPT LY RES FG DT JRG. Wrote the paper: XJ CJPT DT RED RES KMR DEH JJHA JRG.
References
1. Kumar AJ, Leeds NE, Fuller GN, Van Tassel P, Maor MH, Sawaya RE, et al. (2000) Malignant gliomas: MR imaging spectrum of radiation therapy- and chemotherapy-induced necrosis of the brain after treat-ment. Radiology 217: 377–384. PMID:11058631
2. Giglio P, Gilbert MR (2003) Cerebral radiation necrosis. Neurologist 9: 180–188. PMID:12864928 3. Clarke MF, Dick JE, Dirks PB, Eaves CJ, Jamieson CH, Jones DL, et al. (2006) Cancer stem cells–
-per-spectives on current status and future directions: AACR Workshop on cancer stem cells. Cancer Res 66: 9339–9344. PMID:16990346
4. Kumar S, Arbab AS, Jain R, Kim J, deCarvalho AC, Shankar A, et al. (2012) Development of a novel animal model to differentiate radiation necrosis from tumor recurrence. Journal of Neuro-Oncology 108: 411–420. doi:10.1007/s11060-012-0846-zPMID:22407176
5. Mori Y, Kondziolka D, Balzer J, Fellows W, Fickinger JC, Lunsford LD, et al. (2000) Effects of stereotac-tic radiosurgery on an animal model of hippocampal epilepsy. Neurosurgery 46: 157–165. PMID:
10626946
6. van der Worp HB, Sena ES, Donnan GA, Howells DW, Macleod MR (2007) Hypothermia in animal models of acute ischaemic stroke: a systematic review and meta-analysis. Brain 130: 3063–3074.
PMID:17478443
7. Wong CS, Van der Kogel AJ (2004) Mechanisms of radiation injury to the central nervous system: impli-cations for neuroprotection. Molecular Interventions 4: 273–284. PMID:15471910
8. Zhou JY, Tryggestad E, Wen ZB, Lal B, Zhou TT, Grossman R, et al. (2011) Differentiation between gli-oma and radiation necrosis using molecular magnetic resonance imaging of endogenous proteins and peptides. Nature Medicine 17: 130–U308. doi:10.1038/nm.2268PMID:21170048
9. Jost SC, Hope A, Kiehl E, Perry A, Travers S, Garbow JR (2009) A Novel Murine Model for Localized Radiation Necrosis and Its Characterization Using Advanced Magnetic Resonance Imaging. Interna-tional Journal of Radiation Oncology Biology Physics 75: 527–533.
10. Jiang X, Engelbach JA, Yuan L, Cates J, Gao F, Drzymala RE, et al. (2014) Anti-VEGF antibodies miti-gate the development of radiation necrosis in mouse brain. Clin Cancer Res 20: 2695–2702. doi:10.
1158/1078-0432.CCR-13-1941PMID:24647570
11. Jiang X, Perez-Torres CJ, Thotala D, Engelbach JA, Yuan L, Cates J, et al. (2014) A GSK-3beta inhibi-tor protects against radiation necrosis in mouse brain. Int J Radiat Oncol Biol Phys 89: 714–721. doi:
10.1016/j.ijrobp.2014.04.018PMID:24969790
12. Perez-Torres CJ, Engelbach JA, Cates J, Thotala D, Yuan L, Schmidt RE, et al. (2014) Toward distin-guishing recurrent tumor from radiation necrosis: DWI and MTC in a Gamma Knife–-irradiated mouse
glioma model. Int J Radiat Oncol Biol Phys 90: 446–453. doi:10.1016/j.ijrobp.2014.06.015PMID:
25104071
13. Perez-Torres CJ, Yuan L, Schmidt RE, Rich KM, Ackerman JJ, Garbow JR (2015) Perilesional edema in radiation necrosis reflects axonal degeneration. Radiat Oncol 10: 33. doi: 10.1186/s13014-015-0335-6PMID:25636531
15. Conover WJ (1999) Practical nonparametric statistics. New York: Wiley. 584 p.
16. Schollnberger H, Mitchel RE, Azzam EI, Crawford-Brown DJ, Hofmann W (2002) Explanation of protec-tive effects of low doses of gamma-radiation with a mechanistic radiobiological model. Int J Radiat Biol 78: 1159–1173. PMID:12556343
17. Flickinger JC, Kondziolka D, Maitz AH, Lunsford LD (2002) An analysis of the dose-response for arte-riovenous malformation radiosurgery and other factors affecting obliteration. Radiother Oncol 63: 347–
354. PMID:12142099
18. Cha J, Kim ST, Kim HJ, Kim HJ, Kim BJ, Jeon P, et al. (2013) Analysis of the layering pattern of the apparent diffusion coefficient (ADC) for differentiation of radiation necrosis from tumour progression. Eur Radiol 23: 879–886. doi:10.1007/s00330-012-2638-4PMID:22903642
19. Hein PA, Eskey CJ, Dunn JF, Hug EB (2004) Diffusion-weighted imaging in the follow-up of treated high-grade gliomas: tumor recurrence versus radiation injury. AJNR Am J Neuroradiol 25: 201–209.
PMID:14970018
20. Hu LS, Baxter LC, Smith KA, Feuerstein BG, Karis JP, Eschbacher JM, et al. (2009) Relative cerebral blood volume values to differentiate high-grade glioma recurrence from posttreatment radiation effect: direct correlation between image-guided tissue histopathology and localized dynamic susceptibility-weighted contrast-enhanced perfusion MR imaging measurements. AJNR Am J Neuroradiol 30: 552–
558. doi:10.3174/ajnr.A1377PMID:19056837
21. Hu LS, Eschbacher JM, Heiserman JE, Dueck AC, Shapiro WR, Liu S, et al. (2012) Reevaluating the imaging definition of tumor progression: perfusion MRI quantifies recurrent glioblastoma tumor fraction, pseudoprogression, and radiation necrosis to predict survival. Neuro Oncol 14: 919–930. doi:10.1093/
neuonc/nos112PMID:22561797
22. Schlemmer HP, Bachert P, Henze M, Buslei R, Herfarth KK, Debus J, et al. (2002) Differentiation of radiation necrosis from tumor progression using proton magnetic resonance spectroscopy. Neuroradi-ology 44: 216–222. PMID:11942375
23. Zeng QS, Li CF, Liu H, Zhen JH, Feng DC (2007) Distinction between recurrent glioma and radiation injury using magnetic resonance spectroscopy in combination with diffusion-weighted imaging. Int J Radiat Oncol Biol Phys 68: 151–158. PMID:17289287